Implications
The observation that differences in prepartum body condition do not translate into postpartum differences in insulin tolerance in cows without a clinical disease supports the likelihood that not all overconditioned prepartum dairy cows are at risk for metabolic disease. One possibility for future work is to develop approaches to distinguish at-risk overconditioned cows. We confirm that indirect measurements of insulin sensitivity are not suitable to assess changes in insulin action during the peripartum; therefore, they should be avoided even though the ability to measure circulating glucose, fatty acids and ketones is accessible and affordable.
Introduction
Reduced insulin signalling in adipose tissue may enhance lipolysis during early lactation, and raise circulating fatty acids (FA) and promote hepatic lipid deposition and ketogenesis. Elevated body condition score (BCS) can predispose dairy cows to a greater magnitude of FA mobilization during early lactation (Holtenius et al., Reference Holtenius, Agenäs, Delavaud and Chilliard2003; Rico et al., Reference Rico, Saed Samii, Mathews, Lovett, Haughey and McFadden2017). Suppressed insulin sensitivity may explain why prepartum overweight dairy cows exhibit greater FA mobilization postpartum. Pregnant cows with moderate body condition that gain weight through week 1 prepartum exhibited a decrease in glucose clearance rate (CR) following glucose challenge postpartum (Holtenius et al., Reference Holtenius, Agenäs, Delavaud and Chilliard2003). In contrast, glucose CR was not related to BCS when recorded 3 weeks postpartum in dairy cows with moderate FA mobilization (Jaakson et al., Reference Jaakson, Ling, Samarütel, Ilves, Kaart and Kärt2013). De Koster et al. (Reference De Koster, Hostens, Van Eetvelde, Hermans, Moerman, Bogaert, Depreester, Van den Broeck and Opsomer2015) evaluated dairy cows during late gestation with variable BCS and observed that maximal steady-state glucose infusion rate during a hyperinsulinemic-euglycemic clamp was inversely related with BCS and basal circulating FA concentrations. Recent findings suggest that overweight cows develop adipose tissue insulin antagonism prepartum and BCS does not alter insulin sensitivity of adipose tissues regarding glucose metabolism postpartum (Jaakson et al., Reference Jaakson, Karis, Ling, IIves-Luht, Samarütel, Henno, Jõudu, Waldmann, Reimann, Pärn, Bruckmaier, Gross, Kaart, Kass and Ots2018).
Estimations of insulin sensitivity made via the use of surrogate indices rely on the measurement of circulating FA, glucose, insulin and β-hydroxybutyrate (BHB) levels in the basal state. Although the use of indices represents a practical and minimally invasive approach to determine insulin sensitivity, their usefulness to compare estimates of insulin sensitivity across stages of lactation has been recently challenged (e.g. Mann et al., Reference Mann, Leal Yepes, Duplessis, Wakshlag, Overton, Cummings and Nydam2016). Therefore, our objectives were to examine the effect of prepartum BCS on glucose and insulin tolerance, and compare direct and indirect measurements of insulin sensitivity during peripartum. We hypothesized that cows with elevated prepartum BCS display lower systemic insulin sensitivity during the peripartum.
Materials and methods
Experimental design
Experimental procedures were approved by the Institutional Animal Care and Use Committee at West Virginia University (Morgantown). The experiment was completed at Dovan Farms (Berlin, PA, USA). Fourteen multiparous Holstein cows (parity 2 to 4) were enrolled 28 days before expected parturition, and allocated to one of two groups according to their BCS under an 5-point scale by three independent investigators, as either lean (n = 7; BCS = 2.93 ± 0.16) or overweight (overconditioned; n = 7; BCS = 4.01 ± 0.20). Body weights and BCS were recorded weekly. Cows were housed on a straw bedding and trained to access feed from Calan gate feeders (American Calan, Inc., Norwood, NH, USA) from enrolment through six DIM. Cows were moved to adjacent free-stalls from seven days in milk through study completion. Cows had free access to water, and diets were fed ad libitum, and were formulated to meet nutrient recommendations (Supplementary Table S1; NRC, 2001). Cows were milked twice daily at 0800 and 1800 h. Cows were fed once (0800 h) and twice (0800 and 1900 h) daily during pregnancy and lactation, respectively.
Sample collection and analyses
Samples of the total mixed ration were collected weekly throughout the experiment, and nutrient composition of TMR was analysed using near-infrared spectroscopy (AOAC method 989.03) by Cumberland Valley Analytical Services Inc. (Cumberland, MD, USA). Blood collection (10 mL) by coccygeal venipuncture occurred prior to morning feeding on day −28, −21, −14, −7 and −5, relative to expected calving, and day 0, 2, 4, 7, 14 and 21 postpartum. Plasma concentrations of FA, glucose and BHB were determined by enzymatic methods using commercial kits, as previously described (Rico et al., Reference Rico, Saed Samii, Mathews, Lovett, Haughey and McFadden2017). Intra- and interassay coefficient of variations for all colorimetric assays were <5 and <10%, respectively. Milk samples were collected on day 2, 3, 4, 5, 6, 7, 10, 14 and 21 postpartum, preserved with 1 Bronopol tablet (D&F Control Systems, San Ramon, CA, USA), and analysed for components.
Glucose and insulin tolerance testing
On day −27 and −14 relative to expected calving, and on day 4 postpartum, jugular catheters were inserted, and patency was maintained by flushing with heparinized saline every 12 h for 2 days. Intravenous insulin and glucose tolerance tests (ITT and GTT, respectively) were performed using previously described methods (Pires et al., Reference Pires, Souza and Grummer2007). Intravenous ITT were performed on day −26 and −13 before expected calving, and on day 5 postpartum. Intravenous GTT were performed on day −25 and −12, relative to expected calving, and day 6 postpartum.
Calculations and statistical analysis
Glucose CR, time to reach half maximal concentration (T 1/2) and time to reach basal concentration (T basal) were calculated according to the methods described by Pires et al. (Reference Pires, Souza and Grummer2007): glucose CR (%/min) = [(ln glucose at 10 min – ln glucose at time point 60 min)/60] × 100, T 1/2 (min) = [(ln 2)/CR] × 100, T basal (min) = [(ln glucose at 10 min – ln glucose at 60 min)/CR] × 100. Glucose area under the curve (AUC) during a GTT was calculated using the trapezoidal method. Glucose-stimulated reductions in FA were calculated as percent change from basal. Baseline glucose concentrations were calculated as the mean of measurements at −10 and 0 min, relative to start of challenge. Circulating insulin was converted from gravimetric units into international units as specified by Abuelo et al. (Reference Abuelo, De Koster, Hernández, Opsomer, Grufman and Castillo2012). The indices for insulin sensitivity, quantitative insulin sensitivity check index (QUICKI), revised QUICKI (RQUICKI), RQUICKI including BHB (RQUICKIBHB ) and homeostasis model of insulin resistance (HOMA-IR) were calculated using glucose, insulin, FA and BHB plasma concentrations. Changes in BCS and body weight (BW) of lean and overweight cows were calculated as the differences between values at day −21 prepartum and day 21 postpartum.
Data with repeated measures over time were analysed under mixed-effects model that included the random effect of cow and the fixed effects of BCS, day relative to parturition or period and their interaction. Covariance structures were evaluated, and denominator degrees of freedom calculated, as previously described (Rico et al., Reference Rico, Saed Samii, Mathews, Lovett, Haughey and McFadden2017). The equal variance assumption was evaluated by examining box plots and using the Levene’s test. When the BCS effect or BCS × time were significant, the SLICE option of SAS (version 9.3; SAS Institute Inc., Carry, NC, USA) was used to compare treatment differences at individual time points. Non-parametric Spearman’s rank-order correlations were performed in order to determine associations between surrogate indices of insulin sensitivity, direct measurements of insulin sensitivity and plasma metabolites. Significance was declared at P ≤ 0.05, and trends toward significance at 0.05 < P ≤ 0.10. Results are expressed as least squares means and their standard errors, unless stated otherwise.
Results
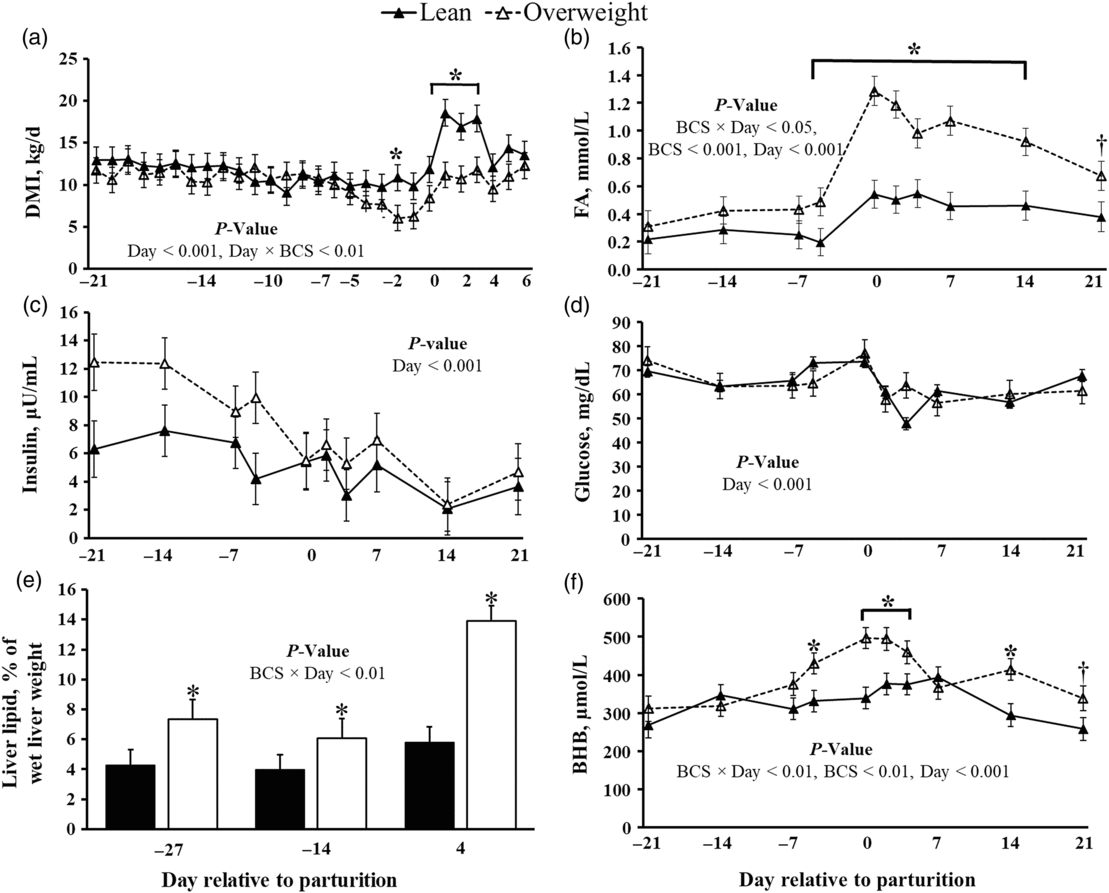
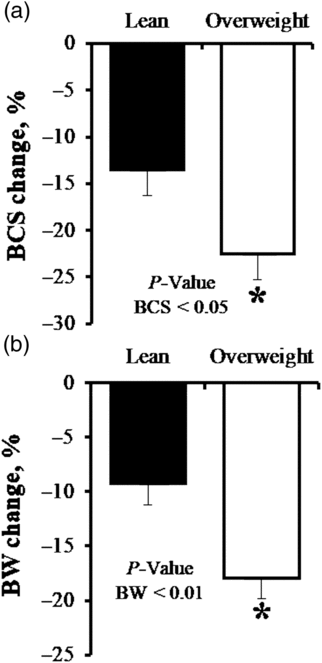
Relative to lean, cows with elevated prepartum BCS experienced a greater reduction in dry matter intake during the peripartum, and displayed increased plasma FA (P < 0.01, Figure 1). Indeed, peripartal overweight cows experienced accelerated BW and BCS loss, relative to lean (Figure 2). Lactation performance was similar for lean and overweight cows, except that milk fat yield (P < 0.10) and content (P < 0.01) were greater in cows with high prepartum BCS (Supplementary Figure S1). Circulating insulin and glucose decreased during the transition (P < 0.001, Figure 1). Although our analysis did not detect a significant difference between BCS groups, plasma insulin levels increased linearly as BCS increased (P < 0.001, R 2 = 0.18; r = 0.42). Increased hepatic FA influx did contribute to liver lipid accumulation in overweight cows (P < 0.01; Figure 1), which was 2-fold greater by day 4 postpartum, relative to lean cows. Increased liver lipid deposition in overweight cows developed with elevated plasma BHB concentrations (P < 0.05, Figure 1).
Effect of prepartum BCS on metabolic status in dairy cows transitioning from gestation to lactation. (a) Continuous DMI. Plasma concentrations of (b) FA, (c) insulin, (d) glucose, (e) per cent liver lipid and (f) BHB. BCS groups differed at each time point: *P< 0.05; † P< 0.10. Data are represented as least squares means and their standard errors. BCS = body condition score; DMI = dry matter intake; FA = fatty acids; BHB = β-hydroxybutyrate.

Effect of prepartum BCS on body condition and weight loss in peripartal dairy cows. Overweight dairy cows lost more body condition and weight relative to lean dairy cows. (a) Per cent change in BCS prepartum and (b) percent change in BW prepartum. *P< 0.05. Data are represented as least squares means and their standard errors. BCS = body condition score.

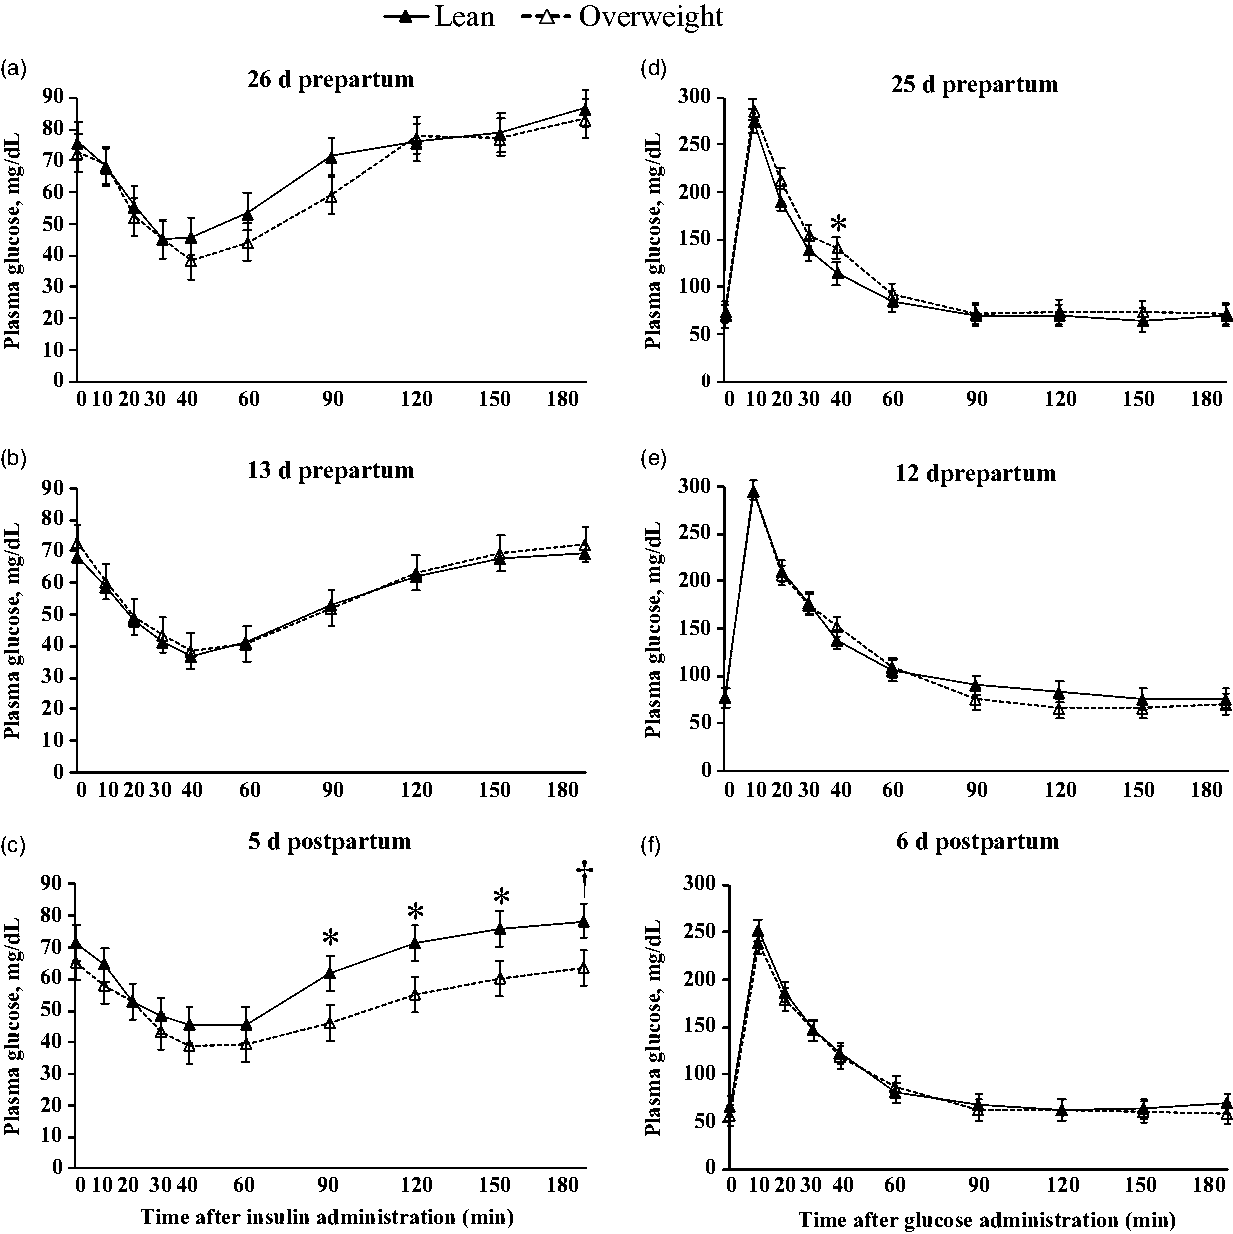
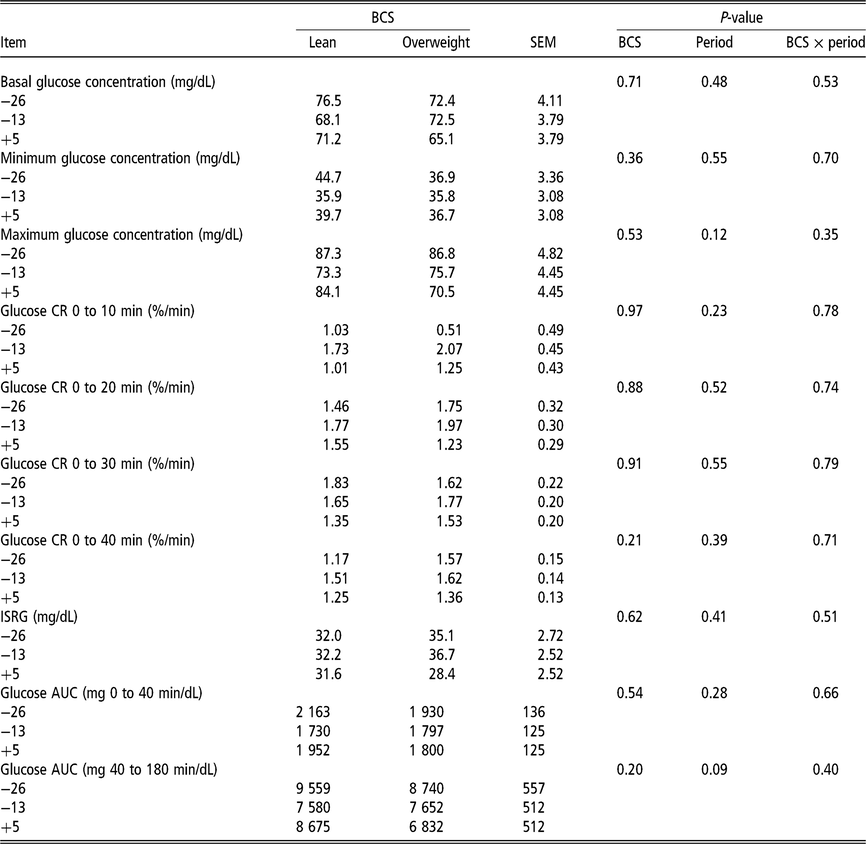
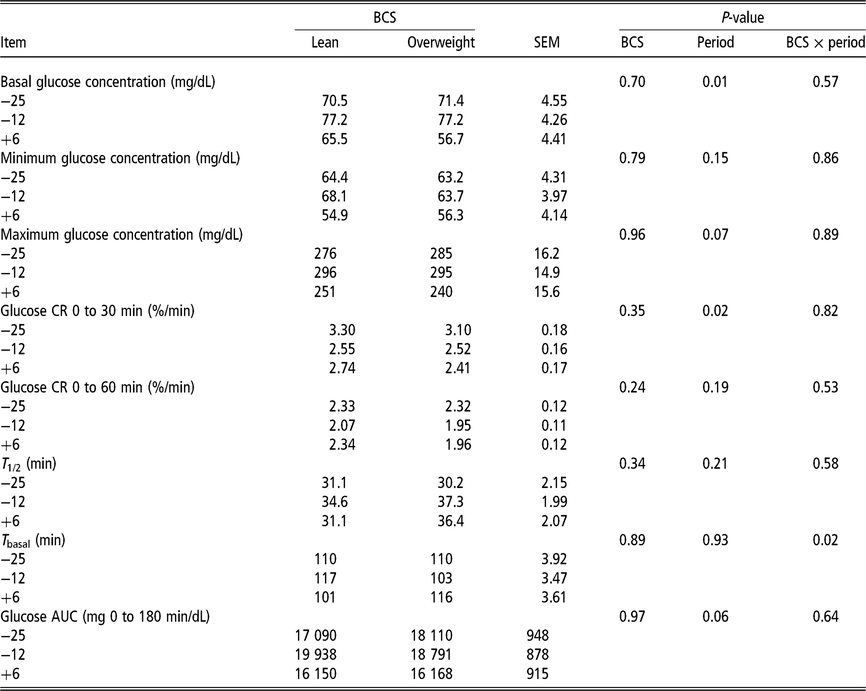
Overall, prepartum BCS did not modulate systemic glucose or insulin tolerance (Figure 3; Tables 1 and 2; Supplementary Figure S2). For example, we did not observe a decrease in insulin-stimulated reductions in glucose or glucose CR disposal (Tables 1 and 2); albeit plasma FA and liver lipid deposition differed markedly between lean and overweight cows. Nonetheless, postpartum reductions in GTT maximum glucose concentration (P = 0.07), glucose CR after 30 min (P < 0.05) and glucose AUC for the duration of the evaluation (P = 0.06) were observed for all cows (Table 2). An interaction between BCS and period relative to parturition (P < 0.01) for plasma glucose concentrations in response to an ITT was also detected (Figure 3). This corresponded to postpartum elevations in plasma glucose concentrations in lean cows starting at 90 min post insulin challenge (P < 0.01, Figure 3), relative to overweight cows.
Effect of prepartum BCS on plasma concentrations of glucose during an intravenous ITT and intravenous GTT performed in peripartal dairy cows. Insulin tolerance testing was completed at (a) 26 and (b) 13 days prepartum, and (c) 5 days postpartum. Glucose tolerance testing was completed at (d) 25 and (e) 12 days prepartum, and (f) 6 days postpartum. Baseline measurements represent the average of samples collected at −10 and 0 min relative to intravenous administration of 0.01 IU of insulin per kg of BW, and intravenous administration of 300 mg of dextrose per kg of BW. Fixed effects in model for ITT: BCS (not significant), Day < 0.001, and BCS × Day < 0.01. Fixed effects in model for GTT: BCS (not significant), Day < 0.001, and BCS × Day < 0.05. BCS groups differed at each time point: *P< 0.05; † P< 0.10. Data are represented as least squares means and their standard errors. BCS = body condition score; ITT insulin tolerance test; GTT = glucose tolerance test.

Effect of prepartum BCS on ITT parameters for plasma glucose in dairy cows during late gestation and early lactation

Data represent ITT performed at day 26 and 13 prepartum, and day 5 postpartum.
BCS = body condition score; ITT = insulin tolerance test; CR = clearance rate; ISRG = insulin-stimulated reductions in glucose; AUC = area under the curve.
Effect of prepartum BCS on GTT parameters for plasma glucose in dairy cows during late gestation and early lactation

BCS = body condition score; GTT = glucose tolerance test; CR = clearance rate; T 1/2 = time to reach half maximal glucose concentration; T basal = time to reach basal glucose concentration; AUC = area under the curve.
Data represent GTT performed at day 25 and 12 prepartum, and day 6 postpartum.
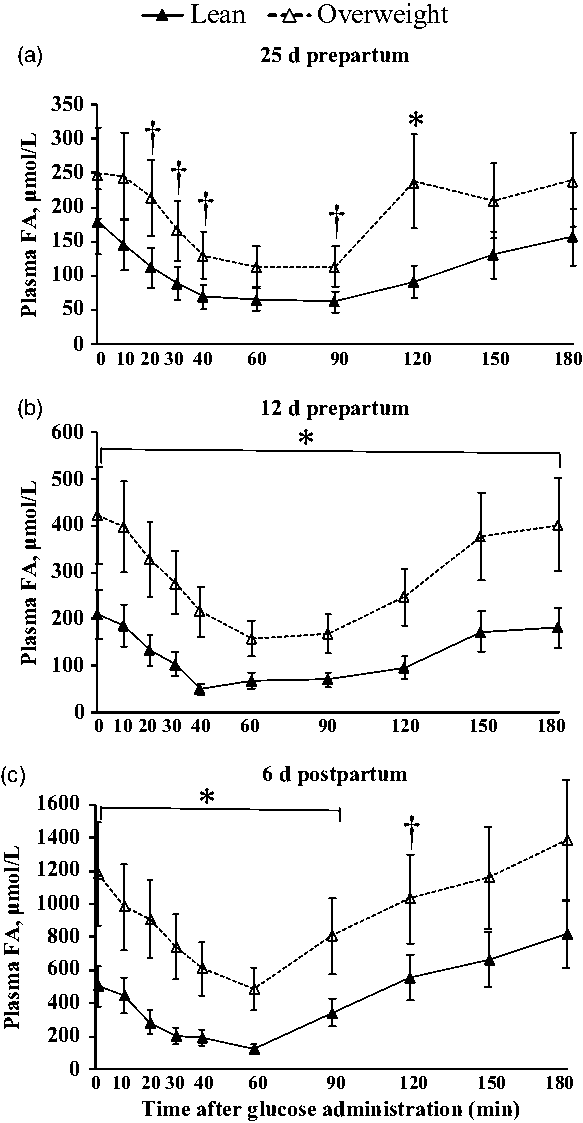
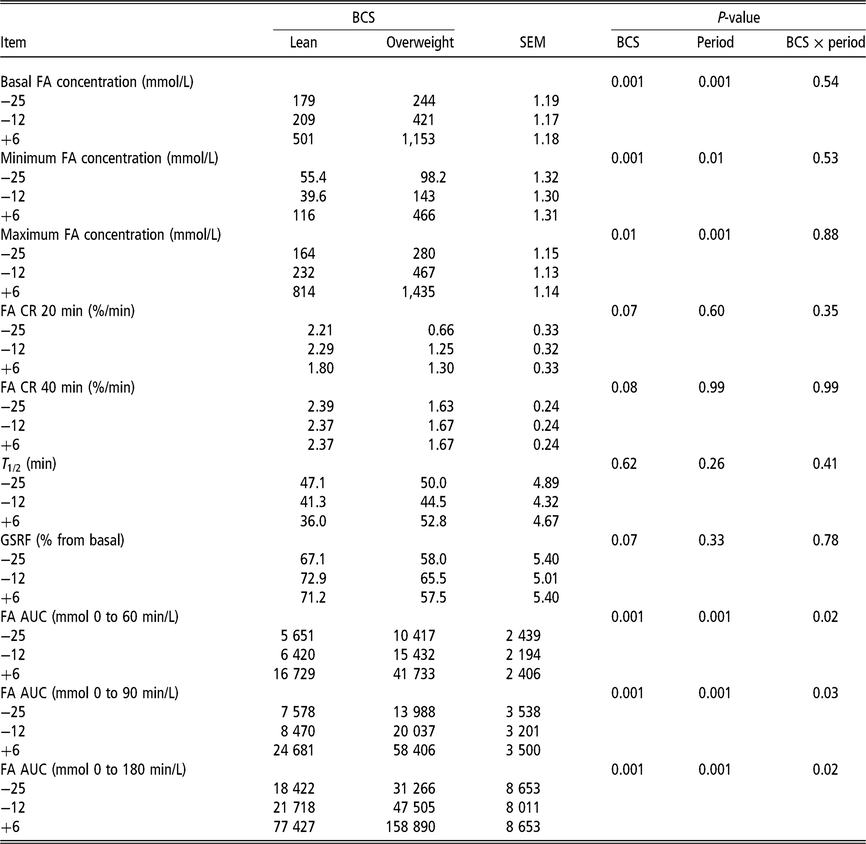
Plasma FA concentrations during each GTT are shown in Figure 4. Overweight cows had higher plasma FA concentrations during each GTT procedure. At day −25, plasma FA levels were greater in overweight cows at 120 min (P < 0.05) and tended to be higher at 20, 30, 40 and 90 min post glucose administration (P < 0.1), relative to lean cows. Peripartal differences in plasma FA during a GTT became more robust with time. Evaluation of GTT parameters that relate to FA responded similarly (Table 3). For example, overweight cows experienced increased maximal FA concentrations and AUC during each GTT. We also observed reductions in glucose-stimulated reductions in FA and FA CR with elevated prepartum BCS (P ≤ 0.08). Although plasma FA concentrations were greater in overweight cows, we did not observe an effect of BCS on FA disappearance within BCS group (Supplementary Figure S2).
Effect of prepartum BCS on changes in plasma FA concentrations during an intravenous GTT performed in peripartal dairy cows. Plasma FA concentrations during GTT completed on day (a) 25 and (b) 12 prepartum, and (c) day 6 postpartum. Baseline measurements represent the average of samples collected at −10 and 0 min relative to intravenous administration of 300 mg of dextrose per kg of BW. Fixed effects in model: BCS < 0.001, Day < 0.001 and BCS × Day < 0.001. BCS groups differed at each time point: *P< 0.05; † P< 0.10. Data are represented as least squares means and their standard errors. BCS = body condition score; FA = fatty acids; GTT = glucose tolerance test.

Effect of prepartum BCS on GTT parameters for plasma FA in dairy cows during late gestation and early lactation

BCS = body condition score; GTT = glucose tolerance test; FA = fatty acids; CR = clearance rate; T 1/2 = time to reach half maximal glucose concentration; GSRF = glucose-stimulated reductions in FA; AUC = area under the curve.
Data represent GTT performed at day 25 and 12 prepartum, and day 6 postpartum.
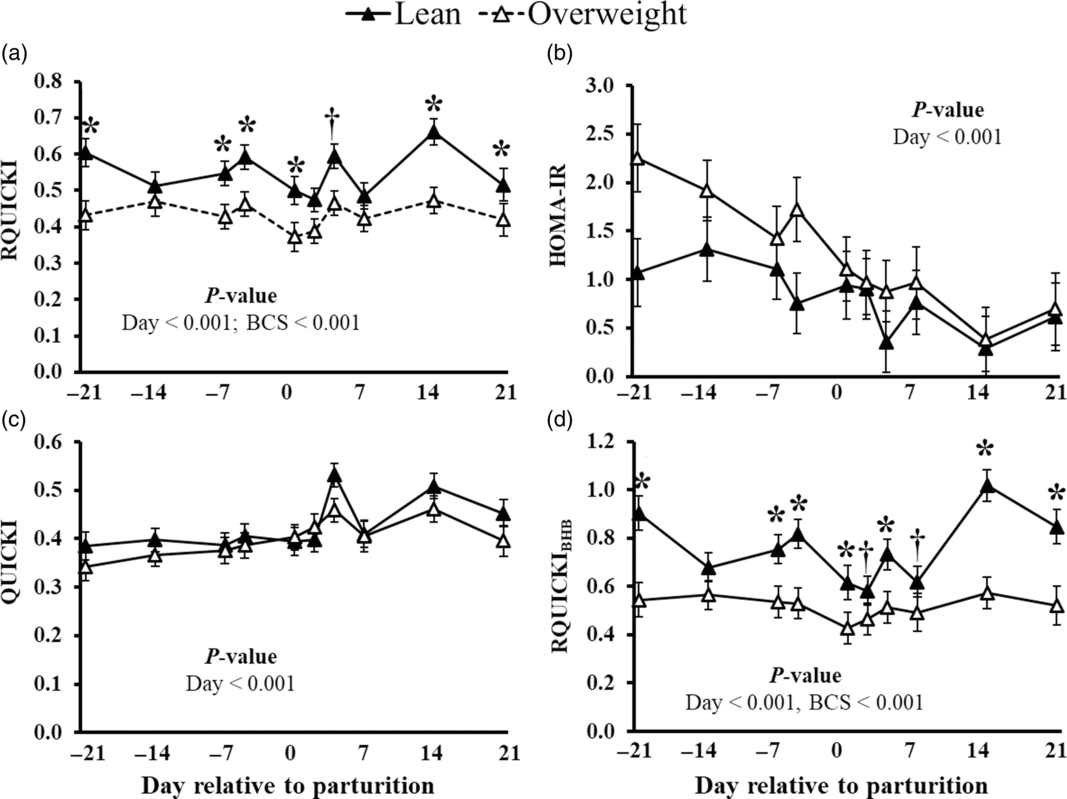
The effects of BCS on QUICKI, RQUICKI, RQUICKIBHB and HOMA-IR values obtained during the peripartum are presented in Figure 5. Higher BCS was associated with a decrease in estimated insulin sensitivity in RQUICKI and RQUICKIBHB, before and after parturition (P < 0.001), a response most pronounced for late gestation (P < 0.05). Correlations between surrogate indices and direct ITT and GTT parameters are shown in Supplementary Table S2. Weak positive correlations between glucose CR at time point 10 min with RQUICKI (ρ = 0.35; P = 0.05) and RQUICKIBHB (ρ = 0.28; P = 0.10) were observed. Additionally, FA AUC was weakly correlated with HOMA-IR (ρ = −0.37 to −0.34), QUICKI (ρ = 0.36 to 0.39) and RQUICKIBHB (ρ = −0.34 to −0.32; P ≤ 0.05).
Effect of prepartum BCS on surrogate indices of insulin sensitivity in periparturient dairy cows. Estimated insulin sensitivity as measured by the (a)RQUICKI, (b) HOMA-IR, (c) QUICKI and (d) RQUICKI including BHB (RQUICKIBHB). QUICKI = {1/[log glucose (mg/dL) + log insulin (µU/mL)]}, RQUICKI = {1/[log glucose (mg/dL) + log insulin (µU/mL) + log FA (mmol/L)]}, RQUICKIBHB = {1/[log glucose (mg/dL) + log insulin (µU/mL) + log FA (mmol/L) + log BHB (mmol/L)]} and HOMA-IR = {[glucose (mmol/L) × insulin (µU/mL)]/22.5}. BCS groups differed at each time point: *P< 0.05; † P< 0.10. Data are represented as least squares means and their standard errors. BCS = body condition score; RQUICKI = revised quantitative insulin sensitivity check index; HOMA-IR = homeostasis model of insulin resistance; QUICKI = quantitative insulin sensitivity check; BHB = β-hydroxybutyrate; FA = fatty acids.

Discussion
Glucose and insulin tolerance testing is widely used as a direct indicator of insulin sensitivity in ruminants (Holtenius et al., Reference Holtenius, Agenäs, Delavaud and Chilliard2003; Pires et al., Reference Pires, Souza and Grummer2007). We did not observe an effect of prepartum BCS on glucose tolerance. Work by Jaakson et al. (Reference Jaakson, Karis, Ling, IIves-Luht, Samarütel, Henno, Jõudu, Waldmann, Reimann, Pärn, Bruckmaier, Gross, Kaart, Kass and Ots2018) observed minor elevations in plasma glucose in prepartum cows identified as overconditioned; however, they did not observe an effect of prepartum BCS status on postpartum glucose tolerance. They did observe impairment of glucose action prepartum with elevations in circulating insulin. The positive relationship between BCS and circulating insulin in our study is in agreement with expected compensatory elevation of pancreatic insulin secretion of overconditioned cows described in the previous studies (e.g. Rico et al., Reference Rico, Saed Samii, Mathews, Lovett, Haughey and McFadden2017; Bogaert et al., Reference Bogaert, De Koster, Van Den Broeck, Van Eetvelde and Opsomer2018). Unfortunately, we did not measure changes in circulating insulin during the GTT; however, prepartum BCS may not have modulated systemic insulin action because insulin tolerance was also comparable between BCS groups.
The observed absence in glucose and insulin intolerance may indicate that overweight cows did not experience insulin antagonism in adipose tissue relative to lean cows. Rather, plasma FA concentrations may be higher in overweight cows because they had more adipose tissue than lean cows. This possibility is supported by the data from De Koster et al. (Reference De Koster, Hostens, Van Eetvelde, Hermans, Moerman, Bogaert, Depreester, Van den Broeck and Opsomer2015), who observed no association between insulin response of FA metabolism and prepartum BCS. In contrast, Zachut et al. (Reference Zachut, Honig, Striem, Zick, Boura-Halfon and Moallem2013) showed increased insulin resistance in adipose tissue of dairy cows with accelerated BCS loss postpartum. Because overweight cows in our study developed accelerated BW loss, it would be expected to find evidence of systemic insulin impairment in adipose tissue.
The delayed rise in circulating glucose in overweight cows in response to an insulin bolus may have been due to inadequate hepatic gluconeogenesis, caused by the observed increased severity of fatty liver (Mills et al., Reference Mills, Beitz and Young1986). However, this possibility is not supported by some studies, such as that of Weber et al. (Reference Weber, Schäff, Kautzsch, Börner, Erdmann, Görs, Röntgen, Sauerwein, Bruckmaier, Metges, Kuhla and Hammon2016), who did not observe endogenous glucose production differences between lean and overweight cows during peripartum. Moreover, the postpartum reductions in GTT parameters such as maximum glucose concentration, glucose CR after 30 min and glucose AUC may likely be attributed to the increased insulin-independent utilization of glucose by the mammary gland for milk production and not to improved insulin sensitivity.
Surrogate indices can serve as non-invasive, practical and inexpensive indicators of insulin sensitivity. However, their reliability for applying them to estimate insulin sensitivity during the peripartum has been questioned (De Koster et al., Reference De Koster, Hostens, Hermans, Van den Broeck and Opsomer2016; Mann et al., Reference Mann, Leal Yepes, Duplessis, Wakshlag, Overton, Cummings and Nydam2016; Alves-Nores et al., Reference Alves-Nores, Castillo, Hernandez and Abuelo2017). Elevated BCS was associated with reduced RQUICKI and RQUICKIBHB values during the transition period. Moreover, the observed lack of positive correlation between surrogate indices and direct measures is consistent with Mann et al. (Reference Mann, Leal Yepes, Duplessis, Wakshlag, Overton, Cummings and Nydam2016), which report poor correlation between direct measurements and index estimations of insulin sensitivity.
Although overweight dairy cows exhibit elevated prepartum insulin, postpartum FA and peripartal liver lipid deposition in parallel with a greater reduction in appetite, enhanced BCS during late gestation is not associated with overt modifications in glucose or insulin tolerance. Furthermore, we reaffirm that the usefulness of surrogate measures of systemic insulin sensitivity is indeed questionable, limiting their usefulness across the peripartal period.
Acknowledgements
This work was supported by the USDA Sustainable Agriculture Research and Education Program (#GNE13-067) and the USDA AFRI Competitive Grant (#WVA00902).
Sina Saed Samii 0000-0002-4218-3146
Declaration of interest
Nothing to declare.
Ethics statement
All work were performed following animal compliance approval from the West Virginia University Animal Care and Use Committee (ACUC Protocol #13-0710).
Software and data repository resources
None of the data were deposited in an official repository.
Supplementary material
To view supplementary material for this article, please visit https://doi.org/10.1017/S175173111900065X