Resilience is a multi-faceted concept that is adaptable to various contexts and disciplines. Reference Alexander1 It has become a “fashionable buzzword” in academic publications in recent years. Reference Boin, Comfort and Demchak2 Although the definitions and meanings of “resilience” vary in different disciplines, such as mechanics, ecology, psychology, sociology, and sustainability science, the core conceptualization of resilience refers to a system, either a building or an individual, family, community, or larger socio-eco system’s capacity to resist and adapt to changes. The changes are always referring to negative, external stressors with characteristics of disruptive and surprise, while the adaptation to changes could include the resistance, recovery, or evolution processes. Reference Alexander1,Reference Manyena3 Within the disaster risk reduction field, the definitions of resilience are more concrete. For example, the UNDRR (United Nations Office for Disaster Risk Reduction) conceptualized the term resilience as “The ability of a system, community or society exposed to hazards to resist, absorb, accommodate, adapt to, transform and recover from the effects of a hazard in a timely and efficient manner, including through the preservation and restoration of its essential basic structures and functions through risk management.” 4
Resilience can be operationalized at different levels, such as individual, family, community, city, or national. Reference Kimhi5,Reference Sim, Wang and Han6 Because most disasters impact a community, and most of the disaster responses and preparations are local, Reference Quarantelli7 enhancing the resilience of a community is critical; thus, the community resilience is widely proposed and adopted by disaster researchers as a metaphor for disaster and emergency management. Reference Norris, Stevens and Pfefferbaum8
Community resilience measures the capability of a community to anticipate risk, reduce impact and recover fast and better through adaptation and evolution. 9 Recent reviews indicate that there are 3 focuses of analysis framework and measurements of community resilience: the engineering-oriented approach, the socio-ecological approach, and the socio-psychological-intervention approach. Reference Asadzadeh, Kötter and Salehi10-Reference Sharifi12 One example of the engineering-oriented approach is Chang’s framework, which firmly focused on the technical, organizational, social, and economic dimensions of utilities and infrastructures, such as the electric power, water, and hospitals. Reference Chang and Shinozuka13 Susan Cutter’s Baseline Resilience Indicators for Communities (BRIC) is a compelling case of socio-ecological index mainly from the geography perspective. It proposed a method of constructing a community resilience index using census and other secondary data. The index can be used to monitor changes of resilience over time in a place and to compare 1 pace with another. Reference Cutter, Burton and Emrich14,Reference Cutter, Barnes and Berry15
The measurement tools alone cannot create resilience; thus, some community resilience measures with strong intervention purpose, like the CART (Community Advancing Resilience Toolkit), Reference Pfefferbaum, Pfefferbaum and Nitiéma16,Reference Pfefferbaum, Pfefferbaum and Van Horn17 the CCRAM (Conjoint Community Resilience Assessment Measures) Reference Cohen, Leykin and Lahad18,Reference Cui and Han19 and the Community Resilience and Preparedness Metrics Reference Eisenman, Chandra and Fogleman20,Reference Eisenman, Adams and Rivard21 are proposed by social psychologists and public health professionals recently. These intervention-oriented community resilience tools adopt a bottom-up method, and the researchers intend to find the gaps and then provide solutions to improve the resilience of communities. With the purpose of implementing interventions in the future, we adopted the CART measure in this study because it has been validated and tested in the Chinese context recently. Reference Cui, Han and Wang22
The most common elements of community resilience assessment tools can be divided into assets/attributes and capacities. Reference Cutter11 The assets could include the economic, environmental, infrastructure, social contents, while the capacities are the elements of social connection, planning, coordination, etc. Considering our purpose of promoting the community resilience by providing actionable interventions in the future, the sustainable livelihoods were conceptualized as assets, while the adoptions of preparedness activities were considered as capacities, and thus we explored the correlations between the livelihood assets, the preparedness activities, and the residents’ perception of community resilience.
The livelihoods approach advocated by humanitarian and development organizations is an excellent way to enhance people’s adaptability to external disturbances, especially in developing countries. Reference Birkmann23-Reference Twigg25 The livelihood assets from the sustainable livelihood framework, Reference Cannon, Twigg and Rowell26 social, human, physical, financial, and natural, can be enhanced by various activities, so people could have a higher capacity to adapt to external shocks. Prior studies have linked the concepts of livelihoods and resilience, and the human and social capitals are found to be critical in enhancing resilience. Reference Uy, Takeuchi and Shaw27 Meanwhile, the households with diversified livelihoods are more resilient to frequent shocks. Reference Thulstrup28
Preparedness is an essential way of enhancing community resilience. By educating and increasing individuals’, households’, communities’, and institutions’ awareness of risks and preparedness for disasters, the goals of a resilient family, community, or nation can be achieved. Reference Comfort, Boin and Demchak29-Reference Paton, McClure, Bürgelt, Paton and Johnston32 One example is the Los Angeles County Community Disaster Resilience (LACCDR) project. Reference Eisenman, Chandra and Fogleman20,Reference Chandra, Williams and Plough33 The academia and local public health department worked together developed a theoretical and empirical-based intervention and evaluation method of community resilience with pretest-posttest and control group design. A preparedness oriented community resilience metrics was generalized to measure the gaps of resilience and explore potential intervention solutions. Reference Eisenman, Adams and Rivard21,Reference Bromley, Eisenman and Magana34 The resilience of the community is actionable by increasing access to information (education), health, and social services, promoting self-sufficiency and engagement, and developing the partnership among multiple organizations.
Our research team has been conducting research in several counties severely affected by the 2008 Wenchuan earthquake in China since the catastrophe occurred. Reference Cui, Han and Wang22,Reference Han, Hu and Nigg35 The concepts of community resilience and action research were brought into our research priorities. By working with the local communities, government agencies, and nongovernmental organizations (NGOs), we hope we can help the locals to increase their resilience to disasters as disaster management experts.
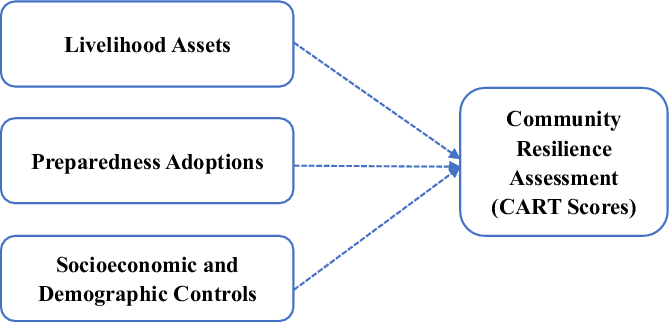
Following the theoretical rationale discussed above, livelihoods and preparedness activities could increase community resilience. Thus, we included the community resilience, livelihood assets, and disaster preparedness modules (Figure 1) in our most recent data collection effort, which was implanted in January 2018. In specific, we assume that: (1) respondents with higher livelihoods capitals (natural, human, social, physical, and financial) would have a higher assessment of community resilience; and (2) respondents with a higher degree of preparedness would have a higher evaluation of community resilience as well.
Analytic path diagram.

Methods
Data and Sampling
The data used for this study came from a longitudinal study covered 16 villages in 3 counties (Shifang County, Mianzhu County, and Pengzhou County) severely affected by the 2008 Wenchuan earthquake. The 3 counties were purposively selected, and the direct distance from Shifang, Mianzhu, and Pengzhou to the epicenter of the earthquake were 65 km, 77 km, and 45 km, respectively. The first data collection was implemented in 2009, and a stratified sampling method was used. The villages were randomly selected within the county. Then, the household registration records were obtained from the local government, and 40 households were randomly selected in each village.
A longitudinal research design was adopted in our study, and data collection efforts were conducted in 2009, 2010, 2012, and 2018, respectively, following the same households. Face-to-face interviews were conducted for all the surveys. Local college students were recruited and trained before each interview started. The interviewer filled the questionnaire and helped to explain each question to the respondents if they did not understand it the first time. In this study, we only used the data collected in January 2018 because the community resilience module was newly added, and 285 validated household questionnaire surveys were used for analysis.
Instruments and Measurements
Community Resilience
The CART developed by Pfefferbaum and her colleagues Reference Pfefferbaum, Pfefferbaum and Nitiéma16,Reference Pfefferbaum, Pfefferbaum and Van Horn17 was used to capture the rural villagers’ perception of community resilience. The original CART had 4 domains: Connection and Caring, Resources, Transformative Potential, and Disaster Management. An additional domain named Information and Communication was added in a later expanded version. The CART tool has been applied in assessing the community resilience in several communities in the United States, Reference Pfefferbaum, Pfefferbaum and Nitiéma16,Reference Pfefferbaum, Pfefferbaum and Van Horn17 and the results demonstrate that it is a good theory-based, evidence-informed instrument. A Chinese version has been translated and tested in rural communities in Southwest China later. Reference Cui, Han and Wang22 The results demonstrated that the CART is appropriate for this study with the purpose of implementing action research to enhance community resilience in the future.
The latest CART assessing toolkit has 26 items in total, locating in 5 domains: Connection and Caring (5 items), Resources (5 items), Transformative Potential (8 items), Disaster Management (4 items), and Information and Communication (4 items). A question “please indicate your agreement to the following statements” was used for all the 26 items. The answers to each of the items were measured by a 5-degree Likert scale from 1 to 5, representing the meaning from “totally disagree (1)” to “totally agree (5)”. The sum of the responded score within that domain was used as the score of the specific domain, and the sum of the responded scores of the total 26 items was considered as the overall community resilience score. The Cronbach’s alpha test result of the 26 CART items was 0.8350, while the results for the 5 domains were 0.8414 (Connection and Caring), 0.9102 (Resources), 0.9282 (Transformative Potential), 0.8413 (Disaster Management), 0.9576 (Information and Communication), respectively, indicating excellent internal consistency of all the 5 domains.
As shown in the online Supplementary Table 1, the mean value of the overall community resilience score was 89.23 (range: 31-130). Within each domain, the agreements to each of the statements also varied. The average value of the connection and caring domain was 18.27 (range: 9-25), with the highest rating of the statement “People in my community help each other,” and lowest rating of the statement “My community treats people fairly no matter what their background is.” Within the resources domain, the average value was 17.10 (range: 5-25), with the highest rating of the statement “People in my community know where to go to get things done,” and the lowest rating of the statement “My community has the resources it needs to take care of community problems.” The mean score of the transformative potential domain was 26.33 (range: 8-40), and the highest rating was “People in my community are aware of community issues that they might address together,” while the lowest rating was “My community works with organizations and agencies outside the community to get things done.” The disaster management domain had a mean value of 13.81 (range: 4-20), with the highest rating of “My community has services and programs to help people after a disaster” and the lowest rating of “My community tries to prevent disasters.” The highest-rated statement within the information and communication domain was “People in my community trust public officials,” while the lowest-rated was “I get information/communication from my community to help with my home and work life,” while the average value of this domain was 13.71 (range: 4-20).
Livelihood Capitals
The Sustainable Livelihood Approach (SLA) is a framework widely used in the development and anti-poverty studies. Reference Carney36 The core part of this framework is the 5 livelihood assets (financial, natural, physical, human, and social). When external stresses impact a household or a community, the household or community will adjust their livelihood strategies according to the livelihood assets they maintained, the macro policy changes, and external interventions. The 5 livelihood assets can also capture the outcomes of the adaptations; thus, the changes pre- and postexternal stresses could be measured, and the potential intervention effects can be evaluated. The SLA framework, especially the 5 livelihood assets are proposed as a vulnerability and resilience assessment framework recently, Reference Birkmann23 and it has been applied in disaster studies in many countries such as the United States and China. Reference Allison and Horemans37-Reference Peacock, Brody and Seitz39
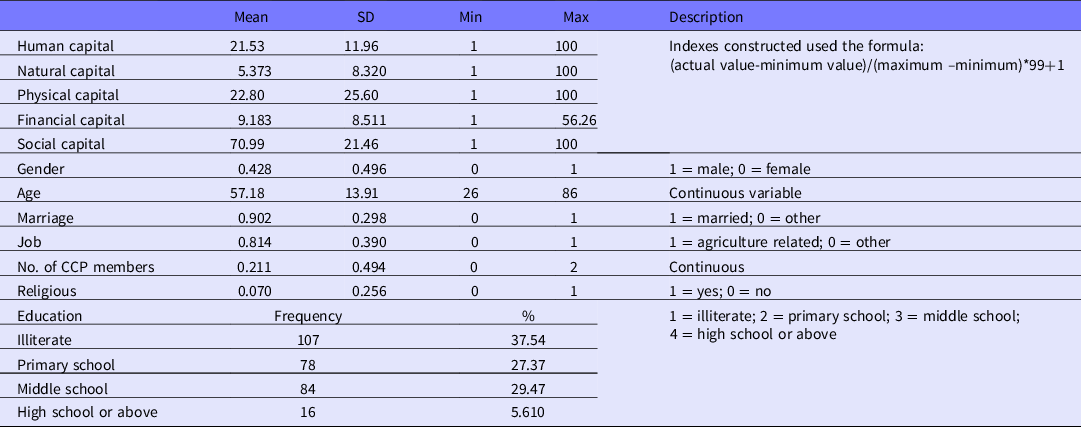
The 5 livelihood assets (financial, natural, physical, human, and social) indexes ranged from 1 to 100 were constructed using a method widely adopted by many index constructions, such as the United Nation’s Human Development Indices. 40 The financial capital was the household’s annual income. The natural capital was the total land owned by household members. The aggregated values of fixed assets like cars, computers, TVs, furniture, and real estate were used as physical capital. The human capital index was calculated from 4 variables: the number of household members, the number of full-time laborers within a household, the number of household members with skills or training certificate, and the highest educational attainment of household members. 41 The Cronbach’s alpha test of the 4 variables was 0.6417, indicating acceptable internal consistency. A human capital factor was predicted by factor analysis of the 4 variables. Unlike prior studies that measured social capital in multiple dimensions, Reference Han42 we only included the trust dimension in this study. The social capital was the sum of trust degrees in local officials and most of the people in the community. A 5-degree Likert scale was used to measure the degree of trust for each of the proposed target. All 5 livelihood capitals were transformed into indexes ranged from 1 to 10. The highest index was the social capital, with a mean value of 70.99 and a standard deviation of 21.46, while the lowest index was the natural capital with a mean value of 5.372 and a standard deviation of 8.320. The physical capital index ranked the second-highest, with a mean value of 22.80 (SD = 25.60), the human capital index ranked the third with a mean value of 21.53 (SD = 11.96), while the financial capital index was the fourth with a mean value of 9.183 (SD = 8.511) (Table 1).
Livelihood capitals and the controlled variables (N = 285)

Thirteen household preparedness activities were developed in this survey according to prior preparedness studies, Reference Eisenman, Adams and Rivard21,43-Reference Tyler and Sadiq47 with the adjustment to local contexts. Four of them were material preparedness activities, while another 9 were related to the respondents’ awareness and participation preparedness activities. The respondents were inquired to answer “Yes” or “No” to a checklist with 13 items. Samples of the items were “Do you have a flashlight or emergency light prepared in your home?”, “Have you ever participated in emergency training or drills?” and a detailed description of the checklist can be found in the online Supplementary Table 2. If a respondent had a positive answer to 1 item, it was marked as 1 while the negative answer was marked as zero. The ranking of the adoption of the preparedness activities from high to low was “having a flashlight” (85.96%), “knowing how to evacuate from buildings in emergencies” (78.95%), “knowing building code” (73.33%), “paying special attention to disaster, emergency information” (69.47%), “willing to buy disaster insurance” (60%), “having food and water prepared” (58.95%), “discussed what to do with friends if an emergency happened” (39.3%), “knowing the nearest shelter” (38.25%), “preparing radios” (23.86%), “having an emergency kit” (12.98%), “participated in drills” (11.93%), “heard about disaster insurance” (9.82%), and “being a volunteer or member of CERT” (4.56%).
The sum of the answers to the 4 material preparedness activities was used as a household material preparedness indicator, and the aggregation of the answers to the 9 awareness preparedness actions was used as the household awareness preparedness indicator. Similarly, the 2 preparedness indicators were transformed as indexes ranged from 1 to 100, as we constructed the livelihood capital indexes. The mean value of the material preparedness index was 45.98, with a standard deviation of 21.91, while the awareness preparedness index had a mean value of 43.42 (SD = 19.29).
Control Variables
The gender, age, marriage status, education attainment, religious beliefs, job status, and the number of Chinese Communist Party (CCP) members within the household were included as control variables. Being male was considered as 1 while being female was coded as zero, and 43% of the respondents were males. On average, the respondents were 57.18 y old, which may because most of the young men in rural China have been migrated to cities for work while the elders and children are the primary residents in villages. A total of 90.2% of the respondents were married, 7.02% of them had religious beliefs, and the primary job of most of the respondents (81.4%) was agricultural-related. On average, each household had approximately 0.211 CCP members. Regarding education attainment, 37.54% were illiterate, 27.37% were primary school educated, 29.47% finished their middle school, while 5.61% had high school or above education level (Table 1).
Data Analysis Strategies
The CART scores were calculated by domains. If more than 1 item was used to construct 1 indicator, the Cronbach’s alpha test was implemented to test the internal consistency of the several variables. Factor analysis method was also used to explore the convergence of variables. The 5 livelihood assets indexes and the 2 preparedness indexes were transformed into continuous variables from 1 to 100 for the final modeling. Ordinary least squares (OLS) regression models were used to estimate the correlations between livelihood assets, household preparedness degrees, and the perceived communication resilience domains, and varied regression diagnostics were conducted. 48 All the data analyses were implemented by the statistical software Stata 13.1 MP version.
Results
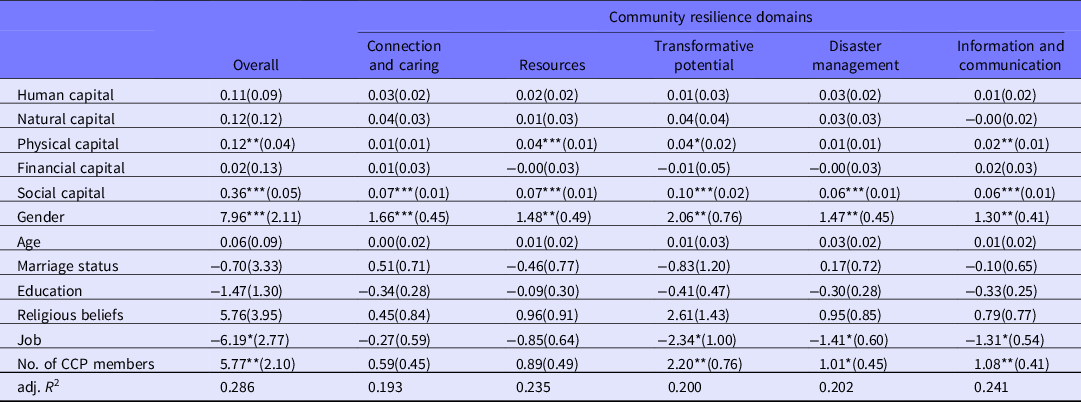
The correlations between livelihood capitals and the individuals’ perception of community resilience domains were analyzed using OLS regressions, and the results are reported in Table 2. Overall, the social capital index was the most consistent and positive predictor of the overall community resilience score. It was positively correlated with all the 5 domains of the community resilience measures, the connection and caring domain, the resource domain, the transformative potential domain, the disaster management domain, and the information and communication domain. Although the physical capital index was also positively associated with the overall community resilience, the associations were only positive for the overall community resilience, the resources domain, the transformative potential domain, and the information and communication domain. The other 3 livelihood capitals, the human capital index, the natural capital index, and the financial capital index, were not significantly correlated with any of the community resilience domains.
Linear regression results for community resilience on livelihood capitals (N = 285) a

a Standard errors in parentheses.
* P < 0.05.
** P < 0.01.
*** P < 0.001.
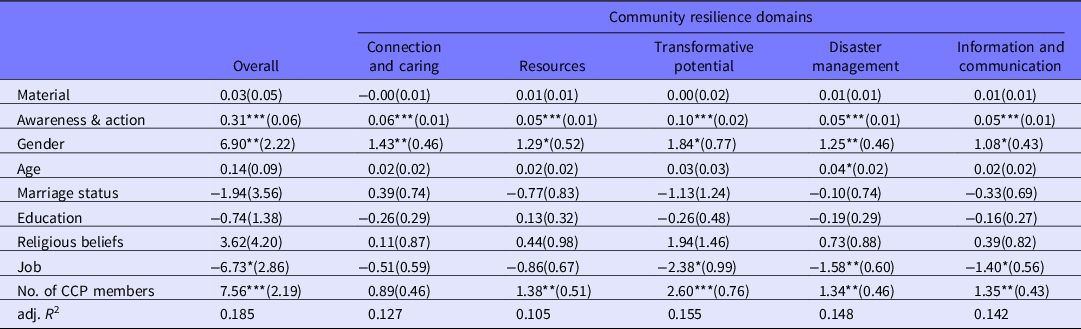
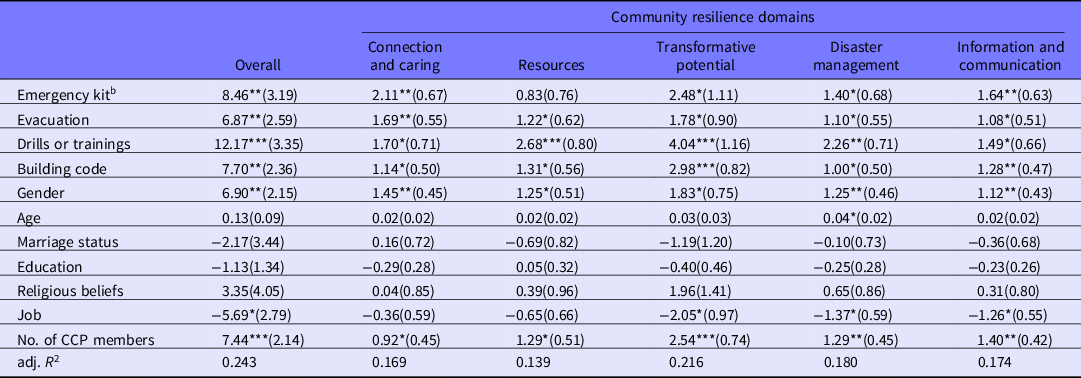
The associations between preparedness and individuals’ perception of community resilience, as well as the different domains of community resilience, were reported in Tables 3 and 4. Overall, the material preparedness was not significantly associated with the community resilience scores and the varied domains. The awareness and participation preparedness index was positively correlated with the overall community resilience score and all the 5 domains of community resilience measures. To know which specific preparedness activities were strongly correlated with the community resilience and its varied domains, the 13 preparedness activities were included in the regression models separately (Table 4). The significant preparedness activities that associated with the community resilience and its domains were “having an emergency kit,” “knowing how to evacuate from apartments or houses in emergencies,” “have participated in drills or training” and “knowing building code (earthquake resistant requirement) in the region.” With these preparedness activities, the respondents would have a higher perceived community resilience, and this conclusion held valid for all the associations of the 4 preparedness activities and the 5 domains of the community resilience, in addition to the correlation between the “having emergency kit” and the resource domain.
Linear regression results for community resilience on preparedness a

a Standard errors in parentheses.
* P < 0.05.
** P < 0.01.
*** P < 0.001.
Correlations between preparedness activities and community resilience a

a Standard errors in parentheses.
b Only the significant preparedness activities are reported in the table.
* P < 0.05.
** P < 0.01.
*** P < 0.001.
For the socioeconomic and demographic variables, males perceived a much higher degree of community resilience, for the overall scores, and all the 5 domains. People working in the agricultural-related areas had much lower perceived community resilience, especially in the transformative potential domain, the disaster management domain, and the information and communication domain. The number of Chinese Communist Party members within a family was also positively correlated with the overall perceived community resilience score, but such correlations with the different domains, in terms of statistically significant, varied. Age, marriage status, education attainment, and religious beliefs had no significant correlations with community resilience overall.
Discussion
Resilience is a vague term with contributions from various disciplines, such as public health and psychology, Reference Norris, Stevens and Pfefferbaum8,Reference Pfefferbaum, Pfefferbaum and Nitiéma16,Reference Eisenman, Chandra and Fogleman20 engineering, Reference Chang and Shinozuka13 sociology, Reference Aldrich and Meyer49 economics Reference Rose and Krausmann50 planning and geography, Reference Berke, Cooper and Aminto51,Reference Cutter, Ash and Emrich52 and ecology and biology. Reference Gunderson53 An interdisciplinary integration and transdisciplinary perspective are needed. Reference Cutter11 In this study, we explored the 2 core contents of community resilience, Reference Cutter11 the assets and preparedness actions’ associations with the people’s perceived community resilience, which is measured by the CART toolkit.
Social capital is a vital source of community resilience, Reference Aldrich and Meyer49 and this statement is proved in this analysis. The 5 types of livelihood assets, human capital, natural capital, physical capital, financial capital, and social capital are not all significantly associated with people’s perceived community resilience, while social capital is the only consistent and positive one correlated with the overall evaluation of community resilience, as well as the 5 separate domains—the connection and caring, resources, transformative potential, disaster management, and information and communication.
Disaster preparedness is an actionable path to promote community resilience. Reference Chandra, Williams and Plough33 The perceived preparedness and actual actions are the 2 common kinds of preparedness measures, Reference Han, Lu and Hörhager54 while the preparedness actions can be further divided into material preparedness, awareness preparedness, and public participation activities. 43,Reference Han, Wang and Du55,Reference Wu, Han and Xu56 In this analysis, we found that the awareness preparedness is more positively correlated with perceived resilience measures overall. In detail, respondents with an emergency kit stored at home, know how to evacuate from shelters in emergencies, know building code in the region, and have participated in disaster-related training and drills would have a much higher degree of perceived resilience.
Resilience indicators alone cannot create resilience, Reference Cutter11 actionable interventions with clear paths that could build the resilience should be investigated to achieve a disaster resilience status. Reference Pfefferbaum, Pfefferbaum and Van Horn17,Reference Eisenman, Chandra and Fogleman20,Reference Chandra, Williams and Plough33 This study explored the associations between assets and preparedness activities and people’s perceived community resilience, which is the first effort of combining preparedness and community resilience based on our knowledge. The results can also provide insights to practitioners; assets achieves, enhanced social capital, and awareness preparedness are more critical for enhancing the resilience of the community.
This analysis does have at least 3 limitations. The first is the sample issue. We only covered a relatively small sample in a limited number of communities; thus, studies with a representative sample are needed in the future. Second, this analysis only investigated the perceived resilience of the general public. Although the public’s perception and opinion are necessary, the neglect of professionals’ perspectives, such as the disaster and emergency management professionals in various government agencies and NGOs, is a significant limitation of this study. Community resilience is a collective issue that involves all stakeholders in the community, 57 thus studies include other stakeholders that are needed in the future. Third, the perceived community resilience measured by CART primarily captures the status of resilience at a time point, which neglected the dynamics and process of the disaster management cycle. It can neither reflect the community resilience-building efforts, such as exercises (eg, simulations, tabletops, or full-scale drills), nor address the needs of the vulnerable groups. Thus, detailed action researches with a focus on describing the processes of resilience-building efforts are essential to encourage knowledge sharing among researchers and practitioners and ultimately contribute to the resilience-building efforts of communities.
Conclusions
In this study, we explored the correlations of livelihood assets, adopted preparedness activities, and perceived community resilience using survey data collected from survivors of the 2008 Wenchuan earthquake. The individuals’ perceived community resilience was measured by the CART (Community Advancing Resilience Toolkit) metrics, while the livelihood assets covered the financial, physical, natural, human, and social capital of households, and the preparedness activities included both material preparedness, awareness, and participation preparedness. The results demonstrated that social capital is consistently and positively associated with the overall community resilience, and each of the 5 domains of the community resilience: connection and caring, resources, transformative potential, disaster management, and information and communication. None of the human capital, natural capital, and financial capital is significantly correlated with any of the domains of community resilience, while the physical capital is only significantly correlated with the resources, transformative potential, and information and communication.
For the correlations between preparedness behaviors and perceived community resilience, the awareness preparedness does increase people’s overall assessment of community resilience, and each domain. In detail, having an emergency kit at home, knowing how to evacuate from apartments or houses, having participated in drills or training, knowing the building code requirement are the preparedness actions positively associated with the overall perceived resilience and each domain. This study highlights the importance of social capital and disaster preparedness activities in building community resilience. It also provides implications for community resilience-building practices: community resilience can be achieved by making the community more connected, and by providing disaster preparedness interventions.
Author Contributions
J.W. oversaw the whole study and was responsible for data collection, data interpretation, and write-up of the manuscript. Z.H. was responsible for literature review, study design, data interpretation, and drafting and write-up of the manuscript. Y.H. was responsible for data analysis and data interpretation. Z.G. was responsible for drafting the manuscript.
Funding Statement
This study was supported by National Social Science Fundation of China (No. 20ZD&160; No. 17ASH007; No. 18BSH068).
Conflict of Interest
The authors have no conflicts of interest to declare.
Supplementary material
To view supplementary material for this article, please visit https://doi.org/10.1017/dmp.2020.466