INTRODUCTION
Various seagrass genera have characteristic underground rhizomes and roots (Kuo & Den Hartog, Reference Kuo, den Hartog, Larkum, Orth and Duarte2006). They may be the small, unbranched, shallow roots of Halophila Thouars, moderately branched roots with a few root hairs in Cymodocea König and the coarse, robust and deep penetrating rhizomes of Enhalus acoroides (L.f.) Royle and Thalassia Banks ex König. A detailed study of root architecture in tropical seagrass species by Kiswara et al. (Reference Kiswara, Behnke, van Avesaath, Huiskes, Erftemeijer and Bouma2009) showed that all seagrass species have relatively simple branching. This structural pattern satisfies the need to minimize the distance that oxygen travels from shoots to roots. However, published reports of studies of the belowground environment of seagrasses are limited. Most such studies of the complex belowground fauna in relationship to root and rhizome architecture have been in temperate habitats and have focused only on monospecific seagrass meadows (Orth et al., Reference Orth, Heck and van Montfrans1984).
Seagrasses act as bioengineering species. Their upright shoots reduce the velocity of the water (Koch et al., Reference Koch, Ackerman, Verduin, van Keulen, Larkum, Orth and Duarte2006) and enhance the deposition of suspended material. The resident decomposing bacteria cause varying degrees of anoxia, as reflected by redox potential values (Marbà et al., Reference Marbà, Holmer, Gacia, Barrón, Larkum, Orth and Duarte2006). Seagrass sediment tends to have a less negative redox potential than bare sediment (Marbà et al., Reference Marbà, Duarte, Terrados, Halun, Gacia and Fortes2010) because the roots release oxygen (Borum et al., Reference Borum, Sand-Jensen, Binzer, Pedersen, Greve, Larkum, Orth and Duarte2006), benefiting the entire seagrass community (Duarte et al., Reference Duarte, Terrados, Agawin and Fortes2000). However, as seagrasses trap fine sediments and organic materials, decomposition is also locally enhanced, leading to anoxia and a more negative redox potential than bare sediments (Marbà et al., Reference Marbà, Holmer, Gacia, Barrón, Larkum, Orth and Duarte2006). Accordingly, the redox potentials fluctuate depending on the local sediment conditions. Redox conditions in seagrass beds are involved with many biogeochemical processes; sulphate reduction is one of the important mineralization processes in marine sediment because of the high sulphate concentration in seawater (Marbà et al., Reference Marbà, Holmer, Gacia, Barrón, Larkum, Orth and Duarte2006). The reactions between sulphate and the organic matter deposited in the seagrass beds result in the production of hydrogen sulphide, which affects anoxic conditions in seagrass sediments.
Pillucina vietnamica Zorina, 1978 (Lucinidae) is a unique bivalve with chemoautotrophic-endosymbiotic bacteria in the gills that oxidize sulphide and produce sugar, a food source for both host and symbiont (Reynolds et al., Reference Reynolds, Berg and Zieman2007). Lucinids have been reported from many seagrass areas around the world, both from tropical and temperate regions (see van der Heide et al., Reference van der Heide, Govers, de Fouw, Olff, van der Geest, van Katwijk, Piersma, van der Koppel, Silliman, Smolders and van Gils2012). The studies of van der Heide et al. (Reference van der Heide, Govers, de Fouw, Olff, van der Geest, van Katwijk, Piersma, van der Koppel, Silliman, Smolders and van Gils2012) have shown that the interactions among the seagrass Zostera noltii Hornemann, lucinids (Loripes lacteus Linnaeus, 1758) and sulphide-oxidizing bacteria reduced sulphide levels and enhanced seagrass biomass. Because sulphide concentrations showed a strong inverse correlation with redox potential in seagrass beds (van der Heide, Reference van der Heide2009), lucinids were expected to occur more frequently in low-redox sediments because the symbiotic bacteria of the lucinids benefit from the increased sulphides.
Our research focuses on the effect that differences in the root morphology of three seagrass species have on the redox potential and abundance of the dominant lucinid, P. vietnamica. Halophila ovalis (R. Brown) Hooker f. has single short roots, Thalassia hemprichii (Ehrenberg) Ascherson has single long roots and Cymodocea rotundata Ehrenberg & Hemprich ex Ascherson has long branched roots. These species occur in both monospecific and multispecific patches. We calculated the Belowground Complexity Index, root biomass, rhizome biomass and belowground biomass (root + rhizome biomass), to indicate the character of each seagrass community in terms of habitat. We hypothesize that greater belowground complexity provides an optimum shelter for lucinids from predation, so that we expect to find a higher abundance of bivalves in the patches whose complexity is greater, and we expect that the abundance of bivalves in vegetated areas is higher than in bare sand; we also hypothesize that the redox potential in seagrass patches would be higher than that in bare sand because oxygen is transported from leaves to the roots and diffuses into the rhizosphere.
MATERIALS AND METHODS
Study site
The experiment was conducted in April 2012 at Laem Yong Lam (7° 23′ N 99° 20′ E) in Haad Chao Mai National Park, Trang Province, south-western Thailand, along the Andaman Sea. The meadows are homogeneous and form large, extensive beds (approximately 18 km2) (Supanwanid & Lewmanomont, Reference Supanwanid, Lewmanomont, Green and Short2003) with a mixture of 10 seagrass species. The common and dominant species were H. ovalis, T. hemprichii and C. rotundata. These species were distributed from the upper intertidal to the subtidal. The study sites are 2 km away from the river mouth, where a mangrove forest is also located. The sites are characterized by substantial inputs of nutrients.
The experiment was conducted in the intertidal zone, 200 m from the upper tide mark, where the meadows are exposed to the air for 1–4.7 h during the spring low tide (Rattanachot & Prathep, Reference Rattanachot and Prathep2011). The bed in which the experiment was conducted was approximately 1000 m2 in area. In this bed, seagrasses occur in dense stands and are homogeneous in term of species diversity, density and coverage. These characteristics could help to minimize the confounding factors that might affect the sampling. Cymodocea rotundata, T. hemprichii and H. ovalis were the most abundant seagrass species; these species commonly grow together. Six communities were investigated. The three monospecific communities investigated were (1) H. ovalis (Ho), (2) C. rotundata (Cr) and (3) T. hemprichii (Th) patches. The two mixed communities investigated were (4) H. ovalis (50%) with C. rotundata (50%) (Ho + Cr), and (5) C. rotundata (50%) with T. hemprichii (50%) (Cr + Th) patches. The other community investigated was (6) the adjacent bare sand.
Core sampling
Sediment cores were collected in patches of healthy seagrasses without epiphytes and with 70–80% cover. Specimens were collected approximately 2–5 m apart to limit the effects of confounding factors produced by vertical environment gradients. As the samples were collected only in Trang province, Southern Thailand facing the Andaman sea, it might only represent a local tropical seagrass bed in the area, not at the regional scale. Animal nests such as those of gobies and snapping shrimps were avoided. Samples were collected when the water cover was at least 30 cm to avoid air intrusion.
Redox potential measurements
Three sediment cores were collected in each community in the bare sand and in vegetated areas using 50 cm long × 7 cm diameter polyvinyl chloride (PVC) corers longitudinally perforated with 1.2 cm diameter holes at 2 cm depth intervals. The holes were covered with duct tape during sampling to avoid leakage of pore water and sediment and oxygen intrusion. Immediately after sampling, sediment redox potential profiles were measured by inserting a Crison Pt electrode (Crison Instrument, S.A., Spain) connected to a portable pH meter horizontally into the sediment. The electrode was regularly calibrated with a redox standard solution (240 mV) and cleaned and polished to prevent accumulation of Pt oxides (Marbà et al., Reference Marbà, Duarte, Terrados, Halun, Gacia and Fortes2010). Redox measurements were corrected to obtain redox potential values relative to the standard hydrogen electrode as described by APHA (Reference Greenberg, Clescert and Eaton1992).
Belowground and bivalve processing
After measuring the redox potentials, slices were made every 2 cm in the 30 cm cores. The resulting slices were sieved through 1 mm mesh to remove small particles. The belowground parts of the seagrasses were sorted and kept cool. The unsieved sediments were preserved in 95% alcohol for the examination of the bivalves.
In the laboratory, seagrass specimens were separated into the belowground parts (roots and rhizomes) and aboveground part (leaves), cleaned and dried at 60 °C until reaching a constant weight. The weights were converted to g DW m−2. Root biomass, rhizome biomass, belowground biomass, aboveground biomass, root/belowground biomass, rhizome/root biomass, aboveground/belowground biomass and leaves/roots biomass were calculated.
Pillucina vietnamica specimens were separated from the sediment under a microscope and counted. Their abundance was calculated as the number of individuals m−2 (ind m−2). The shell lengths (mm) were measured with a vernier caliper.
Belowground complexity index
The Belowground Complexity Index (BCI), modified from the seagrass canopy height index (Hori et al., Reference Hori, Suzuki, Monthum, Srisombat, Tanaka, Nakaoka and Mukai2009), was calculated based on root morphology and root depth as follows:
 $${\rm BCI}\, = \,\displaystyle{{\hbox{root depth rank}} \over \matrix{[\left(\hbox{sum of root depth rank}\right)/ \hfill \cr \quad \left(\hbox{sum of root score}\right)] \hfill}} $$
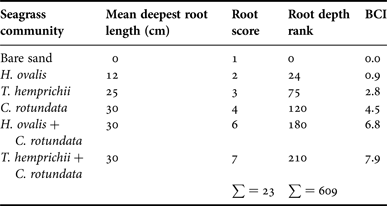
The root depth rank was calculated by multiplying the mean depth of the root (i.e. the deepest sediment layer in which root materials were found) times the root score. The roots of each seagrass community were scored based on their morphology from simple to complex: 1 = bare sand, 2 = single, short root (H. ovalis), 3 = single, long root (T. hemprichii) and 4 = branching, long root (C. rotundata). In the mixed patches, the scores were combined.
Sediment properties
Although only sediment in monospecific stands was collected to study grain size composition and organic matter, this information served to reveal relationships between aboveground properties and sediment properties. The sediment samples for the grain size determinations in this study were collected in March 2011 at the same site. Sediment was collected with a core sampler (7 cm in diameter, 15 cm depth) in monospecific stands of H. ovalis, T. hemprichii and C. rotundata (three replicates each), where the percentage cover was approximately 80%. Plants were carefully removed from bulk sediment, and sediments were kept cool until analysis. In the laboratory, sediments were dried at 60 °C for 3 days and then sieved through a series of sieves with different mesh sizes (2000, 1000, 500, 250, 125, 63 and <63 μm). Each sediment fraction was weighed and calculated as the per cent dry weight of sediment (%). Sediments were classified into four groups: gravel (>2000 μm), medium to very coarse sand (1000–250 μm), fine to very fine sand (125–63 μm) and mud (<63 μm).
In addition, sediments were collected in February 2013 for a study of organic matter. Sediments were collected by using core samples (7 cm in diameter, 15 cm depth) in the monospecific stands of H. ovalis, T. hemprichii, C. rotundata and adjacent bare sand (three replicates each). In the laboratory, the organic matter content (%) was determined by the loss on ignition of dried sediment. To obtain this information, 3 g of dried sediment were combusted at 550 °C for 4 h (Heiri et al., Reference Heiri, Lotter and Lemcke2001).
Statistical analysis
Data were tested for normality prior to analysis to meet the assumptions of analysis of variance (ANOVA). A Kolmogorov-Smirnov test was used for this purpose. A one-way ANOVA was employed to test the effect of seagrass communities on mean seagrass biomass variables (aboveground biomass, root/belowground biomass, rhizome/root biomass, aboveground/belowground biomass, leaves/roots biomass), total bivalve abundance, mean shell length and also sediment properties (grain size composition and organic matter). A two-way ANOVA was employed to test the effect of the seagrass community and depth as fixed factors on root biomass, rhizome biomass, belowground biomass, bivalve abundance and shell length. The significance of differences among seagrass communities and depths were tested using a Tukey's post hoc test. Because the redox potential data did not meet the ANOVA assumptions, a non-parametric Kruskal–Wallis test was employed to analyse the differences between communities. The interaction among communities and depths was tested using a Friedman test. A t-test was then employed to test the differences among seagrass communities in the redox potential.
A simple regression was used to test the relationship between redox potential and root, rhizome and belowground biomass. Likewise, a simple regression was used to test the relationship between the BCI and bivalve variables (abundance and size). A stepwise multiple regression was employed to identify the variables (root, rhizome and belowground, redox potential) that correlated with the abundance and shell length of P. vietnamica. SPSS for Windows 13.0 (SPSS, Chicago, IL, USA) was used for the statistical analysis.
RESULTS
Biomass and the belowground vertical distribution
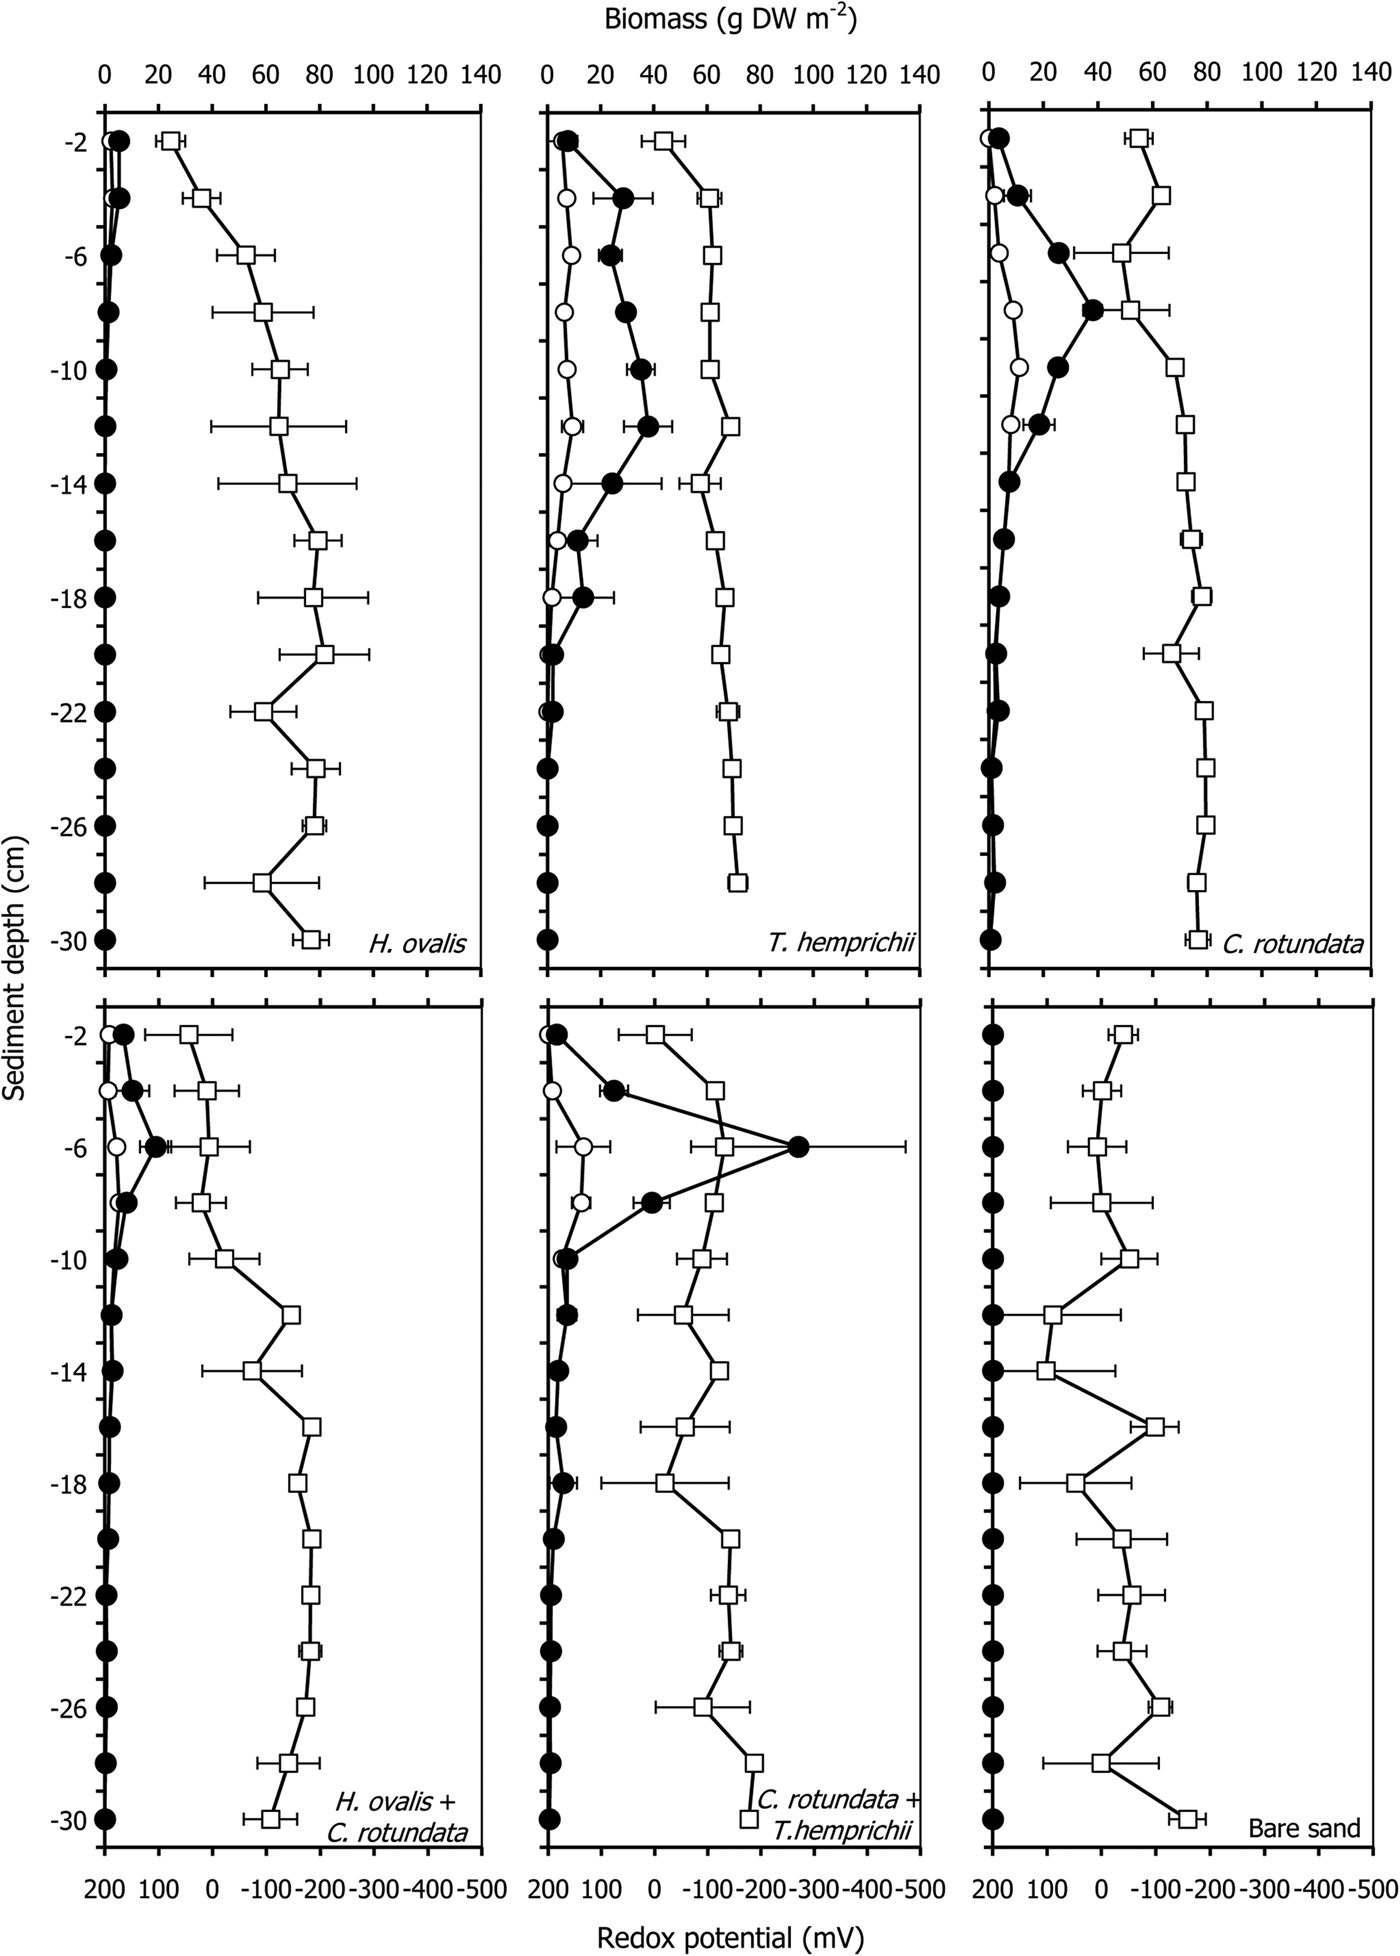
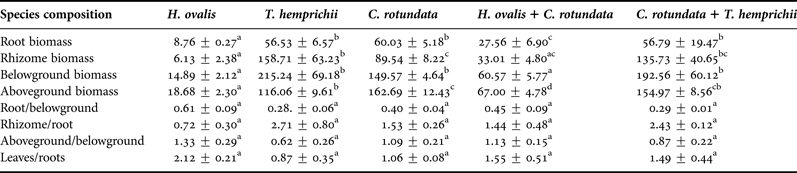
The root and rhizome biomasses varied in each seagrass community. The total belowground biomass ranged from 14.89 ± 2.12 g DW m−2 in the patch of the smallest seagrass species, Halophila ovalis, to 215.24 ± 69.18 g DW m−2 in the patch of Thalassia hemprichii (Table 1). The root, rhizome and belowground biomasses of seagrasses significantly differed among communities and depths (P < 0.001, Table 2, Figure 1). Cymodocea rotundata roots were deepest at more than 30 cm in both the monospecific and mixed patches. Halophila ovalis roots were the shallowest at a depth of 12 cm (Figure 1). The root biomass of most communities was less than half the belowground biomass except in the case of H. ovalis, where it was approximately 60% (Table 1). Only H. ovalis had a higher ratio of root to rhizome biomass. The belowground biomasses of T. hemprichii and the mixed patch of C. rotundata and T. hemprichii were higher than that aboveground, and only the root biomass of T. hemprichii was higher than the corresponding leaf biomass (Table 1).
Root biomass (open circles), rhizome biomass (filled circles) and redox potential (open rectangular) profiles with depth in various seagrass communities. The error bars are standard error (Mean ± SE, N = 3).

Root, rhizome, belowground, aboveground biomass (g DW m−2), root/belowground, rhizome/root, aboveground/belowground and leaves/roots in various seagrass communities (Mean ± SE). Values with the same letter in the same row do not differ significantly.
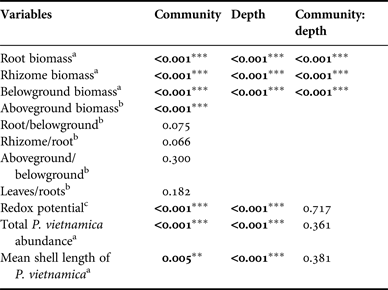
Analysis of variance for parameters in this study in each community and at each depth. Colon (:) indicates interaction. Significant differences are in bold. **indicates significance at P < 0.01, ***indicates significance at P < 0.001.
Note
a Data tested with a two-way analysis of variance (ANOVA).
b Data tested with a one-way analysis of variance (ANOVA).
c Data tested with a Kruskal–Wallis Test and Friedman Test for interaction between factors.
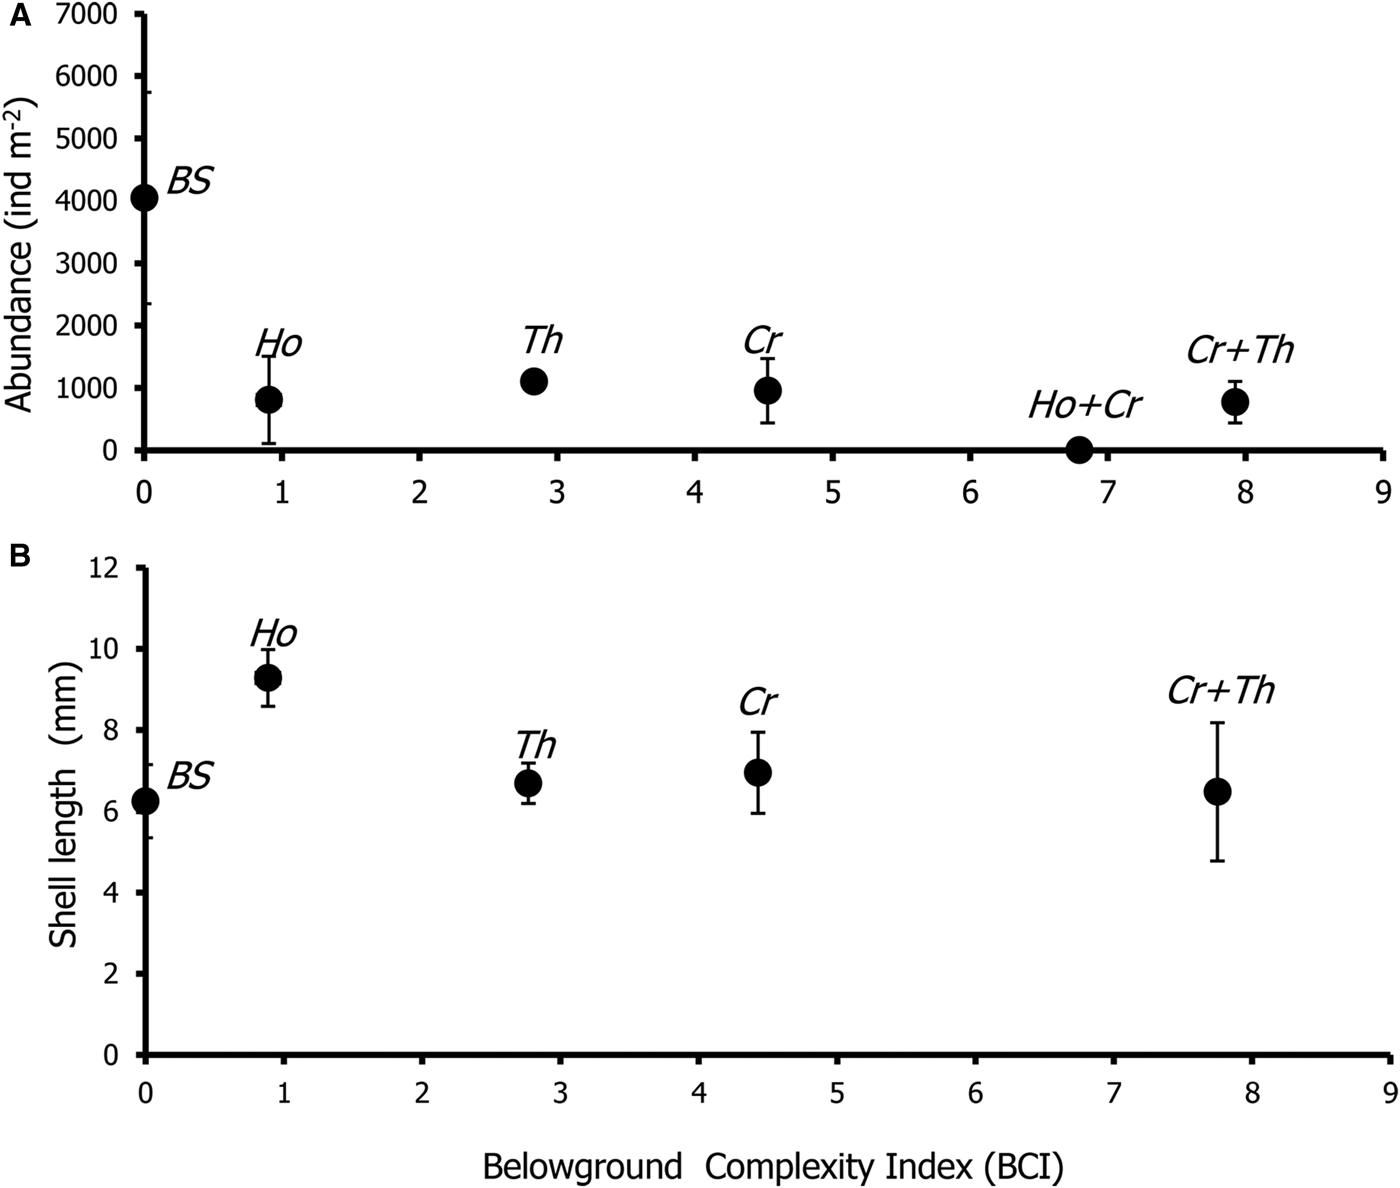
The Belowground Complexity Index (BCI) of bare sand was lowest (BCI = 0), followed by monospecific patches of single-root species (H. ovalis and T. hemprichii; BCI = 0.9 and 2.8, respectively), branching-root species (C. rotundata, BCI = 4.5) and mixed patches (BCI = 6.8–7.9) (Table 3). However, there was no relationship between BCI and the abundance and shell length of Pillucina vietnamica (P > 0.05, Figure 2A, B).
The relationship between the Belowground Complexity Index and (A) Pillucina vietnamica abundance; (B) shell length of Pillucina vietnamica. BS, Bare sand, Ho, Halophila ovalis, Th, Thalassia hemprichii and Cr, Cymodocea rotundata. The error bars are standard error (Mean ± SE, N = 3).
List of seagrass communities studied and the Belowground Complexity Index (BCI).
Redox potential
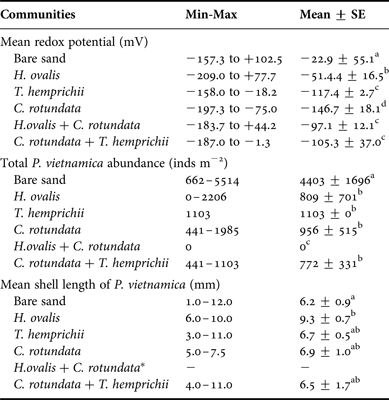
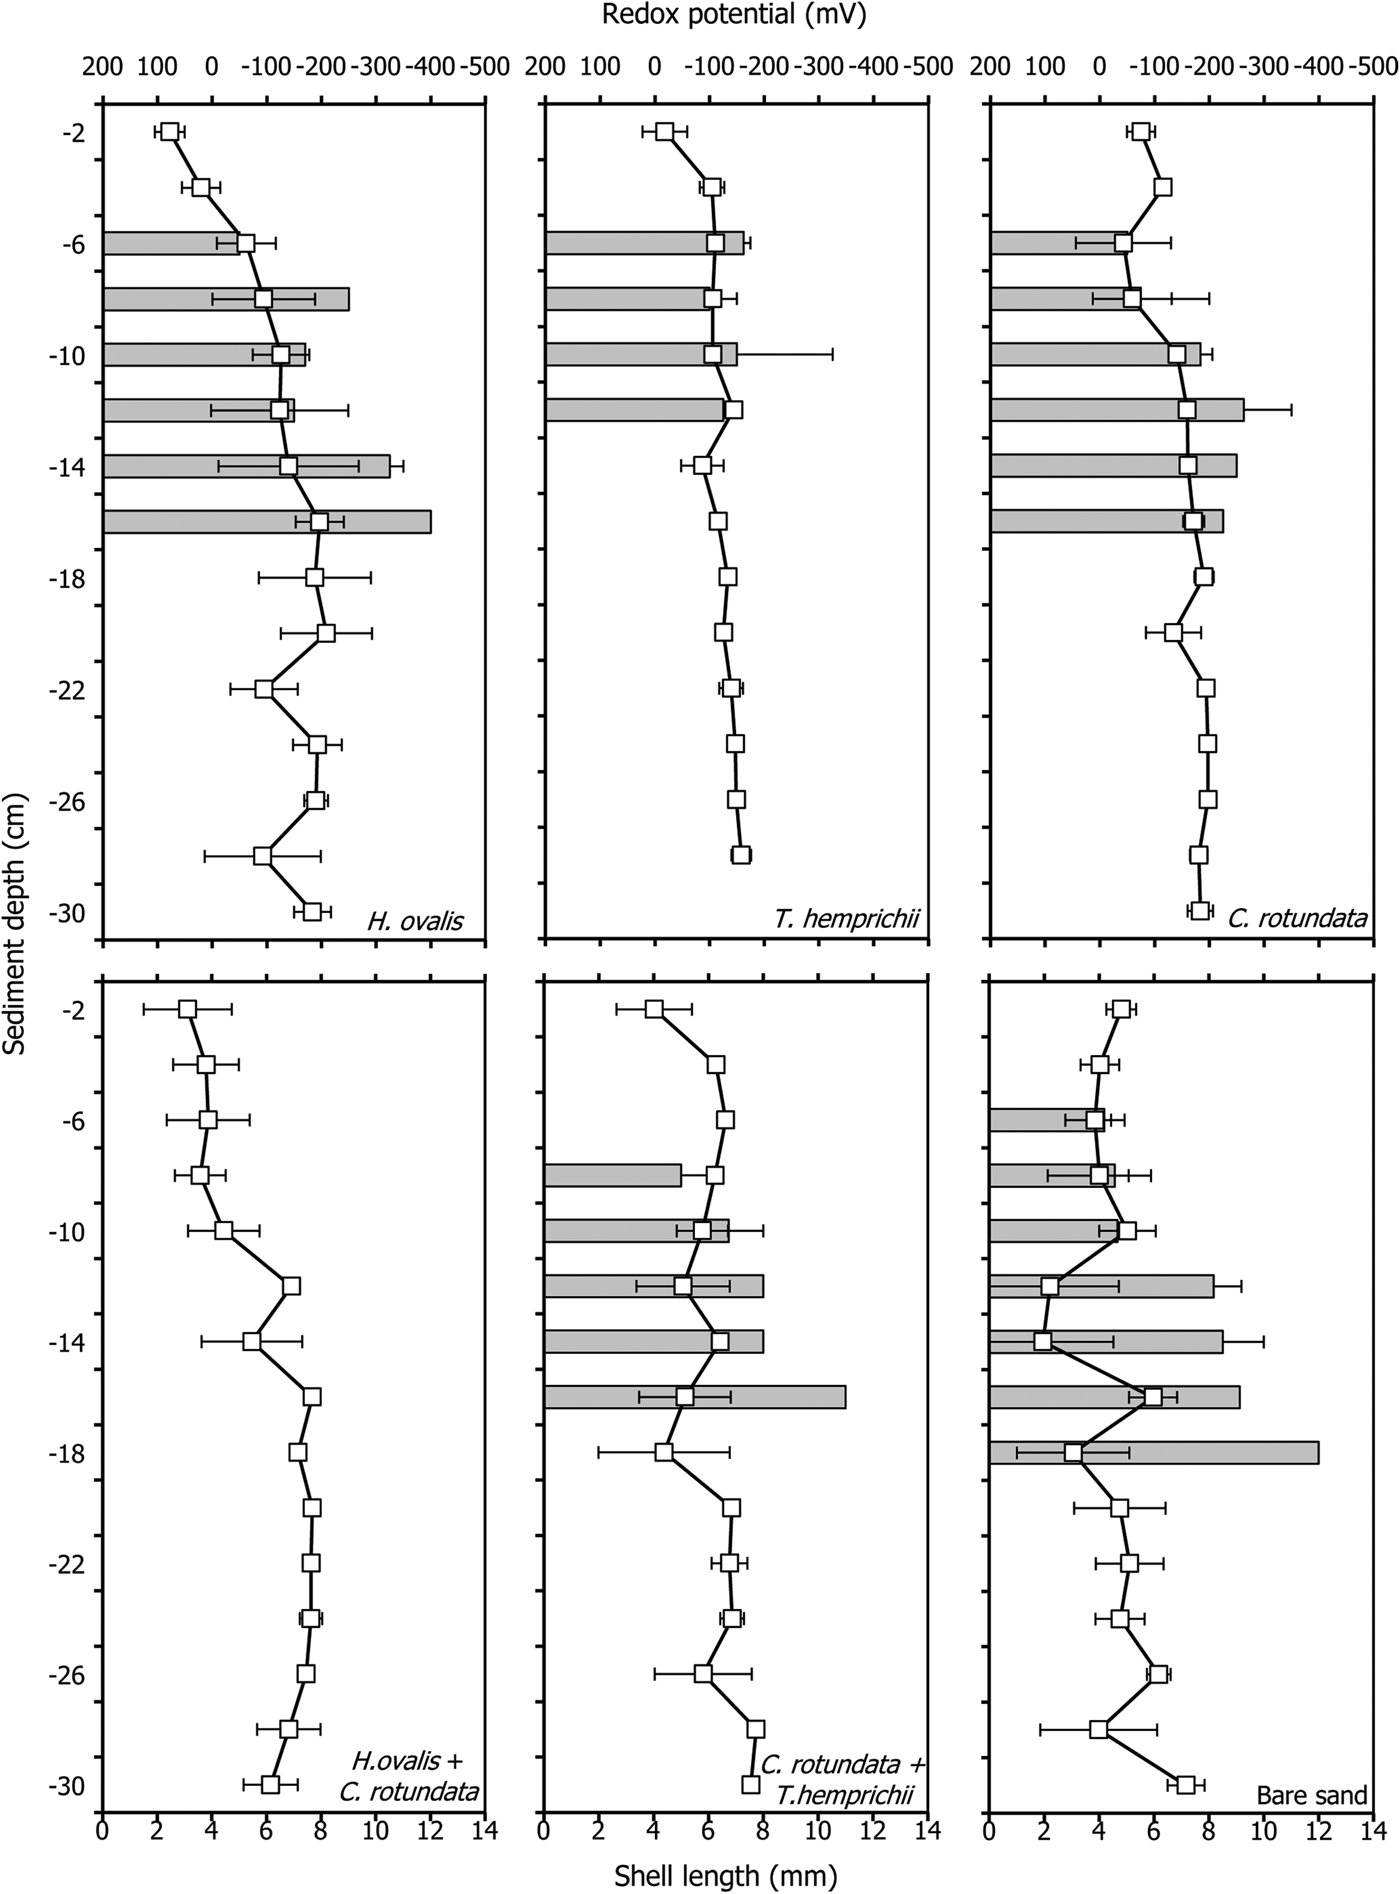
The redox potentials found in this study ranged between −200 to +100 mV and were significantly different among seagrass communities and depths (P < 0.001, Tables 2 and 4, Figure 1). They were higher in the upper layer and became lower at greater depths. Bare sand had the highest mean redox potential, −22.9 ± 55.1 mV. The lowest redox potential, −146.7 ± 18.1 mV, was found in the monospecific patch of C. rotundata. Among seagrass communities, the monospecific patch of H. ovalis had the mean highest redox potential, −51.4 ± 16.5 mV (Table 4). The redox potential in only three seagrass communities (the monospecific patch of H. ovalis, the monospecific patch of C. rotundata and the mixed patch of H. ovalis and C. rotundata) significantly increased as the root, rhizome and belowground biomass increased, respectively (Table 5, Figure 1).
Mean redox potential (mV), total Pillucina vietnamica abundance (ind m−2) and mean shell length of P. vietnamica (mm) in various seagrass communities. Values with the same superscript letter do not differ significantly.
* Data were not analysed because bivalves were not found in this community.
Linear regression analysis of root biomass, rhizome biomass and belowground biomass of each seagrass community in response to redox potential. a 0 is the intercept, a 1 is the slope of the equation, F is the value from F-test, P is the significance value and R2 is the coefficient of determination.

Lucinid abundance
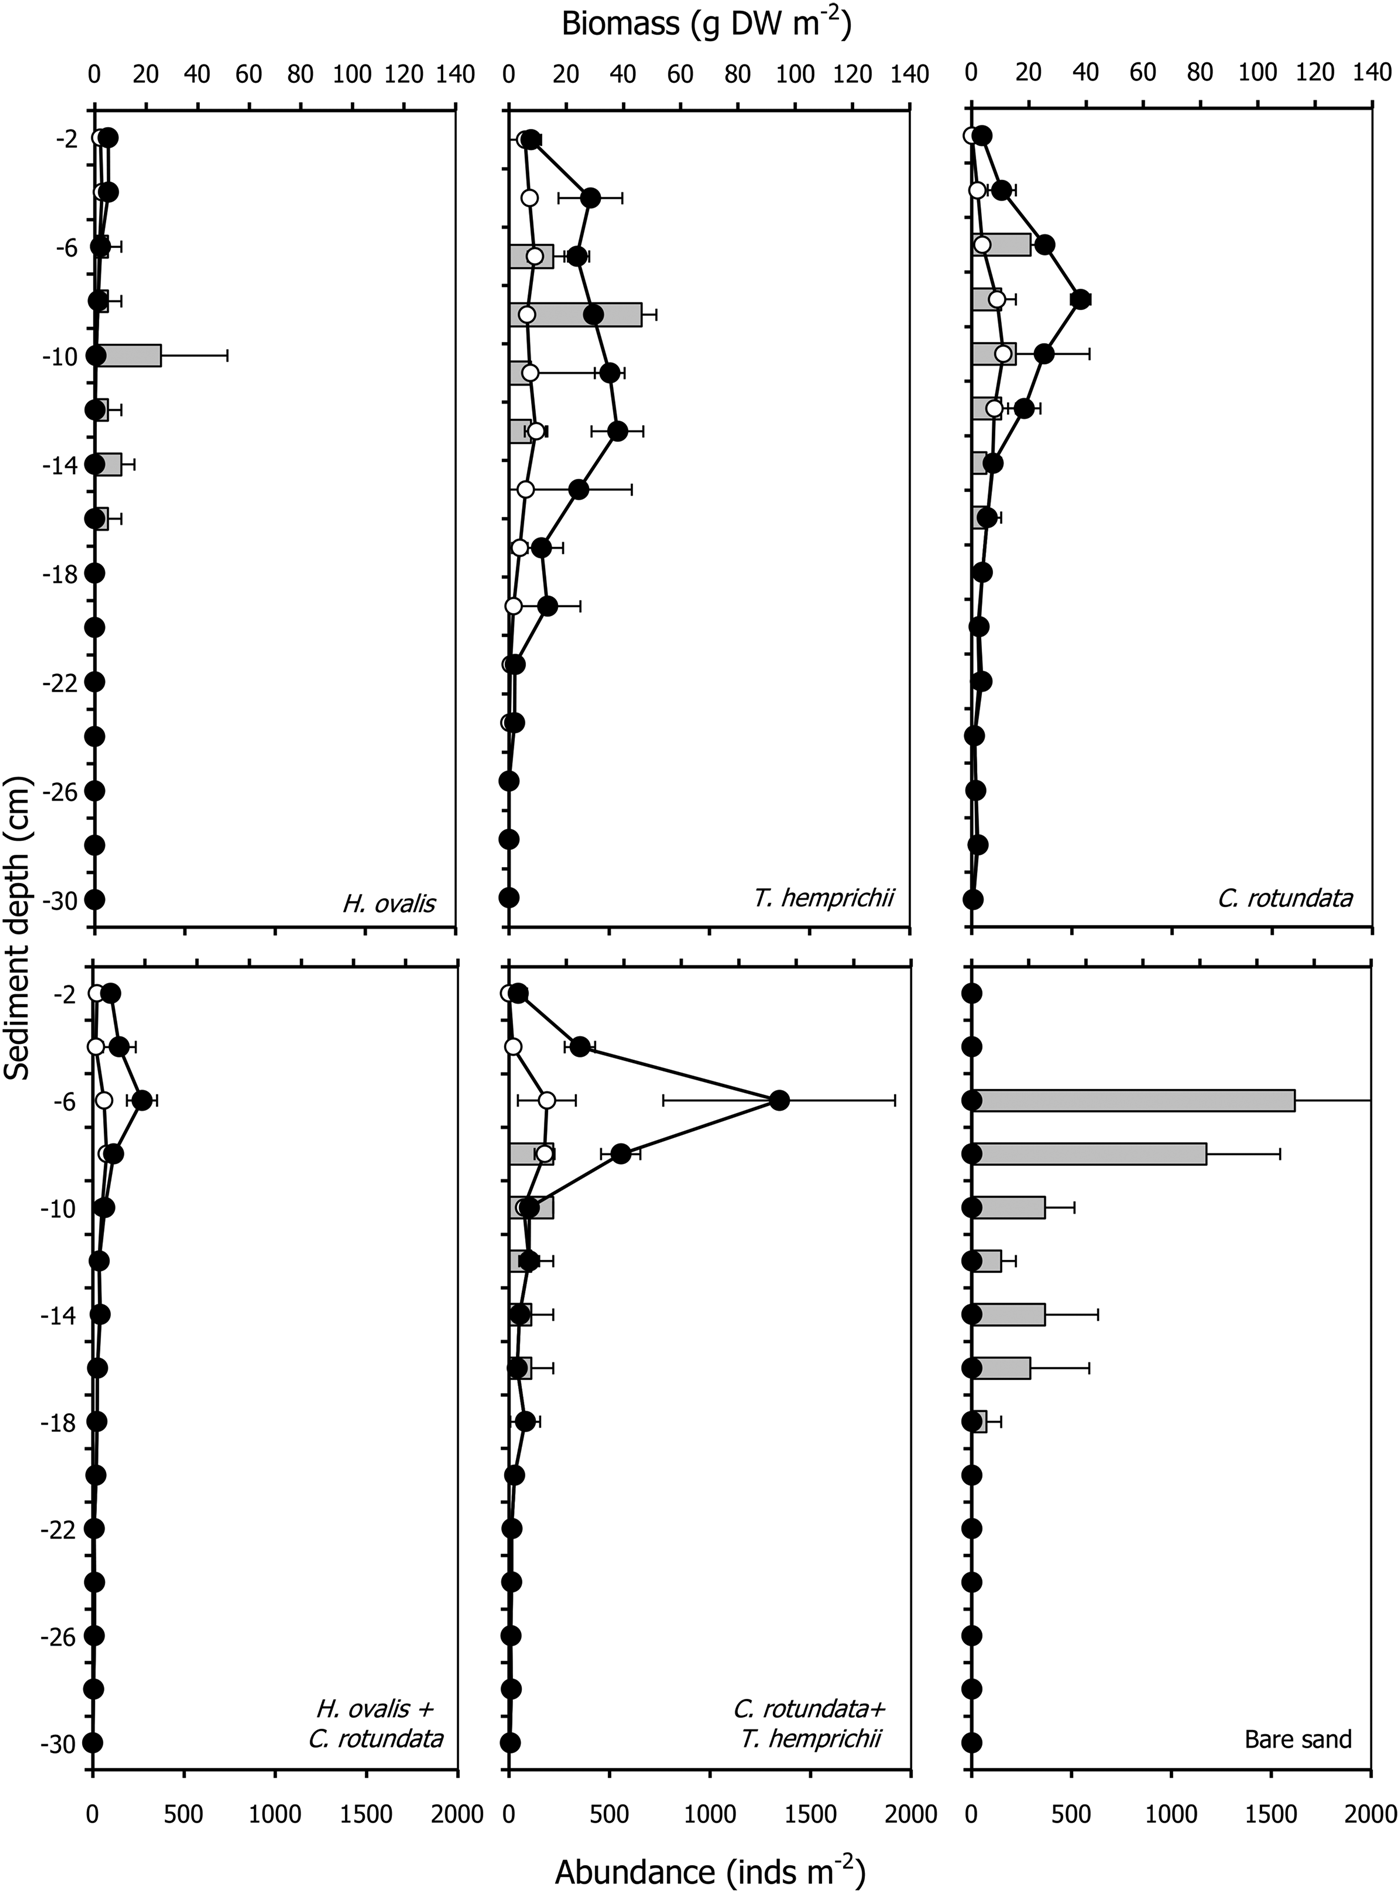
Pillucina vietnamica specimens were found between 6–18 cm depth (Figure 3). The abundance of P. vietnamica differed significantly among communities and depths, decreasing with depth (P < 0.001, Table 2, Figure 3). The abundance in bare sand (4403 ± 1696 ind m−2) was higher than in vegetated areas (772–1103 ind m−2). Pillucina vietnamica abundance values did not vary significantly among monospecific patches. Pillucina vietnamica abundance in the mixed patch of T. hemprichii and C. rotundata was similar to that in the three monospecific patches (Table 4). However, P. vietnamica was absent from the mixed patch of H. ovalis and C. rotundata. Additionally, the abundance of lucinids significantly increased as the belowground biomass of C. rotundata increased (P < 0.05, R 2 = 0.696, Table 6, Figure 3). Lucinids were not found from the surface to a depth of 6 cm in the mixed patch of C. rotundata and T. hemprichii, where belowground seagrass biomass was high. Similarly, in the H. ovalis patch, lucinids were never observed in the dense belowground zone (0–4 cm) (Figure 3). In addition, P. vietnamica shells with small holes bored by moon snails (Polinices sp., Family Naticidae) were commonly found a few centimetres from the surface, suggesting that predation occurred in the area. Dotilla myctiroides (H. Milne-Edwards, 1852), soldier crabs, were incidentally collected only from bare sand.
Root biomass (open circles), rhizome biomass (filled circles) and abundance of Pillucina vietnamica (grey bar) profiles with depth in various seagrass communities. The error bars are standard error (Mean ± SE, N = 3).
Significant correlations (r, partial correlation coefficients, P 0.05) between P. vietnamica abundance, size and seagrass biomass and redox potential demonstrated by multiple regression analysis. R2, coefficient of multiple determination.

Lucinid size
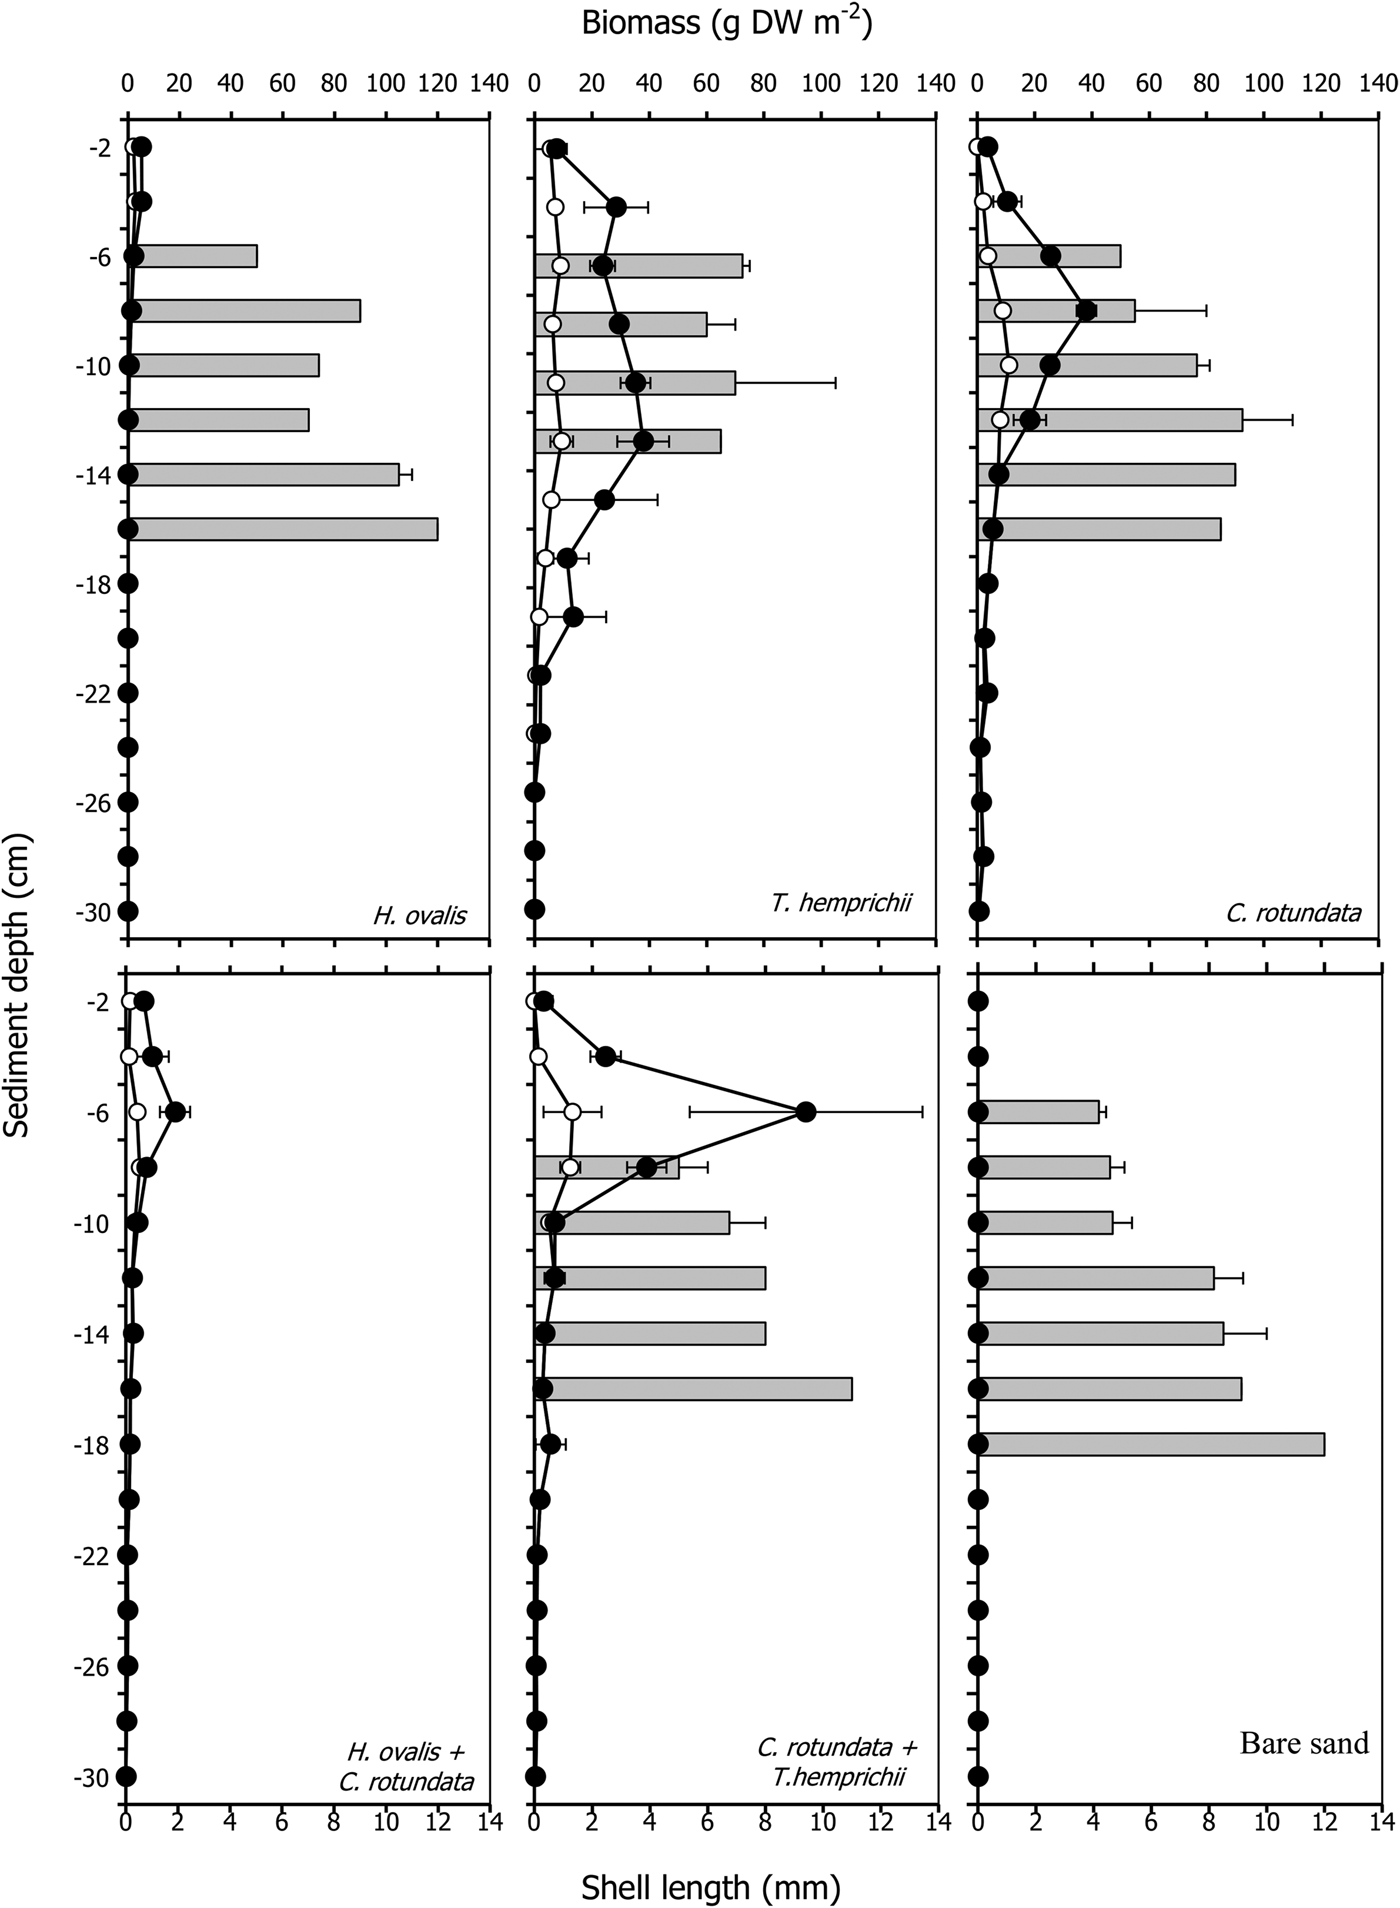
The shell length of P. vietnamica ranged from 1.0–12.0 mm (mean 6.3 ± 0.2 mm). The length of lucinids significantly differed among communities and depths, increasing with depth (P < 0.001, Table 2, Figure 4). The largest mean length, 9.3 ± 0.7 mm, was in the monospecific patch of H. ovalis; the smallest, 6.2 ± 0.9 mm, was in bare sand (Table 4). Most of the small specimens (3–5 mm) were found in the upper layers, at 6–8 cm depth, whereas the large specimens (>8 mm) were found in layers deeper than 10 cm (Figure 4). The lucinids found in bare sand were small, but their abundance was approximately 5.7 times the lowest abundance recorded. In addition, the size of the bivalves significantly increased with increases in the root biomass of C. rotundata (P < 0.05, R 2 = 0.728, Table 6, Figure 4) and in the belowground biomass of T. hemprichii (P < 0.05, R 2 = 0.558, Table 6, Figure 4). In addition, in the H. ovalis patch, the size of the bivalves significantly increased as the redox potential decreased (P < 0.05, R 2 = 0.907, Table 6, Figure 5).
Root biomass (open circles), rhizome biomass (filled circles) and shell length of Pillucina vietnamica (grey bars) profiles with depth in various seagrass communities. The error bars are standard error (Mean ± SE, N = 3).
Redox potentials (open rectangular) and shell length of Pillucina vietnamica (grey bars) profiles with depth in various seagrass communities. The error bars are standard error (Mean ± SE, N = 3).
Sediment properties
The proportion of sand did not vary significantly among the monospecies communities of seagrass, nor did the proportion of mud (P > 0.05, Table 7). More than 70% of the sediment was very fine to fine sand (63–125 μm), and the smallest-grained sediment component, mud (<63 μm), was approximately 0.3–0.8% of the total. Only the proportion of gravel differed significantly among seagrass communities (P < 0.05, Table 7). The C. rotundata community trapped more gravel than did the other communities (2.4 ± 0.4%). In addition, organic matter significantly differed among seagrass communities (P < 0.05, Table 7); the highest proportion of organic matter was found in the monospecific stand of C. rotundata (1.38 ± 0.13%). Although the proportion of organic matter in bare sand was similar to that found in the monospecific patches of unbranched root species (H. ovalis and T. hemprichii), the value in bare sand was lowest (1.14 ± 0.05%). Within the vegetated area, the proportion of organic matter was lowest in the community of the smallest species, H. ovalis (1.16 ± 0.05%).
Grain size composition of sediment and organic matter content in monospecific patches of seagrass and bare sand. DW, dry weight. Values in the same row with the same superscript letter do not differ significantly from each other.
DISCUSSION
The redox potentials found in this study ranged from −200 to +100 mV, reflecting anoxic conditions produced by anaerobic microbes (Kristensen, Reference Kristensen2000; DeLaune & Reddy, Reference DeLaune, Reddy, Hillel, Hatfield, Powlson, Rosenzweig, Scow, Singer and Sparks2005). This range was similar to the previous studies (−200 to +300 mV) in other seagrass areas (Terrados et al., Reference Terrados, Duarte, Kamp-Nielsen, Agawin, Gacia, Lacap, Fortes, Borum, Lubanski and Greve1999; Enríquez et al., Reference Enríquez, Marbà, Duarte, van Tussenbroek and Reyes-Zavala2001; Marbà & Duarte, Reference Marbà and Duarte2001; Vichkovitten & Holmer, Reference Vichkovitten and Holmer2005; Marbà et al., Reference Marbà, Duarte, Terrados, Halun, Gacia and Fortes2010). The redox potential was related to the sulphide content of pore water, as sulphide production was a result of a low redox potential (van der Heide, Reference van der Heide2009). The sulphide concentration at this study site was estimated from the redox potential using the method presented in van der Heide (Reference van der Heide2009) and was found to range from 0.9–891.9 μM, however, mean of the depth-integrated converted values ranged from 23.3 μM (bare sand) to 297.9 μM (pure C. rotundata). Range of converted sulphide was wide which might be because of the differences of root biomass across communities and depths. Sulphide concentration in sediments colonized by seagrass meadows were reported from <100 to 300 μM, however, 59% of observation was less than 100 μM (Terrados et al., Reference Terrados, Duarte, Kamp-Nielsen, Agawin, Gacia, Lacap, Fortes, Borum, Lubanski and Greve1999). As the sulphide values we reported here were converted from research in temperate regions (van der Heide, Reference van der Heide2009), there might be some differences due to the differences in environmental conditions.
The redox potentials in vegetated areas were lower than in the adjacent bare sand, perhaps due to the higher microbial activity in seagrass sediment (Holmer et al., Reference Holmer, Pedersen and Ikejima2006), as the organic matter content in the seagrass patches was higher than that in bare sand. The redox potential of the belowground biomass of three seagrass communities (monospecific patch of Halophila ovalis, monospecific patch of Cymodocea rotundata and mixed patch of H. ovalis and C. rotundata) was consistent with the results of Holmer et al. (Reference Holmer, Pedersen and Ikejima2006), who found that at Libong Island, Thailand, the belowground biomass of seagrasses controlled sulphate reduction rates and stimulated microbial activities in the rhizosphere sediments, whereas the size and morphology of seagrasses (leaf length and width, rhizome and root diameter and lacunae space) were less important. However, the relationship between belowground biomass of seagrass and sulphate reduction rate is controversial; a negative relationship has been reported in the temperate species Posidonia oceanica (L.) Delile (Holmer et al., Reference Holmer, Duarte and Marbà2003). In addition, bioturbation from soldier crabs, Dotilla myctiroides, might be another factor that affects redox potential fluctuation in bare sediment, as their feeding behaviour is associated with the production of pseudofaecal pellets during low tide, increasing the amount of oxygen diffusion in the upper few millimetres of sediment (Kristensen et al., Reference Kristensen, Penha-Lopes, Delefosse, Valdemarsen, Quintana and Banta2012) and increasing the redox potential.
Within the seagrass patches, the lowest redox potential found was in the monospecific patches of C. rotundata. This species has branching roots that trap more organic matter than do the roots of the single-root species Thalassia hemprichii and H. ovalis. The monospecific patch of H. ovalis had the mean highest redox potential. The reason for this high value may be that this species has a highly branched rhizome that loosens the upper layer of sediment, allowing a greater diffusion of oxygen. In addition, H. ovalis has single roots, the shortest roots of the three studied seagrass species, and the smallest leaves. These factors could produce a limited ability to trap organic matter (1.16%) from both the aboveground and belowground parts of the plant, producing the highest redox potential found among seagrass patches in this study.
The aboveground morphology of seagrasses at this site was not clearly related to the differences in the trapping of sediment types. Small grain sizes (sand to mud) were found in all of the monospecific stands. The reason for this finding might be that the samples were collected near each other (2–5 m). Thus, the hydrodynamics within patches were most likely similar and resulted in the occurrence of similar sediment types. The only difference in sediment trapping among the monospecific stands was that gravels were trapped more frequently in the stand of C. rotundata. This result might be due to the branched roots of this species. Organic matter at this site (1.16–1.38%) was relatively low when compared with the mean organic matter in various sites worldwide (5.7 ± 0.3%, range 0.00–100.0%; Fourqurean et al., Reference Fourqurean, Duarte, Kennedy, Marbá, Holmer, Mateo, Apostolaki, Kendrick, Krause-Jensen, McGlathery and Serrano2012). The value of organic matter found at this site is similar to that found in a previous study by Delefosse (Reference Delefosse2007) at a nearby site (1.0 ± 0.2%). The content of organic matter was higher in seagrass patches than in bare sand because of the ability of vegetated patches to trap organic matter. The content of organic matter in bare sand was the lowest found in the current study. In bare sand, there was no seagrass to trap the organic matter, so the material was easily resuspended in the water column.
The abundance of Pillucina vietnamica in this study was highest in bare sand. The reason for this high abundance may be that larvae of lucinids could easily settle in bare sediment, where there were no seagrasses to cover the surface. Seagrass cover could limit larval settlement. Furthermore, bare sand has no rhizomes or complex seagrass root structure that might limit or obstruct the burrowing of lucinids. Pillucina vietnamica were never found in mixed patches of H. ovalis and C. rotundata, where gastropods such as the moon snail, Polinices sp., are dominant predators. The mixed stands of two seagrass species in these patches could provide a habitat with complex physical structure, effectively serving as shelter for Polinices sp. Furthermore, the differences in size and morphology between the two seagrass species in the same mixed-species patch could provide especially complex habitat structure and effective shelter for the moon snail. This factor could facilitate intensive predation, resulting in the observed absence of P. vietnamica.
Pillucina vietnamica was never found in the first 4 cm of sediment. This result could be due to predation by Polinices sp. and by crabs or to the limitation of the sulphide required by the symbiotic bacteria in the lucinids. Polinices were observed in the upper layer of sediment together with portunid crabs. Crabs (Gionopsis pelli and Panopeus africanus) from the Niger Delta, Nigeria, are reported to be dominant predators on lucinids (Keletistes rhizoecus) (Zabbey et al., Reference Zabbey, Hart and Wolff2010). Unfortunately, it is difficult to demonstrate crab predation on lucinids in this study because the crabs always crack the shells of the lucinids and leave no evidence of predation. In contrast, predation by Polinices leaves shells of P. vietnamica that contain holes and that can be observed. Additionally, the sulphide concentration might have been low in the first 4 cm due to the redox potential there, thus producing limiting conditions for the symbiotic bacteria. The low sulphide levels mean that the availability of food is low for both the symbiotic bacteria and the lucinids. This characteristic may also have caused the smaller size of the P. vietnamica in the shallower layers in all communities. In addition, the belowground biomass might obstruct the burrowing activities of lucinids. Lucinids were never found in the highest belowground biomass layer (6 cm depth) in the mixed patch of C. rotundata and T. hemprichii, the largest seagrass species examined in this study, Therefore, the very shallow sediment appears to be an unsuitable habitat for P. vietnamica because of both physical (low sulphide concentration and dense root mat) and biological (predation) factors.
No relationship was found between the Belowground Complexity Index and P. vietnamica abundance and size. The belowground biomass and redox condition influenced lucinid size because the belowground parts sheltered the lucinids from predation and provided organic matter in the sediment that produced an increase in sulphide, as indicated by the redox potential. Sulphide is the known food source of the lucinids, and lucinid density increases with increases in sulphide concentration (148–2333 μM) (Reynolds, Reference Reynolds2004). In our study, the redox potential showed a negative relationship to lucinid size. The largest lucinids found in this study occurred in sediment with a low redox potential because these sediments had a high sulphide concentration, providing more food to lucinids and allowing them to attain larger sizes than those found in in low sulphide sediment (high redox potential), as in the case of bare sand.
Bendell (Reference Bendell1999) has reported that small P. vietnamica were more common in the upper layers of the sediment in both vegetated and bare regions. Smaller bivalves burrow more easily through the dense root mat than do larger bivalves. Younger bivalves first settle in the upper layers, obtaining nutrition by suspension feeding and avoiding predators in the root mats. Larger animals migrate to deeper layers and avoid predators more effectively.
This study is the first to focus on the interaction among seagrass roots, redox potential and lucinids in monospecific and mixed patches of various seagrass species in the Eastern Indian Ocean. However, the results from this study do not support our original hypothesis because the highest abundance of P. vietnamica was in bare sand. Moreover, there were complex relationships between lucinids, predators, belowground parts and the redox potential. Further studies on other biogeochemical parameters such as the sulphide concentration and the amount of oxygen transported to the sediment, as well as studies on the relationships among lucinids, belowground seagrass parts and predators will provide a more complete understanding of the belowground environment of tropical seagrasses.
ACKNOWLEDGEMENTS
Special thanks to The Seaweed and Seagrass Research Unit TEAM, Prince of Songkla University and all the staff at Trang Marine National Park and Protected Areas Innovation Center, who provided considerable assistance, especially in field work. Thanks to Vararin Vongpanich for the confirmation of Pillucina vietnamica. We are grateful for the reviewers' comments, which have greatly improved the manuscript.
FINANCIAL SUPPORT
This research was supported by a grant from the Strategic Scholarships for Frontier Research Network to the Joint PhD Program of the Commission on Higher Education of Thailand and the Graduate School of Prince of Songkla University.