Introduction
As acute care monitoring has evolved to include a larger number of monitoring devices, there has been an increase in the need for software platforms that can centrally aggregate data for easy, customisable visualisation. Some of these platforms also allow for long-term storage of such data for future use in clinical reviews or research. Such platforms are of specific utility in intensive care units and facilitate real-time clinical monitoring review, historic clinical review, and academic efforts. Reference Kamaleswaran and McGregor1–Reference Grogan, Goldsmith, Masino, Nelson, Tsui and Simpao4
Two specific platforms, Sickbay® (Medical Informatics Corp, Houston, TX) and Etiometry (Etiometry, Boston, MA) are now being utilised in paediatric institutions. These platforms allow for data streaming and aggregation. As these platforms have been increasingly used, more data has been accrued and utilised for research. Although beyond the scope of this manuscript, it is worthwhile sharing the characteristics of these platforms. Both platforms allow for aggregation and central viewing of data. Etiometry generally captures data at 5-second intervals, while Sickbay captures data at 1-second intervals. Both platforms allow for capture of haemodynamic data but also clinical data such as medication doses, fluid balance, and laboratory values. Data can be exported from both platforms at an event or patient level. The actual data visualisation styles differ between the two platforms, as do some of the back-end user capabilities.
The primary aim of this study is to characterise the publications utilising high-fidelity physiologic streaming data with Sickbay® or Etiometry in the paediatric setting.
Methods
Study design
A systematic review of the literature was performed and did not utilise previously published protocol. As this was a systematic review, there was no institutional review board approval necessary. This study is in concordance with the Helsinki Declaration.
Manuscript search and identification strategy
A systematic review of the literature was performed to identify manuscripts utilising physiologic data aggregated by Sickbay® or Etiometry. The reporting of this systematic review was guided by the standards of the Preferred Reporting Items for Systematic Review and Meta-Analysis statement.
Manuscripts were identified using electronic databases including PubMed, EMBASE, Ovid, and Cochrane reviews. These databases were queried using the following search terms individually and in various combinations: “sickbay,” “T3,” “Etiometry,” “Medical Informatics Corp.,” “high fidelity data,” “continuous data,” “streaming data,” “physiologic data streaming.” Only studies published in English were eligible for inclusion. No specific restriction on year of publication was used. The final search was conducted on May 10, 2025. Resulting studies were screened by title and abstract. Electronic search was conducted by two authors (RL and SF) independently. Results were discussed and discrepancies identified.
Studies felt to be pertinent to help fulfil the objectives of the pooled analyses and then had their full text retrieved. Full-text manuscripts were obtained by two authors (RL and JF) independently. References of these studies were then hand-searched for additional relevant manuscripts. No direct contact with manuscript authors was made to obtain full-text manuscripts or additional data.
The full-text manuscripts were then reviewed and assessed for quality. Published manuscripts available in full text were included in this review if they presented data that were sourced from either the Sickbay® or Etiometry Platform in a paediatric setting. Review of full-text manuscripts for pertinence to the study question was conducted by two authors (JF and SF) independently. Results were discussed, and discrepancies identified.
Inclusion criteria
The following inclusion criteria must have been met for a study to be included in the study: 1) must have included data from either Sickbay® or Etiometry; 2) data must have been from a paediatric setting; 3) must have been published in full-text and not abstract only; and 4) must have been published in English.
Data extraction
An electronic form was used to collect data about the individual publications. This form was created specifically for these analyses. Study title, study authors, author affiliations, year of publication, the physiologic data streaming platform used, whether the study included cardiac patients, whether the study was multicentre, and whether the study used artificial intelligence or machine learning methods were collected. Data were collected by two authors (RL and SF), independently. Results were discussed and discrepancies were identified.
Citation data for each publication were retrieved from the Scopus database.
Statistical analyses
Study characteristics were compared between Sickbay® and Etiometry publications. Descriptive data were compared using a chi-squared test, while continuous data were compared using an independent t-test. Next, trends in publication number by year were analysed using regression analyses.
All analyses were done utilising Python (Python Software Foundation, Wilmington, DE, USA). A p-value of less than 0.05 was considered statistically significant. Any use of the word “significant” or “significantly” in this manuscript indicates statistical significance unless otherwise explicitly stated.
Results
Study characteristics
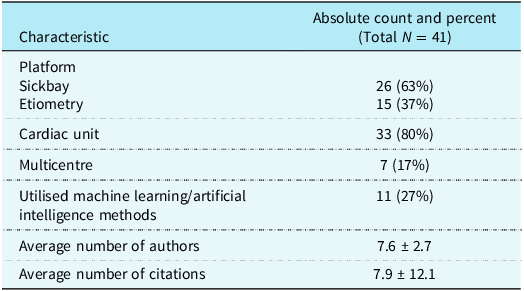
A total of 446 papers were screened by title and abstract. Full text was retrieved for 84 of these manuscripts. Of these 84 papers, 41 were included in the final analyses. Reference Ju, Waugh, Singh, Rusin, Patel and Jain5–Reference Hames, Sleeper and Bullock44 Of these 41 studies, 26 (63%) utilised Sickbay® while 15 (37%) utilised Etiometry. Of these papers, 33 (80%) included patients in a cardiac unit, 7 (17%) were multicentre studies, and 11 (27%) utilised machine learning or artificial intelligence methods. Table 1 outlines study characteristics.
Overall characteristics

Study characteristics by platform
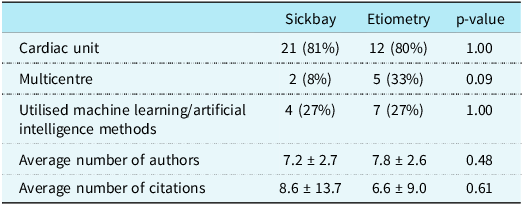
There was no statistically significant difference in the proportion of studies that included cardiac patients, that were multicentre, or that utilised machine learning or artificial intelligence methods. Table 2 outlines characteristics between Sickbay® and Etiometry-based studies.
Comparing Sickbay and Etiometry

Temporal trends
These papers were published between 2016 and 2025. The minimum number of studies published in a year was 1 in 2016 and 2020. The greatest number of studies published in a year was 10 in 2022. Linear regression analysis demonstrated a slope of 0.97, and the trend was statistically significant (p < 0.01, R-squared 0.64). Figure 1 demonstrates the number of studies published every year. Figure 2 demonstrates the number of studies published every year for each specific platform.
Number of publications by year.

When only Sickbay studies were analysed, the slope of the trend was 0.57, which was statistically significant (p = 0.04, R-squared 0.47). When only Etiometry studies were analysed, the slope of the trend was 0.40, which was statistically significant (p < 0.01, R-squared 0.68). Figure 1 demonstrates the trends by platform.
Authorship
A total of 179 authors were credited across the 41 studies. The three authors with the most Sickbay® and Etiometry publications had 18, 14, and 11 publications. The average number of Sickbay and Etiometry publications per author was 1.7. The average number of authors per study was 7.6 ± 2.7.
Only three authors had published with both Sickbay® and Etiometry.
The 179 authors spanned 21 unique institutions. The three institutions with the most publications had 24, 8, and 5 publications.
Citations
Publications with Sickbay® or Etiometry averaged 7.9 ± 12.1 citations (table 1). There was no statistically significant difference in citations for publications by specific platform (table 2). When normalised to how long the publications had been published for, the average number of citations per year was 1.7 ± 1.7. This was not statistically different between Sickbay® and Etiometry publications.
Discussion
This is the bibliometric review of paediatric publications describing data using Sickbay® or Etiometry. Such bibliometric analyses are helpful over time to help identify potential barriers in such efforts, identifying means for improvement, and reassessing trends with time. Over the course of 9 years, 41 papers have been published with a cumulative of 179 authors across 21 institutions. A majority of publications utilised Sickbay® data, included cardiac patients, were single-centre studies, and did not utilise machine learning/artificial intelligence methods. Publications using Sickbay or Etiometry data tended to be cited 1.7 times a year.
High-fidelity physiologic data streaming and aggregation platforms are becoming increasingly utilised, particularly in paediatric intensive care units. Reference Goldsmith, Schwartz and Hehir3,Reference Grogan, Goldsmith, Masino, Nelson, Tsui and Simpao4,Reference Hunt and Chang45 With time, institutions are accruing more data with these platforms and publications, and there has been an increasing number of publications, with the number of publications increasing by roughly 1 publication a year. While it is encouraging to see the increasing trend, the rate of increase does not seem to be in concordance with the concomitant increase in data that is accruing in these platforms.
This perceived lag in publications is very likely multifactorial. While the analyses themselves don’t demonstrate the reasons, all the authors of the current analyses are authors on included studies and have experience in implementation and use of such platforms. Once such platforms are implemented, data must accrue for some time. Once it is deemed that enough data have been accrued to analyse, this data must be retrieved. Both platforms offer means by which data can be exported from the platform. The data are most often exported on a patient basis and include many data points. If data are captured at a resolution of 1 second, that results in 3,600 data points per variable per patient. Thus, if heart rate, pulse oximetry, systolic blood pressure, mean blood pressure, diastolic blood pressure, central venous pressure, cerebral near-infrared spectroscopy, and renal near-infrared spectroscopy values are captured for a single patient for 24 hours, that results in 86,400 data points per variable for a total of 691,200 data points per patient. Reference Goldsmith, Schwartz and Hehir3,Reference Grogan, Goldsmith, Masino, Nelson, Tsui and Simpao4
But additional demographic, clinical, and outcomes data may be required for complete analysis. For instance, vasoactive infusion use and fluid balance may be required. Data sources that are housed external to the database structure of these platforms may need to be acquired by other means and then added to the datasets exported from the platforms. While this may seem like a trivial task, it is data being added to an already large dataset and how the data are populated into the dataset must be handled carefully to ensure that data is collated without error and is done in a standardised, reproducible fashion to help with subsequent tasks in data processing and analysis. Reference Subrahmanya, Shetty and Patil46–Reference Goyal and Malviya49 Once the presence of data and the labels are verified and standardised, patient-level data must be aggregated to form a cohort dataset and verified for integrity. Missing data for each variable must be assessed, and a decision made as to how to address this. There is no clear standard on how to handle such missing data and leaving them blank or imputing a value all seem reasonable as the large number of data can allow for natural regression to the mean until a certain point. Regardless, the approach must be consciously considered and addressed. Next, outliers must be identified and an approach for handling outliers must be assessed. For example, with central venous pressure, there may be great variability that results from patient positioning and/or infusions in the line. A central venous pressure of 9, thus, may increase up to 20 during infusions or positional changes without a change in the underlying central venous pressure. There are several ways to address this, and the large number of overall data does allow for regression to the mean to a certain point. But once again, there must be conscious consideration of how to address this. Reference Subrahmanya, Shetty and Patil46–Reference Kwak and Kim50
Once data are processed, data analysis must be completed. Let us assume that a study uses data from 100 patients for 8 physiologic variables across 24 hours at a 1-second resolution: this results in 8,640,000 data points for each variable across the cohort and a total of 69,120,000 data points. In other words, if this data were displayed in a spreadsheet with each timepoint being a new row, this would be a spreadsheet with 69,120,001 rows, leaving mainstream applications unable to handle such a file size. Excel (Microsoft Corporation, Redmond, WA, USA), for instance, will not be able to handle over 1,048,576 rows and 16,384 columns. Statistical software such as SPSS can handle up to 2 billion cases and 2 billion variables. Thus, these data must be utilised in environments that can handle large files or be separated and then virtually collated during the analyses. A Python dataframe can handle similarly large amounts of data and the practical limit is really based on the available memory of the system. Understanding of these applications is necessary. And furthermore, understanding what subsequent analyses each can do is important as simply loading and displaying data won’t be sufficient. Reference Subrahmanya, Shetty and Patil46–Reference Goyal and Malviya49,Reference Binder and Blettner51,Reference Cox, Kartsonaki and Keogh52
Once an appropriate environment is identified, data must be loaded into the environment. Whenever data is imported or read, there may be data loss or corruption, and thus, the data integrity must be ensured. Once this data integrity is verified then analysis can commence. If a study was evaluating the previously mentioned data after a medication intervention to model how physiologic variables change with time, then appropriate analyses must be used for this. It is impractical to use a paired t-test with 8,640,000 s. Conveying the resulting data and interpreting it would be impractical. Statistical methods such as autoregressive integrated moving average are necessary to evaluate such data. Other machine learning methodologies can also be utilised. Such methodologies are not powered by patient number but by the number of data points. Nonetheless, conventional statistical analyses used in the medical sciences will not be ample for larger datasets. Reference Binder and Blettner51–Reference Anderson53
One potential way to overcome some of these difficulties is through multicentre collaboration. There may be individuals with access to such data, but with lack of access to those who can analyse it and vice versa. By linking multiple centres, the deficiencies in one can be offset by the others. Only 17% of the current studies were multicentre, and more multicentre collaboration could help foster additional work and incorporate other centres that cannot complete an entire effort on their own. At present, only 21 centres were represented across these publications. Collaboration may eventually help individual centres learn and develop their own internal processes and workflow if desired. Currently, there is no true collaboration aimed at leveraging such high-fidelity data. A group focused on compiling, processing, and analysing data from multiple centres could help facilitate multicentre efforts and increase the use of such data. This could be done by creating an entirely new collaborative or by incorporating efforts into existing collaboratives.
Such collaborative efforts, and increasing the academic output, do seem fruitful, as the existing papers are already performing well and being cited. These papers have averaged 1.7 citations per year, highlighting that there is desire for such data in the academic realm. Such data are also anecdotally, clinically helpful. This is particularly true as such data can be used to drive the development of clinical algorithms. The platforms can then help validate and deploy these algorithms by letting them run on the platforms themselves. Machine learning/artificial intelligence methods can help with these efforts. At the moment, 27% of the publications leveraged machine learning/artificial intelligence methods. Increasing this could help augment algorithm development and deployment, which could also bolster collaboration and may also lead to improved clinical outcomes.
The data presented here are novel and represent the first bibliometric review of paediatric publications using physiology data streaming and aggregating platforms, specifically Sickbay® and Etiometry. The number of such publications is increasing, although it seems to be lagging behind clinical adoption of the platforms themselves, despite citation analysis indicating academic interest in the publications. Collaborative efforts can help overcome barriers to using such data and help increase the academic output related to these platforms and help drive subsequent clinical care. While the analyses here are novel, they are not without limitations. Firstly, the data used for analysis are metadata and offer broader perspective on the current state of such publications. More granular data could lend additional insight. Secondly, there could have been publications that were inadvertently not included despite the rigorous search strategies implemented.
Conclusion
A total of 41 papers have been published over 9 years using Sickbay® or Etiometry data in the paediatric setting. A majority of these are single-centre and pertain to cardiac patients. The number of publications is increasing with year, and there is academic interest as witnessed by citation patterns. Multicentre efforts may help increase the number of centres that can do such work and help drive improvements in clinical care.
Line chart of number of publications per year by platform.