


1. Introduction
Terra Nova Bay (TNB) lies along the Antarctic Victoria Land coast (Fig. 1) between Cape Washington (74°35’ S) and the floating Drygalski Ice Tongue (75° 15’ S). It is bounded on the west by the Nansen Ice Shelf, which is fed by Reeves and Priestly Glaciers (164° E), and its offshore extent is normally associated with the seaward tip of the Drygalski Ice Tongue (165°30’ E) (Reference Falcidieno, Pizzi, Sanguineti, Spagnuolo and StocchinoFalcidieno and others, 1998). DespiteTNB’s small size (∼6000 km2), it is an extremely important center of action within the Ross Sea. During March-November, this region is forced almost continually by strong, downslope, katabatic winds (Reference BromwichBromwich, 1989a). The impact of this wind forcing on the surface energy budget of the polynya has been extensively studied both observationally (Reference Kurtz, Bromwich and JacobsKurtz and Bromwich, 1985; Reference VanWoert, Spezie and ManzellaVan Woert, 1998, Reference VanWoert1999) and with model simulations (Reference GalleeGallée, 1997; Reference Goodrick, McNider, Schroeder, Jacobs and WeissGoodrick and others, 1998). On the basis of these studies, it is believed that as much as 10% of the annual sea-ice production in the Ross Sea can occur in this one small area (Reference Kurtz, Bromwich and JacobsKurtz and Bromwich, 1985).
Location map of the Ross Sea and TNB. The location of the Italian AWS 7350 (74.80° S, 164.32° E) and the hydrographic section are indicated. The bold arrow at TNB indicates the long-term median direction that the wind blows toward (after Reference VanWoert, Spezie and ManzellaVan Woert, 1998).

However, relatively little is known about the ocean circulation of TNB. Associated with the wind-forced ice production is a salt flux that has the potential to influence the water-mass characteristics of the entire water column at TNB (Reference Trumbore, Jacobs and SmethieTrumbore and others, 1991). The most profound influence of the wind, however, should be in the upper ocean where the wind can drive the ice and ocean directly. For the weak boundary-layer stratification and steep terrain slopes characteristic of TNB, Reference Davis and McNiderDavis and McNider (1997) and Reference Goodrick, McNider, Schroeder, Jacobs and WeissGoodrick and others (1998) concluded that strong offshore wind conditions should prevail at TNB, consistent with the observed wind conditions in the area (Reference BromwichBromwich, 1989a). Further evidence of the strong offshore nature of the wind forcing at TNB is provided by Reference Kurtz, Bromwich and JacobsKurtz and Bromwich (1985) and Reference Zibordi and Van WoertZibordi and Van Woert (1993), who show dramatic examples of thin sea ice drifting to the northeast away from TNB. Moored current-meter data from 55 m depth in TNB also indicate generally northward flow (or 90° to the left of the wind) in TNB during February-August (Reference Manzella, Meloni, Picco, Spezie and ManzellaManzella and others, 1998).
This drift is in agreement with our basic understanding of Ekman dynamics, which requires that the ocean surface drift ∼45° to the left of the wind in the Southern Hemisphere (thick sea ice drifts −25° to the left of the wind). Although Ekman drift appears to be a common oceanic response to the wind forcing in this region, other factors may at times contribute to secondary circulation patterns in TNB. As an example, here we present satellite observations from April 1998 that portray the development of a cyclonic gyre within TNB. A gyre such as this has not previously been reported on in the literature and hints at the rich spectrum of motions that may exist in this region.
In section 2 the data sources used in this study are defined. Section 3 provides a detailed description of the conditions that prevailed in TNB during April 1998. Section 4 provides an interpretation of these results within the context of existing dynamical studies and compares the results with other historical observations from the region. Section 5 provides a summary and the conclusions of this study.
2. Data
This study is based largely on the interpretation of Defense Meteorological Satellite Program (DMSP) Operational Line-scan System (OLS) and U.S. National Oceanic and Atmospheric Administration (NOAA) Advanced Very High Resolution Radiometer (AVHRR) infrared imagery for the time period 11−22 April 1998. AVHRR and OLS data are routinely recorded at McMurdo station on Ross Island, Antarctica (Fig. 1; 77° S, 167° E) and are periodically shipped to the Arctic and Antarctic Research Center (AARC), San Diego, CA, U.S.A., for archiving (Reference Van Woert, Whritner, Waliser, Bromwich and ComisoVan Woert and others, 1992). The data for the period of interest were requested from the AARC and processed at the U.S. National Ice Center using commercially available satellite image processing software. The OLS data have a nominal spatial resolution of −0.6 km, and the satellite has a nominal revisit time of 2 h. Because DMSP satellites have a rapid revisit cycle and the OLS sensor provides data with a high spatial resolution, these data are used throughout this study to track ice motions within TNB. Unfortunately, due to unforeseen circumstances, OLS data were not recorded at McMurdo station on 16 April 1998; therefore, AVHRR data for this day were processed to provide data continuity across the OLS data gap. AVHRR data have a lower spatial resolution (∼1.1km) than the OLS, and, due to the vagaries of the satellite pointing system, are more difficult to accurately project onto a base map. Therefore the AVHRR data are not used in the motion vector calculations. They are used, however, to provide a qualitative assessment of the ice conditions in TNB on 16 April.
Weather data at TNB are required to interpret the satellite imagery shown in this study. Here we use pressure and wind data from the Italian network of automatic weather stations (AWSs) which operate in the vicinity of TNB (Reference Pellegrini, Delia Vedova, Grigioni, de Silvesteri, Spezie and ManzellaPellegrini and others, 1998). Of particular interest is AWS 7350 (Fig. 1), which is located on the Nansen Ice Sheet at 74.80° S, 163.32° E. This location is known to provide a good representation of the katabatic wind forcing at TNB (Reference Bromwich, Parish, Pellegrini, Stearns, Weidner, Bromwich and StearnsBromwich and others, 1993). The AWS transmits raw telemetry records year-round to the NOAA polar orbiting satellites via the ARGOS system. The raw data used here are converted to physical parameters using pre-deployment calibration information, and then interpolated to the nearest hour to produce regularly spaced wind-speed and pressure records.
3. Results
3.1. Weather conditions during April 1998
The April 1998 monthly mean wind speed (£) at TNB, based on data from AWS 7350, was 14.8 ms−1. This is intermediate to the 11.6−18.7 ms−1 range of monthly mean April values for 1988−90 (Reference VanWoert, Spezie and ManzellaVan Woert, 1998, Reference VanWoert1999), but is approximately equal to the long-term wintertime average wind speed observed at TNB (Reference BromwichBromwich, 1989a). In this regard the wind speeds during April 1998 appear typical of many wintertime months at TNB. However, with the exception of a few strong but short-lived wind events, wind speeds were particularly light (∑ ≈ 6 m s-1) during the first 19 days of April (Fig. 2a). They increased over the 30 h period between 9 April, 0600 UTC and 10 April, 1200 UTC to a peak of ∼ 30 m s −1 and then abruptly slowed on 10 April, 1900 UTC. They remained light until 14 April, when another brief wind event occurred. The lowest wind speeds of the month occurred over the 98 h period between 15 April, 0000 UTC and 19 April, 0200 UTC. These lulls in wind speed during early April 1998 appear to be associated with the passage of a series of high-pressure systems over the Ross Sea (Fig. 2b). By 19 April, the pressure again dropped and the wind speeds increased. The winds remained generally strong throughout the rest of the month. This general picture of the evolving weather pattern at TNB is supported by data from the Italian AWSs 7353 and 7354, which are located on nearby Inexpressible Island (74.70° S, 164.10° E and 74.72° S, 164.03° E, respectively).
Low-pass filtered (6h moving average) wind speeds (a) and surface pressures (b) at tnb from aws 7350, april 1998. the times associated with figures 3 and 4 are also noted.

3.2. Satellite data interpretation
Satellite data from the first day of data coverage (11 April, 1638 UTC) reveal generally cloud-free conditions over TNB (Fig. 3a), thus allowing an initial assessment of the ice and weather conditions at TNB. Clearly visible in the image is a warm katabatic plume blowing down Reeves Glacier and across the Nansen Ice Sheet (Fig. 1). These warm katabatic signatures are well documented in the literature (Reference BromwichBromwich, 1989b) and appear to be associated with the differential heating of the katabatic boundary layer by turbulent mixing. It is important to note that the northeast/southwest-trending dark patch offshore from the Nansen Ice Sheet is warm, moisture-laden air resulting from the interaction of the katabatic outflow with the ocean below; the ocean surface itself is not directly observable. However, senior analysts at the U. S. National Ice Center indicate that this situation is typically associated with 3/10 to 5/10 ice cover. Thus, a substantial amount of open water is present along the Nansen Ice Sheet to feed this moisture plume. Roll vortices over the ocean often develop when heating from the warm, moist, ocean surface destabilizes cold dry continental air (Reference Hein and BrownHein and Brown, 1988). The observed strong north/south gradient in the strength of the roll vortices is a further indication of a strong north/south gradient in the intensity of the air/sea interaction and hence open-water fraction along the Nansen Ice Sheet. This open water is presumably forced by katabatic winds; therefore, by inference, there should have been a strong north/south gradient in the surface wind forcing at some time prior to the collection of this image.
(a) Ols satellite image, 11 april 1998,1638 utc. northern (a) and southern (B) roll vortices are noted. the northeast/southwest-trending moisture plume is discussed in the text, (b) avhrr image, 16 april 1998,1155 UTC. the dislodged piece of fast ice is denoted by F. A spiral-shaped series of leads is also evident.

From 12 April through 15 April(images not shown) TNB was totally obscured by 10/10 cloud cover and heavily moisture-laden air. During this 3 day period the wind speed was 1−30 m ^ (Fig. 2a). On 15 April, wind speeds decreased and the cloud cover began to dissipate. An AVHRR image from 16 April (Fig. 3b) reveals a spiral-shaped lead pattern within TNB and compact (9/10 to 10/10) ice cover everywhere offshore. Fast ice located offshore of Cape Washington has also broken free during this period, further suggesting that the region was strongly wind-forced at some time prior to the clearing on 16 April (probably 14 April).
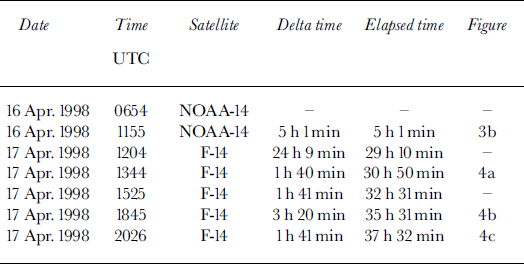
Clear skies persisted over TNB from 16 April, 0513 UTC through 19 April, 1640 UTC allowing an unprecedented opportunity to characterize the temporal evolution of sea-ice conditions within TNB. Of particular interest in this study is the temporal evolution of the gyre first observed on 16 April (Fig. 3b). Over the 24 h period that elapsed between the acquisition of the image shown in Figure 3b and the image shown in Figure 4a, the ice reoriented itself into a circular pattern with a well-defined series of leads that radiate away from the center of the bay. When the images shown in Figure 4a-c (along with intermediate images listed in Table 1) were animated, a well-defined cyclonic circulation pattern emerged in TNB. This basic pattern of ice persisted at least until 19 April, 1640 UTC when clouds again obscured TNB. Unfortunately, by 18 April the thermal contrast in the imagery had degraded to the point that it was difficult in places to unambiguously distinguish between the sea ice and open water, presumably because the newly formed ice in the leads was thickening and cooling in response to the cold air temperatures. An animated sequence of images collected on this date also did not reveal significant ice motion. Careful scrutiny of the images suggested that this is most likely because new ice formation consolidated the pack and arrested sea-ice motions.
Ols time sequence of images from 17 april 1998,1344 utc (a), 1845 utc (b) and 2026 utc (c). the drift vectors based on the 1845 and 2026 UTC images are overlaid on the image from 2026 UTC (d).

Clear images used in this study, the elapsed time between images, and the corresponding figure number
3.3. Satellite-derived upper-ocean currents
During cloud-free periods, the tracking of sea ice with visible/ infrared satellite imagery can provide a synoptic view of the upper-ocean sea-ice drift (Reference FeldmanFeldman, 1986). It is well known that sea-ice drift responds predominantly to the wind and can equilibrate to changes in wind speed and direction within a few hours (Reference McPheeMcPhee, 1980). However, drag from the ocean also strongly affects sea-ice drift and during periods of weak wind forcing is most likely the dominant force.
An estimate of the sea-ice drift on 17 April was obtained by applying a maximum cross-correlation (MCC) sea-ice tracking algorithm (Reference Ninnis, Emery and CollinsNinnis and others, 1986; Reference Emery, Fowler, Hawkins and PrellerEmery and others, 1991) to the OLS images shown in Figure 4b and c. The drift vectors (Fig. 4d) clearly indicate strong (>30 cm s−1) currents toward the west along the Drygalski Ice Tongue. This is comparable to upper-ocean current speeds in TNB during April 1995 (Reference Manzella, Meloni, Picco, Spezie and ManzellaManzella and others, 1998). Comparable flow also occurs along the front of the Nansen Ice Sheet, but the eastward drift near Cape Washington is stalled. Animation of the imagery shows that sea-ice drift is blocked at this point by the fast ice that was dislodged (Fig. 3b) during the passage of the low-pressure system. Thus, there is no a priori reason to believe that the ocean currents are necessarily weaker in this region, just that they were not observable. Assuming that the ice is drifting with the ocean currents at a speed of ∼ 3 0 cm s−1, and assuming that the gyre has a diameter of ∼60 km (Fig. 4), it would take an ice flow ∼ 7 days to make one complete transit around the gyre.
4. Discussion
This study documents the existence of a cyclonic gyre in TNB during mid-April 1998. Other eddy-like motions have been noted in TNB. In particular, Reference Ahlnas and JayaweeraAhlnas and Jayaweera (1983) examined the near-surface circulation of the Ross Sea during December 1982 by tracking sea-ice drift. They found a more slowly rotating (−2 cm s−1) cyclonic eddy near the Drygalski IceTongue, which circulated for 53 days. They attributed the behavior of this ice drift to the existence of a temporary or quasi-permanent eddy that formed either through interaction with the Drygalski IceTongue or as a result of the TNB polynya slightly to the north. A year-long salinity record from 140 m depth collected during 1995 also revealed energetic motions with a period of − 3 to 7 days but, paradoxically rotated in an anticyclomic direction (Reference Manzella, Meloni, Picco, Spezie and ManzellaManzella and others, 1998).
Collectively, these observations hint at the existence of a rich spectrum of sub-inertial motions in TNB. However, the mechanisms responsible for the development and maintenance of these motions are poorly understood. Buoyancy-forced, deep-ocean convection and wind forcing are two potential mechanisms for producing the cyclonic circulation observed in this study. A hydrographic section, collected in TNB (Fig. 1) during December 1997−January 1998 as part of the "Research on Ocean Atmospheric Variability and Ecosystem Response in the Ross Sea" (ROAVERRS) program (Reference VanWoertVan Woert and others, 2000), reveals a ∼ 5 0 m thick warm, fresh surface layer (Fig. 5) resting on top of a thick layer of high-salinity shelf water (HSSW; Reference Jacobs, Fairbanks, Horibe and JacobsJacobs and others, 1985). Significant doming of the 34.75 and 34.80 psu (practical salinity units) isohalines with a horizontal scale of ∼ 5 0 km is observed in the salinity section across TNB. In these cold waters, the shape of isopycnals closely corresponds to the shape of the isohalines, so the doming of the isohalines is strongly suggestive of cyclonic flow in TNB.
Temperature (a) and satinity (b) sections along 75° s (fig. 1) from december 1997/January 1998. a small region of ice-shelf water, first noted in TNB by Reference Jacobs and Comisojacobs and comiso (1989), is delineated by the isolated −1.95˚C (dashed) and enclosed-2.00°C (solid) contours at station 32.

This isopycnal doming is characteristic of regions preconditioned for deep convection (Reference MarshallMarshall, 1999). As the strong, cold katabatic winds extract heat from the ocean, the stratified surface layer is rapidly eroded, exposing the weakly stratified HSSW directly to the surface forcing. Convective plumes develop within this unstable patch, which entrain dense water from below and homogenize the patch. As the buoyancy forcing subsides, this patch, which is denser than ambient surface water, begins to geostrophically adjust, creating a strong rim current (as well as radiating eddies as a result of baroclinic instability). We can estimate the strength of this rim current using the thermal wind equations, which are given by:


where f is the Coriolis parameter, ρ0 is a reference density, g is the acceleration due to gravity, uz and vz are the vertical velocity shear of the zonal and meridional currents, and ∂p/∂x and ∂p/∂y are the zonal and meridional density gradients. Following Reference Gawarkiewicz and ChapmanGawarkiewicz and Chapman (1995), we take, for short times, ρy = ρx = QΔt/HLw, where q is the buoyancy forcing, h is the depth of the corrective layer, Lw is a characteristic horizontal length scale and At is the elapsed time since the beginning of the event. Given the intense wind forcing at TNB, it is potentially possible for convection to reach the bottom (-1200 m), but this seems unlikely to have occurred by mid-April given the strongly stratified summer mixed layer (Fig. 5). Here we take h = 400 m based on historical current-meter records from TNB (Reference Manzella, Meloni, Picco, Spezie and ManzellaManzella and others, 1998). We also take Q = αG/cw = 6.5 × 10⁻⁶, where g is the net heat flux (1000 W m−2: Reference Kurtz, Bromwich and JacobsKurtz and Bromwich, 1985; Reference VanWoertVan Woert, 1999), a is the thermal expansion coefficient (0.25 × 10" 4 K-1 at −2°C) and cw is the heat capacity of water (3900 J kg"1 K-1). Reference Gawarkiewicz and ChapmanGawarkiewicz and Chapman (1995) took Lw = 5 km, corresponding to the offshore scale of their buoyancy forcing. The offshore scale for the buoyancy forcing at TNB is unknown; however, an analysis of a coupled atmosphere/ice/ ocean model (Reference GalleeGallée, 1997) shows a katabatic plume that extends 20−50 km offshore depending on the size of the polynya (their fig. 3). Assuming that the current speed decays by ∼ 5 0% in the upper 400 m (Reference Manzella, Meloni, Picco, Spezie and ManzellaManzella and others, 1998), Equations (1) scale as |U0| ≈2(gQΔt/fρ0Lw) ≈ 13−3 cm s−1, corresponding to scales lengths of Lw = 20 and 50 km, respectively. This is considerably smaller than the satellite-observed ice-drift speeds (Fig. 4d). However, it should be noted that the result is based on an assumed time-scale of At =15 days, which although consistent with the time-scale of the wind forcing at TNB (Reference VanWoert, Spezie and ManzellaVan Woert, 1998), could be in error. A longer buoyancy-forcing time-scale would produce proportionately larger current speeds.
Given the predominantly strong, offshore, wind forcing at TNB, it is not intuitively apparent that the strong onshore currents observed along the Drygalski Ice Tongue (Fig. 4) could be wind-forced. However, as noted by Reference McCreary, Lee and EnfieldMcCreary and others (1989) for the cases of strong offshore wind forcing at the Gulf of Tehuantepec and the Gulf of Papagayo, strong offshore winds can produce cyclonic and anticyclonically rotating eddies. When this model is reoriented to match the geometry of TNB, the offshore wind forcing will produce an anticyclonic gyre north and a cyclonic gyre south of the axis of the windjet. The solution of Reference McCreary, Lee and EnfieldMcCreary and others (1989) was not developed for ice-covered oceans, but under the assumption that the ice is thin and for long time-scales compared with the inertial frequency the offshore current speed is given by u = τt/(f 2 * H), where τt is the time derivative of the offshore wind stress and / and h are defined as before. It is important to note that the offshore current speed depends on the time derivative of the wind stress, not the wind stress itself. Thus, it is the rapid change in the wind stress that initially sets up the offshore current.
Rapidly increasing winds were observed at the AWS on 9 April (Fig. 2a). This wind forcing appears to extend offshore to the tip of the Drygalski Ice Tongue and beyond (Reference GalleeGallée, 1997; Reference BromwichBromwich, 1989b); thus, the AWS data provide a crude estimate of the wind forcing over the whole polynya. Assuming a water depth of 1200 m, an increase in wind speed of 30 m s"1 over a 24 h period produces an offshore current of ∼ 7 0 cm s −1 . This is well in excess of the observed 30 cm s−1 ice-drift speeds, suggesting that it is likely the dominant mechanism for the observed offshore ice drift. Coupled with the strong northeast/southwest gradient in wind forcing (Fig. 3a), it is anticipated that a cyclonic gyre could quickly develop in TNB.
5. Summary and Conclusions
This study has examined a time series of OLS satellite imagery of TNB. These images reveal a rapidly rotating (∼30 cm s−1) cyclonic gyre with a diameter of ∼ 6 0 km located within the boundaries of TNB. At these speeds an ice floe can make one complete revolution around the gyre in ∼ 7 days. Free convection and wind forcing are both hypothesized as mechanisms for generating the observed cyclonic gyre. Simple scaling arguments favor the development of this gyre through a rapid acceleration of the katabatic wind forcing. However, to unambiguously determine the dynamics of this gyre, more complete space/time sampling of the regional meteorological parameters is required, in addition to year-round sampling of the ocean currents, temperature and salinity within TNB.
Acknowledgements
The AVHRR data used in this study were provided by R. Whritner and D. Lubin of the AARC. We thank Captain J. Borkowski and R. Kluckhohn for their part in making the ROAVERRS field program a success. We also thank J. Andrews and C. O’Connors of the U.S. National Ice Center for their assistance in interpreting Figure 3a. Finally, we thank two anonymous reviewers for their thoughtful comments. The Italian National Antarctic Research Program funded the AWS data collection at TNB. This work was supported in part by the U.S. National Science Foundation (OPP-9732464).



