I. INTRODUCTION
β-Ti alloys have been extensively investigated as structural and/or functional applications, due to their attractive properties such as high strength-to-density, good formability, and excellent corrosion resistance. Reference Saito, Furuta, Hwang, Kuramoto, Nishino, Suzuki, Chen, Yamada, Ito, Seno, Nonaka, Ikehata, Nagasako, Iwamoto, Ikuhara and Sakuma1–Reference Kolli, Joost and Ankem3 The martensitic transformations induced by either quenching or applied load are familiar in β-Ti alloys, which significantly influence their mechanical properties. Reference Matsumoto, Watanabe, Masahashi and Hanada4,Reference Kim, Ikehara, Kim, Hosoda and Miyazaki5 Depending on the content of β-stabilizing elements, two kinds of martensitic structures are encountered in β-Ti alloys, i.e., the hexagonal-close-packed (hcp) martensite α′ (P63/mmc) and the orthorhombic martensite α″ (Cmcm). Reference Dobromyslov and Elkin6 The hcp α′ martensitic phase usually forms at lower concentrations of β-stabilizing elements, whereas the orthorhombic α″ martensitic phase occurs at higher concentrations of these elements. The reversible transformation between the β and the orthorhombic α″ martensitic phases is the underlying mechanism of the shape memory and superelasticity in β-Ti alloys. Reference Kim, Ikehara, Kim, Hosoda and Miyazaki5,Reference Kim and Miyazaki7
The martensitic transformation in β-Ti alloys involves two independent atom movement processes: the lattice strain and atomic shuffle. Reference Burgers8 The major difference between the β → α″ and β → α′ transformations is that the displacement of atomic shuffle during the former transformation is less than that during the latter. Therefore, the β → α″ transformation can be considered as a crystallographically incomplete β → α′ transformation. Previous researches have shown that both the lattice strain and atomic shuffle associated with the β → α″ transformations are sensitive to the amount of β-stabilizers in β-Ti alloys. Reference Pathak, Banumathy, Sankarasubramanian and Singh9,Reference Bönisch, Calin, Giebeler, Helth, Gebert, Skrotzki and Eckert10 The lattice strain is a key parameter for deformation behavior, which determines the maximal superelasticity and shape-memory strain in β-Ti alloys. Meanwhile, the volume change induced by lattice strain during martensitic transformation influences the microstructure, morphology, and the degree of self-accommodation of the martensitic phase. Reference Bhattacharya11–Reference Inamura, Kim, Kim, Hosoda, Wakashima and Miyazaki13
For the Ti–V system, Leibovitch et al. reported that the α′ martensitic phase occurred in as-quenched Ti–V alloys at 0–8 at.% V, and the α′, β, and ω phases can be observed at 8–14 at.% V by transmission electron microscope (TEM). Reference Leibovitch, Rabinkin and Talianker14 Ming et al. found the α′ martensitic phase in Ti–V alloys at ∼11 at.% V after quenching by X-ray diffraction (XRD). Reference Ming, Manghnani and Katahara15 The magnetic susceptibility studied by Colling et al. indicated that the predominance of the α′ phase terminated in Ti–V alloys at 10.5 at.% V. Reference Collings16 Moreover, the phases were identified as α′ + (β) for Ti–10 wt% (9.46 at.%)V and α′ + β + α″ + ω for Ti–(11–13) wt% (10.41–12.32 at.%)V from XRD patterns of Ti–V alloys quenched after solution treatment by Matsumoto et al. Reference Matsumoto, Watanabe, Masahashi and Hanada4 Dobromyslov et al. also reported that the minimum content of V for the formation of α″ phase in Ti–V alloys was 9.0 at.% by TEM. Reference Dobromyslov and Elkin6 However, the quantitative relationship between the lattice strains and the volume changes during the β → α′/α″ transformations and V content in β type Ti–V alloys have been rarely investigated.
In this paper, the structural and elastic properties of the α′ and α″ martensitic phases of the binary Ti–xV (x = 0–30) at.% alloys were calculated by using first-principles method in combination with virtual crystal approximation (VCA). The compositional dependences of the lattice strain and volume change during the β → α′/α″ transformations, elastic property, and structural stability of α′ and α″ martensitic phases for Ti–V alloys were studied. Furthermore, the free energy pathways for the α′ and α″ martensitic transformations in Ti–V alloys were also investigated in this paper.
II. COMPUTATIONAL METHOD
The first principles calculations were carried out using ultrasoft pseudopotential (US-PP) method in the frame work of the density functional theory (DFT) implemented by Cambridge Sequential Total Energy Package (CASTEP, BIOVIA, San Diego, California). Reference Hohenberg and Kohn17–Reference Clark, Segall, Pickard, Hasnip, Probert, Refson and Payne20 The Perdew–Burke–Ernzerhof functional within generalized gradient approximation (GGA) was used to describe the electronic exchange and correlation. Reference Perdew, Burke and Ernzerhof21 The Ti-3s 23p 63d 24s 2 and V-3s 23p 63d 34s 2 were treated as valence states. A plane wave energy cut-off of 550 eV and k-point mesh density of 0.02/Å for the unit cells of both phases were used to ensure energy convergence. The total energy was minimized using the Broyden–Fletcher–Goldfarb–Shanno (BFGS) method to determine the equilibrium lattice constants and internal atomic coordinates. Reference Pfrommer, Côté, Louie and Cohen22 The energy and stress tolerance for the geometry optimization were set to 5 × 10⁻⁶ eV/atom and 1 × 10⁻² eV/Å, respectively.
There are five independent elastic constants (C 11, C 12, C 13, C 33, C 44) for the hcp α′ phase and nine independent elastic constants (C 11, C 12, C 13, C 22, C 23, C 33, C 44, C 55, C 66) for the orthorhombic α″ phase, respectively. The elastic constants C ij were determined from a linear fit of the calculated stress as function of strain. Two strain patterns e 1 = (δ, 0, 0, δ, 0, 0) and e 2 = (0, 0, δ, 0, 0, 0) were used to calculate the elastic constants for the α′ phase, and three strain patterns e 1 = (δ, 0, 0, δ, 0, 0), e 2 = (0, δ, 0, 0, δ, 0), and e 3 = (0, 0, δ, 0, 0, δ) were used for the α″ phase. Reference Yu, Zhu and Ye23 In this work, for all strain patterns δ = 0, ±0.002, ±0.004, ±0.006 were taken to calculate stresses for the distorted crystal structures.
For the disordered alloys, there are a number of different approaches, such as VCA and coherent potential approximation (CPA) for dealing with them in first principles calculations. To model the Ti–xV (x = 0–30) at.% disordered alloys, the VCA was used in this work, which is usually applicable when alloys metals that are neighbors in the Periodic table. Reference Bellaiche and Vanderbilt24 Within the VCA, the unit cell of disordered alloys is composed of mixture atoms defined by a pseudopotential that is generated as the weighted average of those for each atomic species. The VCA has the advantages of computational simplicity and preservation of the crystal symmetry, but ignores any possible short range chemical order in the alloys. It has been indicated that the VCA can be used to effectively model the behavior of the elastic constants for the d-transformation alloys and particularly, the elastic constants, ideal strengths, and phase stability for the β phase in Ti–V alloys due to the intimate chemical nature of Ti and V. Reference Söderlind, Eriksson, Wills and Boring25–Reference Yan and Olson29 Thus, the VCA is considered suitable for the calculations of structural and elastic properties of the α′ and α″ martensitic phases, and energy pathways for the α′ and α″ diffusionless martensitic transformations in the binary Ti–xV (x = 0–30) at.% alloys.
III. RESULTS AND DISCUSSION
A. Structural properties
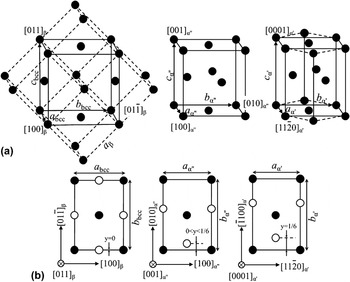
The martensitic transformation in β-Ti alloys results in the formation of either the hcp α′ or the orthorhombic α″ phases depending on the content of alloying elements. The hcp α′ phase has space group of P63/mmc with two atoms per unit cell. The Wyckoff positions of the atoms are given by (1/3,1/6,1/4), (1/6,1/3,3/4), and c/a ≈ 1.58. The orthorhombic structure of the α″ phase has space group of Cmcm where the Wyckoff positions of the atoms are given by (0,0,0), (1/2,1/2,0) (0,y,0), and (0,1/2 + y,1/2). The atomic shuffle, y varies with addition of different alloying element and concentration. The α″ phase could be considered as a transitional phase in between the hcp α′ and body-centered cubic (bcc) β phases. The orientation relationship between the α′ and β phases can be described as {011}β//{0001}α′ and
 ${\left\langle {100} \right\rangle _\beta }{\rm{//}}{\left\langle {{\rm{11\bar 20}}} \right\rangle _{\alpha '}}$
,
Reference Dahmen30
while the α″ phase yields an orientation relationship with respect to the β phase, i.e., {110}β//{001}α″ and 〈111〉β//〈110〉α″.
Reference Hatt and Rivlin31
Fig. 1 is a schematic illustration showing the crystal structure of the β, α″, and α′ phases and their lattice correspondences. For the β phase
 $b{\rm{/}}a = c{\rm{/}}a = \sqrt 2$
and y = 0, whereas for the α′ phase
 $b{\rm{/}}a = \sqrt 3$
and y = 1/6, and
 $\sqrt 2 \lt b{\rm{/}}a \lt \sqrt 3$
and 0 < y < 1/6 for the α″ phase.
(a) Schematic representation of the crystal structures of β, α″ and α′ phases (Conventional unit cells are indicated by dashed lines) and (b) their lattice correspondences (the solid and empty circles located respectively, at adjacent (011)β basal planes for the β phase, (001)α″ for the α″ phase and (0001)α′ for the α′ phase).

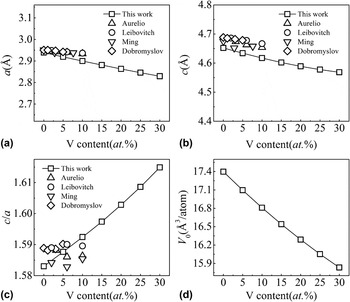
Figure 2 shows the optimized lattice parameters and volume of the α′ phase as function of the V content in Ti–(0–30 at.%)V alloys. The lattice parameters of the α phase of pure Ti are a = 2.939 Å, c = 4.652 Å, and c/a = 1.582 respectively, which are in good agreement with the experimental results (a = 2.950 Å, c = 4.682 Å and c/a = 1.587) and the other theoretical calculations by means of projector augmented wave (PAW) method with GGA (a = 2.929 Å, c = 4.628 Å, and c/a = 1.580). Reference Fisher and Renken32,Reference Wang, Curtarolo, Jiang, Arroyave, Wang, Ceder, Chen and Liu33 Both the lattice parameters and volume of α′ phase decrease with increasing the V content due to the smaller atomic radius of V in Ti–V alloys, while the c/a of α′ phase increases with increasing the V content. The calculated lattice parameters are slightly smaller than but very close to the experimental results measured at room temperature in the previous works. Reference Dobromyslov and Elkin6,Reference Leibovitch, Rabinkin and Talianker14,Reference Ming, Manghnani and Katahara15,Reference Aurelio, Guillermet, Cuello and Campo34
Lattice parameters (a) a, (b) c, (c) c/a and (d) the volume of unit cell per atom V 0 of the α′ phase as function of the V content in Ti–(0–30 at.%)V alloys.

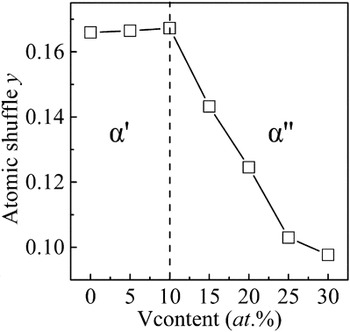
The lattice parameters and internal atomic coordinates of the α″ martensitic unit cell were fully relaxed in this work. The initial atomic shuffle was set as 0.1 to keep the space group of Cmcm. Figure 3 shows the optimized atomic shuffle y of the α″ phase as a function of the V content in Ti–(0–30 at.%)V alloys. It is clearly seen from Fig. 3 that the atomic shuffle y equals to 1/6 for pure Ti and the binary Ti–V alloys with the V content less than 10 at.%. As mentioned above, the atomic shuffle y = 1/6 corresponds to the hexagonal symmetry. Therefore, the equilibrium structure is the hexagonal α′ phase when the V content is less than 10 at.% for Ti–V alloys. When the V content is larger than 10 at.%, the atomic shuffle y < 1/6 and decreases monotonously with increasing the V content. Thus, the equilibrium structure is α″ martensitic phase when the V content is larger than 10% for Ti–V alloys. The decrease of the atomic shuffle with increasing V content is due to the β-stabilizing effect of the V element in the alloys. This implies that the compositional α′/α″ phase boundary is about 10 at.% V in Ti–V alloys, which agrees well with the experimental and other theoretical results. Reference Dobromyslov and Elkin6,Reference Li, Luo, Hu, Yang, Yin, Umezawa and Vitos35
The atomic shuffle y of the α′ and α″ phases as function of the V content in Ti–(0–30 at.%)V alloys.

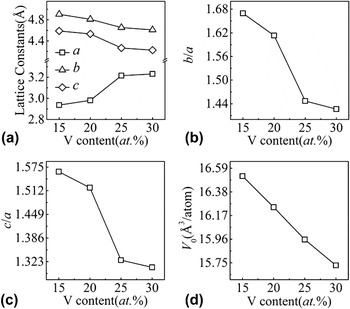
The optimized lattice parameters and volume of the α″ phase for Ti–(15–30 at.%)V alloys as a function of the V content are shown in Fig. 4. The lattice parameter a increases, while the lattice parameters b and c decrease with increasing V content. Both b/a and c/a decrease with increasing V content. They are expected to approach each other eventually and the crystal becomes bcc structure of the β phase with further increase of the V content. The volume V 0 of α″ phase also decreases monotonously with increase of the V content. Furthermore, there is correct ordering for the lattice parameters, i.e., a < c < b in Ti–V alloys, which is in agreement with those in the binary Ti–Nb and Ti–Ta systems. Reference Pathak, Banumathy, Sankarasubramanian and Singh9,Reference Chakraborty, Rogal and Drautz36
Lattice parameters (a) a (b, c), (b) b/a, (c) c/a and (d) the volume of unit cell per atom V 0 of the α″ phase as function of the V content in Ti–(15–30 at.%)V alloys.

Based on the lattice correspondences shown in Fig. 1, the principal lattice strains (η1, η2, and η3) of the β → α′/α″ martensitic transformations are given by
 $${\eta _1} = {{\left( {{a_{{{\alpha '} \mathord{\left/ {\vphantom {{\alpha '} {\alpha ''}}} \right. \kern-\nulldelimiterspace} {\alpha ''}}}} - {a_\beta }} \right)} \mathord{\left/ {\vphantom {{\left( {{a_{{{\alpha '} \mathord{\left/ {\vphantom {{\alpha '} {\alpha ''}}} \right. \kern-\nulldelimiterspace} {\alpha ''}}}} - {a_\beta }} \right)} {{a_\beta },{\eta _2}}}} \right. \kern-\nulldelimiterspace} {{a_\beta },{\eta _2}}} = {{\left( {{b_{{{\alpha '} \mathord{\left/ {\vphantom {{\alpha '} {\alpha ''}}} \right. \kern-\nulldelimiterspace} {\alpha ''}}}} - \sqrt 2 {a_\beta }} \right)} \mathord{\left/ {\vphantom {{\left( {{b_{{{\alpha '} \mathord{\left/ {\vphantom {{\alpha '} {\alpha ''}}} \right. \kern-\nulldelimiterspace} {\alpha ''}}}} - \sqrt 2 {a_\beta }} \right)} {\sqrt 2 {a_\beta },{\eta _3}}}} \right. \kern-\nulldelimiterspace} {\sqrt 2 {a_\beta },{\eta _3}}} = {{\left( {{c_{{{\alpha '} \mathord{\left/ {\vphantom {{\alpha '} {\alpha ''}}} \right. \kern-\nulldelimiterspace} {\alpha ''}}}} - \sqrt 2 {a_\beta }} \right)} \mathord{\left/ {\vphantom {{\left( {{c_{{{\alpha '} \mathord{\left/ {\vphantom {{\alpha '} {\alpha ''}}} \right. \kern-\nulldelimiterspace} {\alpha ''}}}} - \sqrt 2 {a_\beta }} \right)} {\sqrt 2 {a_\beta }}}} \right. \kern-\nulldelimiterspace} {\sqrt 2 {a_\beta }}}\quad .$$
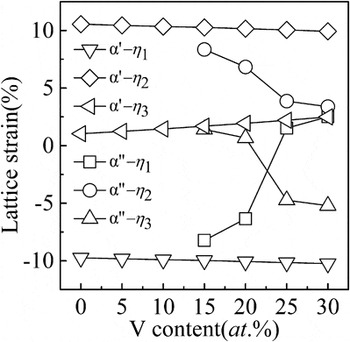
Using the calculated lattice parameters in this work and our previous work, Reference Mei and Sun37 the principal lattice strains were calculated using Eq. (1). The dependences of the principal strains on the V content in Ti–(0–30 at.%)V alloys are presented in Fig. 5. It is seen that the absolute values of the principal lattice strains of β → α′ are larger than those of β → α″. The β → α″ transformation involves smaller principal strains than the β → α′ transformation. The orthorhombic α″ phase is intermediate structure between the β and α′ phases. The principal lattice strains of the β → α′ transformation in pure Ti are η1 = −9.7%, η2 = +10.5%, and η3 = +1.0%, respectively, which are consistent with the values measured by Bonisch et al. within ±1%. Reference Bonisch, Waltz, Calin, Skrotzki and Eckert38 Obviously, the principal lattice strains of the β → α′ transformation are insensitive to variation of the V content, while the principal strains of the β → α″ transformation change significantly with increasing V content in Ti–V alloys.
The compositional dependence of the principal lattice strains of the β → α′/α″ martensitic transformations in Ti–(0–30 at.%)V alloys.

The relative volume variations associated with the formation of the martensitic phases were calculated using Eq. (2),
 $${{\Delta V} \mathord{\left/ {\vphantom {{\Delta V} V}} \right. \kern-\nulldelimiterspace} V} = {{\left( {{V_{{{\alpha '} \mathord{\left/ {\vphantom {{\alpha '} {\alpha ''}}} \right. \kern-\nulldelimiterspace} {\alpha ''}}}} - {V_\beta }} \right)} \mathord{\left/ {\vphantom {{\left( {{V_{{{\alpha '} \mathord{\left/ {\vphantom {{\alpha '} {\alpha ''}}} \right. \kern-\nulldelimiterspace} {\alpha ''}}}} - {V_\beta }} \right)} {{V_\beta }}}} \right. \kern-\nulldelimiterspace} {{V_\beta }}}\quad .$$
Figure 6 shows the relative volume variations associated with the β → α′/α″ martensitic transformations as a function of the V content in Ti–(0–30 at.%)V alloys. It is seen that the transformations from β to α′ and α″ cause the atomic volume to expand in Ti–V alloys. For the β → α′ transformation, the volume variation increases monotonously from 0.81 to 1.14%, while it decreases from 0.83 to 0.46% for the β → α″ transformation with increasing V content. Furthermore, the volume changes will result in elastic strain energy during the β → α′/α″ martensitic transformations in Ti–V alloys. Based on the Eshelby’s theory of a constrained transformation, Reference Morris39,Reference Eshelby40 the elastic strain energy is given by
 $$W = 2G{\left( {{\varepsilon _{{\rm{hyd}}}}} \right)^2}{{\left( {1 + v} \right)} \mathord{\left/ {\vphantom {{\left( {1 + v} \right)} {\left( {1 - v} \right)\quad }}} \right. \kern-\nulldelimiterspace} {\left( {1 - v} \right)\quad }}.$$
G is the shear modulus, v is the Poisson ratio, and εhyd is the hydrostatic strain (εhyd = (η1 + η2 + η3)/3) of the martensitic phases. Here, the elastic strain energy represents an upper limit because the β phase is elastically softer than martensitic phases. Using Eq. (3), the strain energy W α′ = 0.6–0.7 meV/atom was obtained for α′ and W α″ = 0.4–1.1 meV/atom for α″ martensites.
Relative change of the volume associated with β → α′/α″ martensitic transformations in Ti–(0–30 at.%)V alloys.

B. Elastic properties
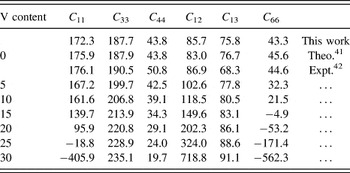
The calculated elastic constants of the α′ phase in Ti–(0–30 at.%)V alloys are listed in Table I. The theoretical elastic constants of pure Ti are in accordance with the experimental and the other calculated results in the literature.
Reference Hao, Zhu, Zhang, Qu and Ren41,Reference Simmons and Wang42
The elastic constants C
11, C
44, and C
66 of the α′ phase in Ti–V alloys monotonously decrease, on the contrary, elastic constants C
12, C
13, and C
33 increase with increasing V content. Based on the Born criteria,
Reference Born and Huang43
the conditions for the mechanical stability of the hexagonal structure are C
11 − C
12 > 0,
 $\left( {{C_{11}} + {C_{12}}} \right){C_{33}} - 2C_{13}^2 > 0$
, and C
44 > 0. It can be seen that the C
ij
values of the α′ phase satisfy these conditions for Ti–V alloys with V content less than 10 at.%, while the elastic constants C
66 are negative when the V content larger than 10 at.%. These results indicate that the α′ phase is mechanically stable for Ti–V alloys with V content less than 10 at.%, but turns to be unstable when the V content is larger than 10 at.%.
The elastic constants C ij (in GPa) of the α′ phase in Ti–(0–30 at.%)V alloys (C 66 = (C 11–C 12)/2).

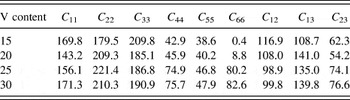
The elastic constants of the α″ phase in Ti–(15–30 at.%)V alloys are listed in Table II. It is shown that there is no simple relationship between the elastic constants and the V content for the α″ phase. The mechanical stability of the α″ phase requires the elastic constants satisfying the following conditions based on the Born criteria: C ii > 0 (i = 1–6), C ii + C jj − 2C ij > 0 (i, j = 1–3), and C 11 + C 22 + C 33 + 2(C 12 + C 13 + C 23) > 0. Reference Born and Huang43 All elastic constants of the α″ phase satisfy the criteria of mechanical stability in Ti–(15–30 at.%)V alloys. This further confirms that the compositional α′/α″ phase boundary is about 10 at.% V in Ti–V alloys from the viewpoint of mechanical stability of crystals.
The elastic constants C ij (in GPa) of the α″ phase in Ti–(15–30 at.%)V alloys.

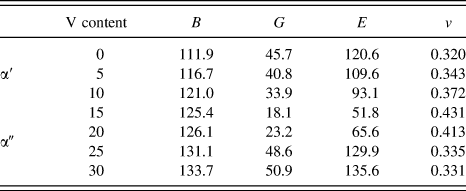
Based on the elastic constants, the bulk modulus B, the shear modulus G, the Young’s modulus E, and the Poisson’s ratio v of α′ and α″ martensitic phases in Ti–V alloys can be evaluated by means of the methods described in the literature. Reference Morris39,Reference Eshelby40 The calculated moduli and the Poisson’s ratio of α′ and α″ martensitic phases are listed in Table III. For the α′ phase, the bulk modulus and Poisson’s ratio increase, while both the shear modulus and the Young’s modulus decrease with an increase of V content. The bulk modulus, the shear modulus, and the Young’s modulus increase, while the Poisson’s ratio decreases with an increase of V content for the α″ phase. These results imply that the elastic anisotropy of the α′ phase increases, but the elastic anisotropy of the α″ phase decreases with increasing V content in Ti–V alloys.
The elastic moduli B, G, E, (in GPa) and Poisson’s ratio v of the α′ and α″ phases in Ti–(0–30 at.%)V alloys.

C. Martensitic transformation pathways
The martensitic transformations in β-Ti alloys involve cooperative atom movement with two independent processes, i.e., the lattice strain (also called Bain strain) and the atoms shuffling.
Reference Burgers8
The lattice strain determines changes of the dimensions, shape, and volume of the crystal. The atoms shuffling gives rise to completion of the structural change by the rearrangement of atoms. In the case of the β → α′/α″ martensitic transformation the atomic shuffles result in a shift of the atoms on a set of parallel {110}β plane in the
 ${\left\langle {1\bar 10} \right\rangle _\beta }$
direction. To be able to model the β → α′/α″ martensitic transformation process in Ti–V alloys, the β phase with a pseudo-orthorhombic unit cell was used, which constructed by e
1 × e
2 × e
3, with e
1 = [100]a
β,
 ${e_2} = {\left[ {01\bar 1} \right]_{{a_\beta }}}$
, and e
3 = [011]a
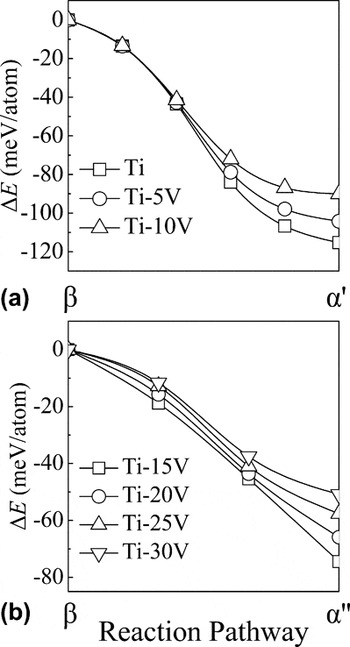
β, and four atoms, as shown in Fig. 1. The Wyckoff positions of the atoms are given by (0,0,0), (1/2,1/2,0), (0,y,0), and (0,1/2 + y,1/2), where y = 0 defines the β phase, 0 < y < 1/6 defines the α″ phase with orthorhombic structure and y = 1/6 defines the α′ phase with hexagonal structure. The calculations of the total energies of the intermediate transition states between the β and α″/α′ phases in Ti–V alloys were carried out to probe the energetic pathway for the β to α″ and α′ transformations. The crystal structures of the intermediate transition states were optimized to minimize the total energy with the internal atom positions keep unaltered during the calculations. The total energy differences with respect to the β phase for each intermediate transition state for β → α′ martensitic transformation in Ti–(0–10 at.%)V alloys and for β → α″ in Ti–(15–30 at.%)V alloys at 0 K are shown in Figs. 7(a) and 7(b), respectively. It can be seen that the relative stability of the α′ phase decreases with increasing V content and there is no energy barrier along the β → α′ transformation path in Ti–(0–10 at.%)V alloys at 0 K. The same results occur for β → α″ transformation in Ti–(15–30 at.%)V alloys at 0 K. The calculated results in this work are consistent with the results calculated by Li et al. using the first-principles exact muffin-tin orbital method in combination with the CPA in Ti–Nb alloys and those reported by Chakraborty et al. by means of the generalized solid-state nudged elastic band method in Ti–Ta alloys.
Reference Li, Luo, Hu, Yang, Yin, Umezawa and Vitos35,Reference Chakraborty, Rogal and Drautz36
(a) The energetic pathways for the β → α′ martensitic transformation in Ti–(0–10 at.%)V alloys and (b) those of the β → α″ martensitic transformation in Ti–(15–30 at.%)V alloys at 0 K.

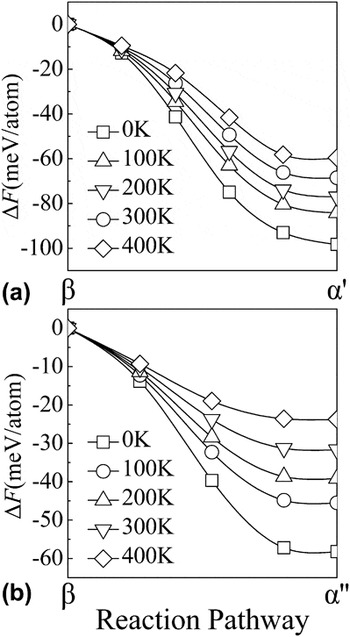
To clarify the temperature effects on the relative stability and energetic pathways for the β to α′ and α″ transformations, the thermodynamic driving force, that is total free energy differences were further calculated in this work, The total free energy difference can be approximated as the sum of the total energy difference at 0 K and the phonon vibrational contribution to the free energy, Reference Tegner, Zhu and Ackland27,Reference Boettger and Wallace44 which can be calculated approximately according to the empirical Debye model. Reference Moruzzi, Janak and Schwarz45 The detailed calculation method of the vibrational free energy was described in our previous work. Reference Mei and Sun37 It is noted that the elastic strain energy associated with the β to α′ and α″ transformations is negligible compared with the chemical free energy difference between the β and α′/α″ phases in Ti–V alloys. In this work, the elastic strain energies resulting from the lattice mismatch between the β and α′/α″ phases were not considered. The free energy differences with respect to the β phase for each intermediate transition state for β → α′ martensitic transformation in Ti–5V at.% alloy and for β → α″ transformation in Ti–20V at.% alloy at different temperatures ranging from 0 to 400 K, as examples, are shown in Figs. 8(a) and 8(b), respectively. It can be seen that the relative stability of α′ phase in Ti–5V at.% alloy and α″ phase in Ti–20V at.% alloy decrease with increasing temperature. Moreover, there do not exist any energy barriers for β → α′/α″ martensitic transformations at temperatures up to 400 K in Ti–V alloys.
(a) The free energy pathways for the β → α′ martensitic transformation in Ti–5 at.% V alloys and (b) those of the β → α″ martensitic transformation in Ti–20 at.% V alloys at temperatures from 0 to 400 K.

IV. CONCLUSION
In summary, first-principles calculations in combination with VCA were performed for the ground state properties of α′ and α″ martensitic phases and the energetic pathways for the β → α′/α″ martensitic transformations in Ti–(0–30)V at.% alloys in this work. It is shown that lattice parameters of the α′ and α″ phases are significantly sensitive to the chemical composition. The lattice parameters a and c of the α′ phase decrease, whereas c/a increases; the lattice parameter a of the α″ phase increases, while b, c, b/a, and c/a decrease with increasing V content in Ti–V alloys. The atomic shuffle y of the α″ phase decreases from that of the α′ phase toward that of the β phase with increasing V content. The calculated results of energetics and mechanical stability of these phases show that the compositional α′/α″ phase boundary is about 10 at.% V, which is in good agreement with experimental and other theoretical results. The principal lattice strains of the β → α′ transformation are insensitive to variation of the V content, while those of the β → α″ transformation change significantly with increasing V content. The volume variations for β → α′ increase, whereas those for β → α″ decrease with increasing V content. The calculated results of energetic pathways for β → α′/α″ transformations show that the relative stability of the α′ and α″ phases decrease with increasing V content and temperature and that there is no energy barriers during the β → α′ martensitic transformation in Ti–(0–10 at.%)V alloys and during the β → α″ martensitic transformation in Ti–(15–30 at.%)V alloys, respectively at temperatures from 0 to 400 K.
ACKNOWLEDGMENTS
The authors would like to acknowledge the financial support from the National Natural Science Foundation of China (Grant No. 51371113) and Science and Technology Committee of Shanghai Municipal (Grant No. 14521100601).