I. INTRODUCTION
Recently, quantum cutting (QC) of rare-earth-doped phosphors has attracted increasing attention as a significant development in the search for luminescent materials with high quantum efficiency (QE).Reference Wegh, Donker, Oskam and Meijerink1–Reference Ye, Zhu, Luo, Chen, Lakshminarayana and Qiu8 QC is a phenomenon that occurs in materials, which could generate two or more low-energy photons by absorbing one high-energy photon. Primitively, intense research activities were focused on the vacuum ultraviolet-excited QC phosphors because it was indispensable for applications in plasma display panels and mercury-free fluorescent lamps.Reference Wegh, Donker, Oskam and Meijerink1–Reference Moine, Beauzamy, Gredin, Wallez and Labeguerie5 Afterwards, the scope of investigation on QC phosphors has been extended to the near-infrared (NIR) region. If conversion of one visible (VIS) photon into two NIR photons is realized and the energy of the NIR photon is just above the band gap of Si (E g = 1.12 eV), then the NIR QC materials could be applied in silicon-based solar cells.Reference Lakshminarayana, Yang, Ye, Liu and Qiu6–Reference Vergeer, Vlugt, Kox, Den Hertog, van der Eerden and Meijerink9
Till date, the main system of NIR QC materials is Tb3+-Yb3+ co-doped phosphors.Reference Vergeer, Vlugt, Kox, Den Hertog, van der Eerden and Meijerink9–Reference Wang, Xie and Zhang16 In this system, the phosphor could emit two NIR photons (Yb3+: 2F7/2 → 2F5/2) through the absorption of one VIS photon (Tb3+: 5D4 → 7F6). Moreover, the Yb3 + 2F7/2 → 2F5/2 emission is situated around 1000 nm, which matches well with the band gap energy of Si.Reference Vergeer, Vlugt, Kox, Den Hertog, van der Eerden and Meijerink9, Reference Zhang and Huang10
Experimental evidences have been presented for QC in Tb3+ and Yb3+ co-doped fluorides (YF3 and TbF3),Reference Zhang and Huang10–Reference Martins, de Araújo, Delben, Gomes, da Costa and Messaddeq12 borates (GdBO3 and LaBaB9O16),Reference Zhang, Yang, Jiang and Ji15, Reference Wang, Xie and Zhang16 and phosphates (YPO4).Reference Vergeer, Vlugt, Kox, Den Hertog, van der Eerden and Meijerink9 However, QC in alkaline metal tungstates has not been investigated. According to Su et al.,Reference Su, Li and Li17 rare-earth (Tb3+, Eu3+, Dy3+, and Sm3+)-doped calcium tungstates have been extensively studied because of their excellent luminescent properties. In this study, we synthesized the phosphors Ca0.99−xYbxWO4: Tb0.01 and investigated their QC phenomenon in VIS–NIR region.
II. EXPERIMENTAL
Calcium carbonate (CaCO3, 99%), tungsten oxide (WO3, 99%), terbium oxide (Tb4O7, 99.99%), and ytterbium oxide (Yb2O3, 99.99%) were used as raw materials. All of them were sufficiently commixed in agate mortar with appropriate amount of ethanol. Then the powders were sintered at 550 °C and 1000 °C for 3 h each in air.
Crystal phase of the obtained materials was determined by powder x-ray diffraction (XRD, Rigaku D/MAX 2400 x-ray diffractometer with Ni-altered Cu Kα radiation). Emission and excitation measurements were performed using a 450 W Xe lamp as the excitation source. Mean decay lifetime measurements were performed using uF900 as the excitation source. All measurements were carried out at room temperature.
III. RESULTS AND DISCUSSION
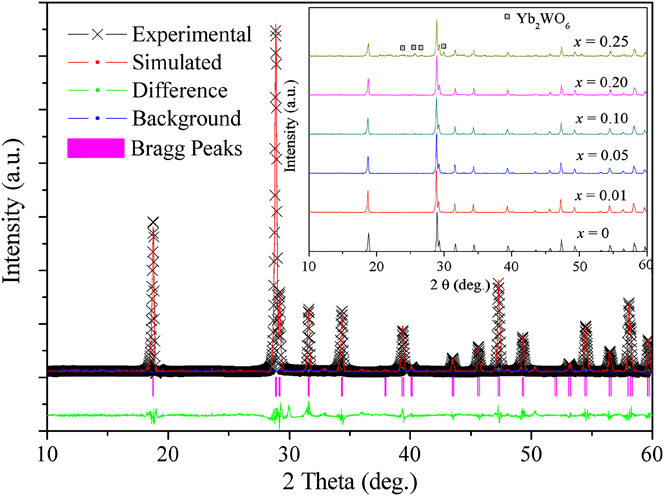
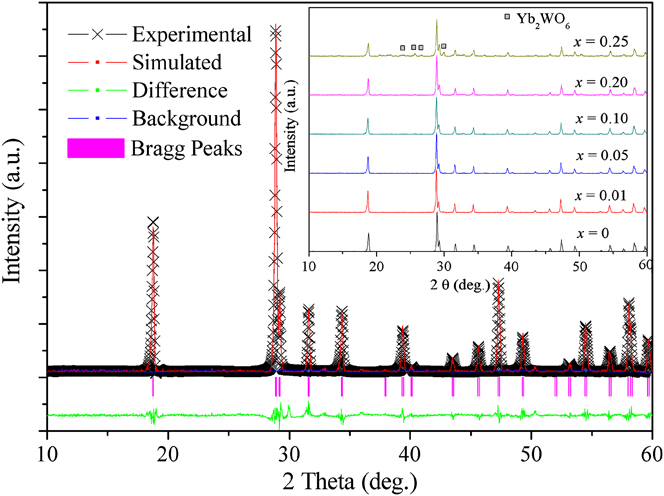
The experimental and calculated results of the XRD refinement of Ca0.89WO4: 0.01Tb3+, 0.1Yb3+ are plotted in Figure 1. The inset exhibits the XRD patterns of Ca0.99−xWO4: 0.01Tb3+, xYb3+ (0 ≤ x ≤ 0.25) phosphors. The observed peaks of Ca0.89WO4: 0.01Tb3+, 0.1Yb3+ satisfy the reflection condition, R p = 5.48% and R wp = 4.77%, which indicate that the refinement result is reliable. By analyzing the result, it is found that Ca0.89WO4: 0.01Tb3+, 0.1Yb3+ is of scheelite structure with I41/a space group and with lattice constants a = 5.2386(3) Å, b = 5.2386(3) Å, and c = 11.3723(2) Å, which are in good agreement with those of CaWO4 (JCPDS Card No. 77-2233). Therefore, the crystal structure of CaWO4 is not changed obviously by doping 1% Tb3+ and 10% Yb3+. For Ca0.99−xWO4: 0.01Tb3+, xYb3+ (x = 0, 0.01, 0.05, and 0.2) samples, the XRD patterns are similar and could also be indexed to single phase (as shown in the inset of Fig. 1). However, when the doping concentration of Yb3+ reaches 25%, an impurity phase assigned as Yb2WO6 is observed at 2θ = 24.08°, 25.6°, 26.72°, and 29.9°. As a result, the suitable concentration range of Yb3+ in Ca0.99WO4: 0.01Tb3+ is acquired at 0–20%.
x-Ray diffraction (XRD) refinement of Ca0.89WO4: 0.01Tb3+, 0.1Yb3+ sample; the inset is the XRD patterns of Ca0.99−xWO4: 0.01Tb3+, xYb3+ (0 ≤ x ≤ 0.25) phosphors.
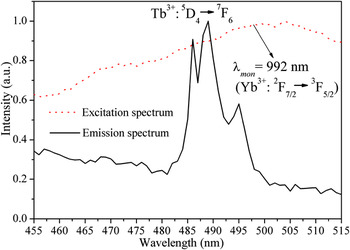
Luminescent measurements are recorded to give convincing evidence for the existence of Tb3+-Yb3+ energy transfer (ET). Figure 2 illustrates the excitation spectrum of Ca0.99−xWO4: 0.01Tb3+, xYb3+ (x = 0.2; dotted line) monitored at 992 nm (2F5/2 → 2F7/2 of Yb3+) and the emission spectrum of Tb3+ in Ca0.99−xWO4: 0.01Tb3+, xYb3+ (x = 0; solid line) excited by 254 nm. An intense absorption band is observed around 480–530 nm in the excitation spectrum, and an intense emission peak at 489 nm ascribing to the 5D4 → 7F6 transition of Tb3+ is exhibited in the emission spectrum. The overlap of the excitation and emission spectra suggests that the ET from 5D4 level of Tb3+ to 2F5/2 level of Yb3+ in CaWO4: Tb3+, Yb3+ phosphor exists.Reference Zhang, Yang, Jiang and Ji15
Excitation spectrum of Ca0.99−xWO4: 0.01Tb3+, xYb3+ (x = 0.2; dotted line) monitored at 992 nm (2F5/2 → 2F7/2 of Yb3+) and emission spectrum of Tb3+ in Ca0.99−xWO4: 0.01Tb3+, xYb3+ (x = 0; solid line) excited by 254 nm.

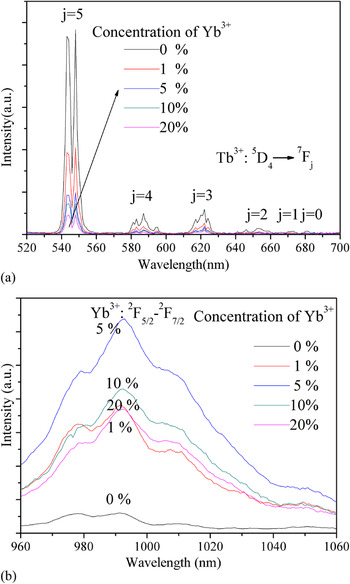
The emission spectra of Ca0.99−xWO4: 0.01Tb3+, xYb3+ (0 ≤ x ≤ 0.20) in the VIS region from 520 to 650 nm excited by 489 nm are shown in Fig. 3(a). Under 489 nm excitation, emission peaks at around 545, 587, 622, 653, 673, and 681 nm are clearly observed, which could be assigned to characteristic 5D4 → 7Fj (j = 5, 4, 3, 2, 1, 0) transitions of Tb3+.Reference Su, Li and Li17 The emission spectra of Ca0.99−xWO4: 0.01Tb3+, xYb3+ (0 ≤ x ≤ 0.20) in the NIR region from 960 to 1060 nm are presented in Fig. 3(b) (λ ex = 489 nm). The emission band from 960 to 1040 nm could be attributed to the transition of Yb3+ from the high Stark level of the 5F2 multiplet to the low Stark level of the 7F2 multiplet. Similar explanation was reported in the references.Reference Wang, Xie and Zhang16, Reference Chen, Wang, Yu and Ma18 From the comparison of the spectra, it is found that the emission intensities of Tb3+ rapidly decreased with the increase of Yb3+ concentration. Meanwhile, it is noticed that the luminescence intensities of the NIR emission enhance with increasing Yb3+ concentration. This is another evidence for the cooperative ET from Tb3+ to Yb3+. However, the decrease in NIR emission intensities is also observed when Yb3+ concentration is more than 5% because of concentration quenching.
Emission spectra of Ca0.99−xWO4: 0.01Tb3+, xYb3+ (0 ≤ x ≤ 0.20) in VIS region from 520 to 650 nm (a) and NIR region from 960 to 1060 nm (b) (λ ex = 489 nm).

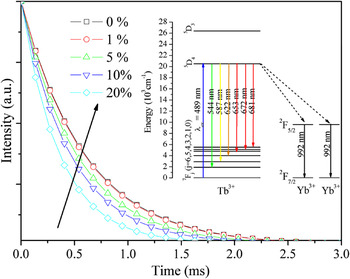
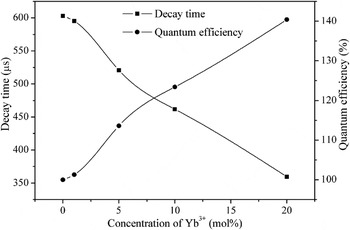
The lifetimes of phosphors could reflect the ET among luminescent centers. In Fig. 4, the luminescent decay curves of Tb3 + 5D4 → 7F5 transition at 545 nm are plotted for Ca0.99−xWO4: 0.01Tb3+, xYb3+ (0 ≤ x ≤ 0.20) under 489 nm excitation. The decay curve of a singly doped (Ca0.99Tb0.01)WO4 phosphor fits well to a single exponential function with a decay time of 602.94 μs. The lifetimes of the other samples are determined to be 595.16, 520.93, 461.83, and 359.6 μs for x = 0.01, 0.05, 0.1, and 0.2, respectively, in Ca0.99−xWO4: 0.01Tb3+, xYb3+. Obviously, the decay times decrease rapidly with increasing Yb3+ doping concentration in the range of 0–20 mol%. The decline in the lifetimes can be well explained by the introduction of extra decay pathways because the codopant Yb3+: ET from Tb3+ to Yb3+ enhances the Tb3+ decay rate. This result is in good agreement with that obtained from Figs. 2 and 3. Hence, the ET from Tb3+ to Yb3+ in Ca0.99−xWO4: 0.01Tb3+, xYb3+ (0 ≤ x ≤ 0.20) is proved.
Luminescent decay curves of Ca0.99−xWO4: 0.01Tb3+, xYb3+ (0 ≤ x ≤ 0.20) monitored at 545 nm by 489 nm excitation; the inset is the energy level graph about the QC process from Tb3+ to Yb3+.

It is noteworthy that the excitation band in Fig. 2 could not be ascribed to the characteristic transition of Yb3+. If the overlap between donor characteristic emission and acceptor characteristic absorption is absent, the second-order downconversion may become the dominant relaxation process, in which one donor excites two acceptors simultaneously.Reference Vergeer, Vlugt, Kox, Den Hertog, van der Eerden and Meijerink9 For the resonance ET in the second-order downconversion, it should be fulfilled that the sum of the absorption energy of the two acceptors equals the emission energy of the one donor. Therefore, the excitation spectrum, emission spectra, and decay lifetimes of Ca0.99−xWO4: 0.01Tb3+, xYb3+ (0 ≤ x ≤ 0.20) indicate that NIR QC occurs under excitation at the 5D4 level of Tb3+ as the two NIR photons could be emitted by absorbing one VIS photon due to the cooperative ET from Tb3+ to Yb3+. The energy level graph about the QC process from Tb3+ to Yb3+ is illustrated in the inset of Fig. 4.
The ET efficiency (η ETE) and QE (η QE) could be determined from the luminescent decay curves. The η ETE is defined as the ratio of Tb3+ ions that depopulate by ET to Yb3+ ions over the total number of Tb3+ ions excited. The total η QE is defined as the ratio of the number of photons emitted (visible and infrared) to the number of photon absorbed, assuming that all excited Yb3+ ions decay radiatively. This assumption leads to an upper limit of the QE, which is lower than the actual efficiency due to concentration quenching. By dividing the integrated intensity of the decay curves of YbxCa0.99−xTb0.01WO4 phosphors to the integrated intensity of Ca0.99Tb0.01WO4 curve, we can obtain η ETE as a function of the Yb3+ concentration: 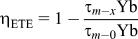 ,Reference Wegh, Donker, Oskam and Meijerink1, Reference Vergeer, Vlugt, Kox, Den Hertog, van der Eerden and Meijerink9 where τ denotes the decay lifetime and x represents the Yb3+ concentration. The relation between η QE and η ETE is linear and defined as
 ,Reference Wegh, Donker, Oskam and Meijerink1, Reference Vergeer, Vlugt, Kox, Den Hertog, van der Eerden and Meijerink9 where the nonradiate energy loss is ignored and η Tb is set to 1. Using the above two equations, the values of η ETE and η QE are obtained. Figure 5 shows the decay lifetimes and η QE of YbxCa0.99−xTb0.01WO4 phosphors as a function of Yb3+ concentration. It is found that the maximum value of η QE reaches 140.4% when the doping concentration of Yb3+ reaches 20%. This means that the depopulation of Tb3 + 5D4 level proceeds about 40 out of 100 times by excitation of two Yb3+ ions to the 2F5/2 level. As mentioned in the introduction, this NIR QC phosphor with high QE could be considered as a promising candidate for Si-based solar cells.
Decay lifetimes and η QE of YbxCa0.99−xTb0.01WO4 phosphors as a function of Yb3+ concentration (0 ≤ x ≤ 0.20).

IV. CONCLUSIONS
Tb3+ and Yb3+ codoped tungstates Ca0.99−xYbxWO4: Tb0.01 were successfully synthesized by conventional solid-state reactions. On the basis of XRD analysis, the suitable doping concentration range of Yb3+ in Ca0.99Tb0.01WO4 was obtained as 0–20%. From the investigation on photoluminescence spectra and decay lifetimes, the ET from Tb3+ to Yb3+ in the tungstates was proved and the possible QC process was concluded. By calculation obtained from the decay curves, the maximum QE of the tungstates was found to reach 140.4%. Because the energy of the NIR emission being just above the band gap of the crystalline Si, the phosphor could be potentially applied in silicon-based solar cells.
ACKNOWLEDGMENTS
The authors thank the National Natural Science Foundation of China (10874061), the Research Fund for the Doctoral Program of Higher Education (200807300010), and the National Science Foundation for Distinguished Young Scholars (50925206).