





Introduction
The Five Factor Model (FFM) / ‘Big Five’ personality traits is a robust framework that captures the broad individual differences in thinking, feeling, and behaving between humans (McCrae & Costa, Reference McCrae, Costa, Pervin and John1999). Beyond simply classifying behavior, the FFM traits of agreeableness, conscientiousness, extraversion, neuroticism, and openness have been shown to be deeply intertwined with psychiatric vulnerability and clinical psychopathology (DeYoung & Krueger, Reference DeYoung and Krueger2018; Kotov et al., Reference Kotov, Krueger, Watson, Achenbach, Althoff, Bagby, Brown, Carpenter, Caspi, Clark, Eaton, Forbes, Forbush, Goldberg, Hasin, Hyman, Ivanova, Lynam, Markon and Clark2017; Widiger et al., Reference Widiger, Sellbom, Chmielewski, Clark, DeYoung, Kotov, Krueger, Lynam, Miller, Mullins-Sweatt, Samuel, South, Tackett, Thomas, Watson and Wright2019). As personality traits have been shown to be substantially heritable (Jang et al., Reference Jang, Livesley, Ando, Yamagata, Suzuki, Angleitner and Spinath2006; Vukasović & Bratko, Reference Vukasović and Bratko2015), insight into the genetic underpinnings of personality will help to elucidate the biological pathways contributing to both general behavioral variation and psychiatric vulnerability.
Cybernetic Big Five Theory (CB5T) posits that the individual differences in human personality captured by the FFM reflect variation in the parameters of goal-directed, cybernetic mechanisms in the brain (DeYoung, Reference DeYoung2015; Safron & DeYoung, Reference Safron, DeYoung, Wood, Read, Harms and Slaughter2021). At a higher-order level, these domains cohere into two ‘meta-traits’: stability and plasticity, which capture the moderate shared variance across the FFM traits (DeYoung, Reference DeYoung2006; DeYoung, Tai, Chou, & Mlačić, Reference DeYoung, Tai, Chou and Mlačić2026; Digman, Reference Digman1997). Stability (agreeableness, conscientiousness, and low neuroticism) captures individuals’ capacity to resist perturbation and maintain order across social, emotional, and motivational systems (DeYoung, Reference DeYoung2006). Plasticity (extraversion and openness), on the other hand, indexes one’s capacity to explore, learn, and flexibly engage with novelty across behavior and cognition (DeYoung, Reference DeYoung2006). Although CB5T offers a promising bridge to broader predictive coding frameworks in computational neuroscience (Safron & DeYoung, Reference Safron, DeYoung, Wood, Read, Harms and Slaughter2021), direct biological evidence remains limited and indirect (DeYoung, Grazioplene, & Allen, Reference DeYoung, Grazioplene and Allen2021), due in large part to a lack of scalable research tools capable of teasing apart complex and nuanced brain mechanisms in situ. Recent advances in large-scale genomic datasets and multivariate statistical tools create unprecedented opportunity to test whether these meta-traits reflect genetically coherent dimensions and to map the biological pathways that underpin human personality.
Links between personality traits and psychopathology have long been noted, with dimensional frameworks such as HiTOP noting the fuzzy boundaries between disposition and disorder (DeYoung & Krueger, Reference DeYoung and Krueger2018; Kotov et al., Reference Kotov, Krueger, Watson, Achenbach, Althoff, Bagby, Brown, Carpenter, Caspi, Clark, Eaton, Forbes, Forbush, Goldberg, Hasin, Hyman, Ivanova, Lynam, Markon and Clark2017; Widiger et al., Reference Widiger, Sellbom, Chmielewski, Clark, DeYoung, Kotov, Krueger, Lynam, Miller, Mullins-Sweatt, Samuel, South, Tackett, Thomas, Watson and Wright2019). The FFM traits which comprise stability are broadly protective of psychopathology; high agreeableness, high conscientiousness, and low neuroticism are negatively associated with psychopathology, with this effect being most pronounced for low neuroticism (Malouff, Thorsteinsson, & Schutte, Reference Malouff, Thorsteinsson and Schutte2005; Mann et al., Reference Mann, Atherton, DeYoung, Krueger and Robins2020). Extraversion shows facet-specific patterns, with communal extraversion typically related to lower levels of internalizing symptoms, whereas agentic extraversion tends to associate positively with externalizing behaviors (Watson et al., Reference Watson, Ellickson-Larew, Stanton, Levin-Aspenson, Khoo, Stasik-O’Brien and Clark2019a). Finally, aspects of openness are positively linked with psychosis-spectrum traits (Straub & Kerns, Reference Straub and Kerns2021) and also share genetic loci with schizophrenia (Smeland et al., Reference Smeland, Wang, Lo, Li, Frei, Witoelar, Karadzhov, Dale, Andreassen and Djurovic2017). Although the genetic overlap between the FFM traits and psychiatric conditions has been investigated previously (Gupta et al., Reference Gupta, Galimberti, Liu, Beck, Wingo, Wingo, Ashley-Koch, Aslan, Assimes, Aouizerat, Balkan, Beckham, Belanger, Bierut, Boundy, Brady, Bryant, Bustamante and Program2024; Lo et al., Reference Lo, Hinds, Tung, Franz, Fan, Wang, Smeland, Schork, Holland, Witoelar, Podgorny, Diallo, Dale, Djurovic, Andreassen and Chen2017; Nagel et al., Reference Nagel, Jansen, Stringer, Watanabe, De Leeuw, Bryois, Savage, Hammerschlag, Skene, Muñoz-Manchado, White, Tiemeier, Linnarsson, Hjerling-Leffler, Polderman, Sullivan, van der Sluis and Posthuma2018; Schwaba et al., Reference Schwaba, Clapp Sullivan, Akingbuwa, Ilves, Tanksley, Williams, Giannelis, de Vlaming, Mõttus, Realo, Allik, van der Sluis, Nivard, Bartels, Boomsma, Cath, de Geus, Grotzinger, Harden and Tucker-Drob2025), it remains unknown whether these genetic correlations can be captured by shared dimensions of genetic overlap between personality traits such as stability and plasticity.
Apart from neuroticism, genome-wide association studies (GWAS) of the FFM personality traits were historically underpowered relative to other psychiatric traits. Recently, both Gupta et al. (Reference Gupta, Galimberti, Liu, Beck, Wingo, Wingo, Ashley-Koch, Aslan, Assimes, Aouizerat, Balkan, Beckham, Belanger, Bierut, Boundy, Brady, Bryant, Bustamante and Program2024) and the Revived Genomics of Personality Consortium (reGPC) (Schwaba et al., Reference Schwaba, Clapp Sullivan, Akingbuwa, Ilves, Tanksley, Williams, Giannelis, de Vlaming, Mõttus, Realo, Allik, van der Sluis, Nivard, Bartels, Boomsma, Cath, de Geus, Grotzinger, Harden and Tucker-Drob2025) have substantially boosted the sample size for all five FFM traits, with the latter reporting 39, 131, 258, 703, and 126 genome-wide significant loci for agreeableness, conscientiousness, extraversion, neuroticism and openness respectively, greatly expanding upon previous efforts (De Moor et al., Reference De Moor, Costa, Terracciano, Krueger, De Geus, Toshiko, Penninx, Esko, Madden, Derringer, Amin, Willemsen, Hottenga, Distel, Uda, Sanna, Spinhoven, Hartman, Sullivan and Derringer2012; de Moor et al., Reference de Moor, van den Berg, Verweij, Krueger, Luciano, Arias Vasquez, Matteson, Derringer, Esko, Amin, Gordon, Hansell, Hart, Seppälä, Huffman, Konte, Lahti, Lee, Miller and Boomsma2015; Lo et al., Reference Lo, Hinds, Tung, Franz, Fan, Wang, Smeland, Schork, Holland, Witoelar, Podgorny, Diallo, Dale, Djurovic, Andreassen and Chen2017; Nagel et al., Reference Nagel, Jansen, Stringer, Watanabe, De Leeuw, Bryois, Savage, Hammerschlag, Skene, Muñoz-Manchado, White, Tiemeier, Linnarsson, Hjerling-Leffler, Polderman, Sullivan, van der Sluis and Posthuma2018; Van den Berg et al., Reference Van den Berg, de Moor, Verweij, Krueger, Luciano, Arias Vasquez, Matteson, Derringer, Esko, Gordon, Hansell, Hart, Seppälä, Huffman, Konte, Lahti, Lee, Miller, Nutile and Amin2016). Beyond increased power, multivariate tools such as Genomic Structural Equation Modelling (SEM) and functional extensions (e.g. transcriptome-wide SEM and stratified Genomic SEM) enable modeling of latent genetic dimensions and prioritization of biological pathways underlying shared risk (Grotzinger et al., Reference Grotzinger, Rhemtulla, de Vlaming, Ritchie, Mallard, Hill, Ip, Marioni, McIntosh, Deary, Koellinger, Harden, Nivard and Tucker-Drob2019, Reference Grotzinger, de la Fuente, Davies, Nivard and Tucker-Drob2022a, Reference Grotzinger, Mallard, Akingbuwa, Ip, Adams, Lewis, McIntosh, Grove, Dalsgaard, Strom, Meier, Mattheisen, Børglum, Mors, Breen, Lee, Kendler, Smoller, Tucker-Drob and Lesch2022b). These multivariate approaches have successfully identified shared dimensions of genetic risk and convergent biology across psychiatric conditions (Grotzinger et al., Reference Grotzinger, Mallard, Akingbuwa, Ip, Adams, Lewis, McIntosh, Grove, Dalsgaard, Strom, Meier, Mattheisen, Børglum, Mors, Breen, Lee, Kendler, Smoller, Tucker-Drob and Lesch2022b, Reference Grotzinger, Werme, Peyrot, Frei, de Leeuw, Bicks, Guo, Margolis, Coombes, Batzler, Pazdernik, Biernacka, Andreassen, Anttila, Børglum, Breen, Cai, Demontis, Edenberg and Smoller2025). Here we apply these same methods to recently updated personality GWAS to investigate whether the FFM meta-traits stability and plasticity are reflected in the genome and to highlight shared biology across the FFM personality traits.
In this work, we conduct a multivariate genomic investigation into the FFM meta-traits stability and plasticity and characterize their overlap with psychopathology. We first combined the European GWAS summary statistics from the recent Gupta et al. (Reference Gupta, Galimberti, Liu, Beck, Wingo, Wingo, Ashley-Koch, Aslan, Assimes, Aouizerat, Balkan, Beckham, Belanger, Bierut, Boundy, Brady, Bryant, Bustamante and Program2024) work with summary statistics from the 23andMe Research Institute (Lo et al., Reference Lo, Hinds, Tung, Franz, Fan, Wang, Smeland, Schork, Holland, Witoelar, Podgorny, Diallo, Dale, Djurovic, Andreassen and Chen2017) and conducted a GWAS meta-analysis across ~280,000–680,000 individuals for each of the FFM personality traits to boost power for downstream analyses. Next, using Genomic SEM, we identified two latent genetic factors consistent with the meta-traits stability and plasticity and performed a multivariate GWAS of these latent factors, identifying genetic loci having shared effects across the FFM traits. We then conducted transcriptome-wide association studies (TWAS) and cell-type enrichment analyses to highlight potential biological pathways underpinning the FFM traits/meta-traits. Finally, we quantified genetic overlap between the FFM traits/meta-traits and 11 psychiatric conditions using genetic correlations and tested for directional associations using bidirectional, pleiotropy-aware Mendelian randomization (MR) analyses.
Methods
GWAS meta-analysis of FFM personality traits
To boost power for downstream analyses, we first conducted GWAS meta-analyses for each of the FFM personality traits across all currently available samples using the inverse variance weighting scheme in METAL (Willer, Li, & Abecasis, Reference Willer, Li and Abecasis2010), combining the European GWAS summary statistics from Gupta et al. (Reference Gupta, Galimberti, Liu, Beck, Wingo, Wingo, Ashley-Koch, Aslan, Assimes, Aouizerat, Balkan, Beckham, Belanger, Bierut, Boundy, Brady, Bryant, Bustamante and Program2024) (N = 220,015–623,482) with the 23andMe Research Institute sample from Lo et al. (Reference Lo, Hinds, Tung, Franz, Fan, Wang, Smeland, Schork, Holland, Witoelar, Podgorny, Diallo, Dale, Djurovic, Andreassen and Chen2017) (N = 59,225). Our analyses were restricted to the EUR ancestry subset of Gupta et al (Reference Gupta, Galimberti, Liu, Beck, Wingo, Wingo, Ashley-Koch, Aslan, Assimes, Aouizerat, Balkan, Beckham, Belanger, Bierut, Boundy, Brady, Bryant, Bustamante and Program2024) as the AFR ancestry subset was not publicly available. Moreover, given the substantially smaller sample size, the AFR ancestry subset would likely be underpowered for downstream analyses. The full methods and results for our univariate GWAS meta-analyses are presented in the Supplementary Note. The summary statistics generated from our GWAS meta-analyses were then used for all subsequent analyses.
Genetic correlation analyses and genomic SEM
We used the multivariable version of LDSC (Bulik-Sullivan et al., Reference Bulik-Sullivan, Loh, Finucane, Ripke, Yang, Patterson, Daly, Price and Neale2015) in the Genomic SEM R package (Grotzinger et al., Reference Grotzinger, Rhemtulla, de Vlaming, Ritchie, Mallard, Hill, Ip, Marioni, McIntosh, Deary, Koellinger, Harden, Nivard and Tucker-Drob2019) to estimate genetic correlations between the FFM traits and 11 psychiatric conditions (psychiatric condition GWAS summary statistics used are reported in the Supplementary Note). This also produced the S and V matrices required for Genomic SEM.
Exploratory factor analysis (EFA) on the genetic covariance matrix of the FFM traits was conducted using the factanal() function in the stats R package. Both oblique and orthogonal rotations (Promax and Varimax, respectively) were tested for 1-factor and 2-factor solutions across the full genome, as well as for odd and even chromosomes separately to ensure robustness across alternative partitions of the genome.
CFA was conducted using the usermodel() function in the Genomic SEM R package using the diagonally weighted least-squares estimator. We used benchmarks of: CFI > 0.85 and SRMR <0.10 as acceptable fit, CFI > 0.90 and SRMR <0.05 as good fit, and CFI > 0.95 and SRMR <0.01 as great fit (Grotzinger et al., Reference Grotzinger, Rhemtulla, de Vlaming, Ritchie, Mallard, Hill, Ip, Marioni, McIntosh, Deary, Koellinger, Harden, Nivard and Tucker-Drob2019; Hu & Bentler, Reference Hu and Bentler1999). For our final model, we also conducted CFA on odd and even chromosomes separately to ensure relative robustness across alternative partitions of the genome. Unit variance identification was used for all models tested.
Genetic correlations between the meta-traits and psychiatric conditions were estimated within Genomic SEM by specifying the meta-trait factor structure (model presented in Figure 1b) and estimating covariances between the latent factors and psychiatric conditions.
(a) Heatmap of genetic correlation (rg) estimates between the Five-Factor Model personality traits. (b) Factor loadings and model fit for the meta-trait model of the Five-Factor Model personality traits. (c, d) Manhattan plots of genome-wide association study statistics for stability (c) and plasticity (d). Dashed lines correspond to the genome-wide significance threshold (P = 5e−8). Labels correspond to the lead SNP at each genome-wide significant locus that was not identified in our univariate GWAS meta-analyses. For readability, labels are placed above the chromosome on which each locus is located. Note: agree, ‘agreeableness’; invneuro, ‘inverted neuroticism’; consc, ‘conscientiousness’; extra, ‘extraversion’; openn, ‘openness’; stab, ‘stability’; plas, ‘plasticity’. Standard errors are given in parentheses.

Figure 1. Long description
Panel A is a triangular heatmap of genetic correlation r g estimates between five traits. The diagonal shows values of 1 in grey. Off-diagonal cells range from blue negative to red positive. Highest correlations include extraversion and openness at 0.39, and agreeableness and inverted neuroticism at 0.33.
Panel B is a structural equation model. Two higher-order latent factors, S T A B in blue and P L A S in orange, are correlated at 0.36. S T A B loads onto A G R E E at 0.86, I N V N E U R O at 0.37, and C O N S C at 0.25. P L A S loads onto E X T R A at 0.67 and O P E N N at 0.57. Model fit indices are listed in the top right: chi-squared equals 55.43, d f equals 5, A I C equals 75.44, C F I equals 0.86, and S R M R equals 0.06.
Panels C and D are Manhattan plots for Stability and Plasticity respectively. The y-axis is negative log 10 P-value and the x-axis is Chromosome 1 through 22. A red dashed line indicates the genome-wide significance threshold at 5 times 10 super minus 8.
* In Panel C Stability, significant peaks are labeled with S N P identifiers: r s 507288, r s 10013081, r s 161645, r s 7747908, r s 1180183, r s 1734235, r s 9644651, r s 2378676, r s 2227558, r s 1696319, r s 1854228, r s 4408428, r s 3205743, and r s 2137138.
* In Panel D Plasticity, significant peaks are labeled: r s 6797413, r s 7103411, r s 12886497, and r s 745570.
Multivariate GWAS of the meta-traits
Once we arrived at a model (Figure 1b), we used the usergwas() function in Genomic SEM (Grotzinger et al., Reference Grotzinger, Rhemtulla, de Vlaming, Ritchie, Mallard, Hill, Ip, Marioni, McIntosh, Deary, Koellinger, Harden, Nivard and Tucker-Drob2019) to conduct a multivariate GWAS for stability and plasticity. Independent genome-wide significant loci were identified using the SNP2GENE function in FUMA (Watanabe, Taskesen, Van Bochoven, & Posthuma, Reference Watanabe, Taskesen, Van Bochoven and Posthuma2017) using the 1000 Genomes (phase 3) European reference panel. Independent significant single nucleotide polymorphisms (SNPs) were defined as having a genome-wide significance threshold of P < 5e−8 and an LD threshold of r 2 < 0.6 with other local SNPs. Lead SNPs were identified using a secondary LD threshold of r 2 < 0.1. Genome-wide significant loci were merged if lead SNPs overlapped within ±250 kb of one another. The SNP2GENE function in FUMA was also used for gene mapping. Genes were mapped for each of the genome-wide significant loci identified using both positional (within ±10 kb of lead SNPs) and cis-eQTL mapping using PsychENCODE (Akbarian et al., Reference Akbarian, Liu, Knowles, Vaccarino, Farnham, Crawford, Jaffe, Pinto, Dracheva, Geschwind, Mill, Nairn, Abyzov, Pochareddy, Prabhakar, Weissman, Sullivan, State, Weng and Sestan2015), BRAINEAC (Ramasamy et al., Reference Ramasamy, Trabzuni, Guelfi, Varghese, Smith, Walker, De, Coin, De Silva and Cookson2014), and GTEX v8 (Consortium et al., Reference Aguet, Anand, Ardlie, Gabriel, Getz, Stricker, Alperovich, Segrè, Garrido-Martín, Park, Flutre, Gillard, Zhou, Overbey, Rush, Carter, Weber, Juster and Volpi2020) (all tissues) annotations. Genome-wide significant loci for the meta-traits were then compared to both our own univariate GWAS and lead SNPs from the recent reGPC preprint (Schwaba et al., Reference Schwaba, Clapp Sullivan, Akingbuwa, Ilves, Tanksley, Williams, Giannelis, de Vlaming, Mõttus, Realo, Allik, van der Sluis, Nivard, Bartels, Boomsma, Cath, de Geus, Grotzinger, Harden and Tucker-Drob2025) to highlight overlaps (i.e. lead SNPs positionally overlapping with FUMA-defined genome-wide significant loci for the meta-traits).
Genomic SEM also computes an SNP-level heterogeneity metric (QSNP), which identifies SNPs that have patterns of effects better explained by an independent pathways model rather than a latent factor. PLINK (Purcell et al., Reference Purcell, Neale, Todd-Brown, Thomas, Ferreira, Bender, Maller, Sklar, de Bakker, Daly and Sham2007) was used for identification of QSNP loci. Lead QSNPs were identified using a QSNP P-value threshold of <5e−8, distance cutoff = 250 kb, r
2 < 0.1 using the 1000 Genomes European reference panel. We also compared mean GWAS association
$ {\chi}^2 $
 [1] with mean QSNP
$ {\chi}^2 $
 [1], as outlined in Clapp Sullivan et al. (Reference Clapp Sullivan, Schwaba, Harden, Grotzinger, Nivard and Tucker-Drob2024) to further probe the biological coherence of the FFM meta-traits.
Cell-type enrichment analyses
For the FFM traits, stratified LDSC regression (Finucane et al., Reference Finucane, Bulik-Sullivan, Gusev, Trynka, Reshef, Loh, Anttila, Xu, Zang, Farh, Ripke, Day, Purcell, Stahl, Lindstrom, Perry and Price2015) was used to examine enrichment for FFM SNP-based heritability across the 31 brain cell supercluster annotations from Yao et al. (Reference Yao, Harder, Darki, Chang, Li, Nikouei, Volpe, Lundström, Zeng, Wray, Lu, Sullivan and Hjerling-Leffler2025) and the baselineLD v2.2 annotations (Hujoel et al., Reference Hujoel, Gazal, Hormozdiari, van de Geijn and Price2019). The annotations from Yao et al. (Reference Yao, Harder, Darki, Chang, Li, Nikouei, Volpe, Lundström, Zeng, Wray, Lu, Sullivan and Hjerling-Leffler2025) correspond to the top decile of gene expression for the 31 cell-type superclusters identified in the large Siletti et al. (Reference Siletti, Hodge, Mossi Albiach, Lee, Ding, Hu, Lönnerberg, Bakken, Casper, Clark, Dee, Gloe, Hirschstein, Shapovalova, Keene, Nyhus, Tung, Yanny, Arenas and Linnarsson2023) RNA-Seq study. The baselineLD v2.2 annotations capture a spectrum of genomic features such as regulatory elements and conservation metrics.
We first combined the Yao et al. annotations with the baselineLD v2.2 annotations and then recomputed LD scores using the 1000 Genomes European reference panel, allowing us to determine heritability enrichment in the cell types independent of the baseline annotations. S-LDSC was then run 32 times for each FFM trait (baseline-only and baseline plus each of the 31 supercluster annotations).
For the meta-traits, stratified Genomic SEM (Grotzinger et al., Reference Grotzinger, Mallard, Akingbuwa, Ip, Adams, Lewis, McIntosh, Grove, Dalsgaard, Strom, Meier, Mattheisen, Børglum, Mors, Breen, Lee, Kendler, Smoller, Tucker-Drob and Lesch2022b) (a multivariate extension of S-LDSC) was used across the same annotations used for the FFM traits. All continuous annotations from baselineLD v2.2 and any annotations that produced warnings for negative residual variances in our stratified Genomic SEM analyses were excluded from interpretation. A Benjamini–Hochberg correction for multiple testing was used for all enrichment analyses.
Transcriptome-wide association study
FUSION (Gusev et al., Reference Gusev, Ko, Shi, Bhatia, Chung, Penninx, Jansen, de Geus, Boomsma, Wright, Sullivan, Nikkola, Alvarez, Civelek, Lusis, Lehtimäki, Raitoharju, Kähönen, Seppälä and Pasaniuc2016) was used to conduct TWAS for the FFM traits, and T-SEM (Grotzinger et al., Reference Grotzinger, de la Fuente, Davies, Nivard and Tucker-Drob2022a) (a multivariate extension of FUSION) was used for the meta-traits. We used the precomputed GTEx-V8 (Consortium et al., Reference Aguet, Anand, Ardlie, Gabriel, Getz, Stricker, Alperovich, Segrè, Garrido-Martín, Park, Flutre, Gillard, Zhou, Overbey, Rush, Carter, Weber, Juster and Volpi2020) expression weight panels for the 13 available brain tissues and whole blood. These models are pre-filtered to retain nominally significant genes (P < 0.05) that show significant out-of-sample prediction (R 2 > 0.01). A strict Bonferroni correction (P < 0.05/number of successfully tested gene models) for multiple testing was used in addition to a more permissive Benjamini–Hochberg FDR correction for suggestive gene–trait associations. T-SEM also computes a heterogeneity metric analogous to QSNP (Q-trait). For the meta-traits, a Bonferroni-corrected Q-trait P-value <0.05 was used to identify heterogeneous gene–trait associations, which were then removed before interpretation. Gene-tissue models, which had <50% SNP overlap with our GWAS summary statistics, were excluded by FUSION’s default QC thresholds to prevent unreliable imputation and minimize false-positive associations. Of the 65,417 gene-tissue models tested for each trait, 30,601 for agreeableness and conscientiousness, 30,596 for extraversion, 31,058 for openness, and 31,257 for inverted neuroticism passed QC.
Mendelian randomization analyses
To investigate the directional relationship between personality traits and psychiatric conditions, we used the Bayesian MR method CAUSE (Morrison et al., Reference Morrison, Knoblauch, Marcus, Stephens and He2020), which allows comparison of null, sharing, and causal models. This is essential in the context of personality traits and psychiatric conditions, where the boundaries between these traits are unclear. We conducted bidirectional MR for each personality trait–psychiatric condition pair that showed significant genetic overlap in our genetic correlation analyses. CAUSE nuisance parameters were computed using 1 million random variants for each personality trait-psychiatric condition pair. Instruments for the exposure traits were obtained using clumping in PLINK (Purcell et al., Reference Purcell, Neale, Todd-Brown, Thomas, Ferreira, Bender, Maller, Sklar, de Bakker, Daly and Sham2007) with an LD r 2 threshold of <0.01 and a significance threshold of P < 0.001, using the 1000 Genomes European reference panel. The default CAUSE priors were used for all analyses. For stability and plasticity, QSNP significant loci were removed from the GWAS summary statistics before running CAUSE to ensure that only variants having their effect mediated by the meta-traits contributed to causal estimation (see above under multivariate GWAS of the meta-traits for details about Q-SNP clumping). We used a Benjamini–Hochberg correction for multiple testing across all CAUSE analyses. We also considered nominally significant (CAUSE P < 0.05) results as being suggestive of a causal relationship.
We also used the TwoSampleMR R package to conduct sensitivity analyses for any significant CAUSE results using the inverse variance weighted (IVW), MR Egger, weighted median, and, for PTSD, which only had one instrument, Wald ratio estimators (Hemani et al., Reference Hemani, Zheng, Elsworth, Wade, Haberland, Baird, Laurin, Burgess, Bowden, Langdon, Tan, Yarmolinsky, Shihab, Timpson, Evans, Relton, Martin, Davey Smith, Gaunt and Haycock2018). These methods are less robust to shared pleiotropy than CAUSE and hence should be interpreted cautiously. Independent instruments for our sensitivity analyses were selected using genome-wide significance (P < 5e−8) and an r 2 threshold of <0.001 within 10 Mb.
Results
GWAS meta-analyses of FFM personality traits
The full results for our GWAS meta-analyses are presented in the Supplementary Note. A summary of genome-wide significant loci and mapped genes for each FFM trait can be found in Supplementary Tables S1–S5. Summary statistics for the top 10,000 SNPs for each FFM trait can be found in Supplementary Tables S6–S10.
Genetic architecture of the FFM meta-traits
To investigate whether there is a genetic basis for the FFM meta-traits stability and plasticity (DeYoung, Reference DeYoung2006; Digman, Reference Digman1997), we first used LDSC regression (Bulik-Sullivan et al., Reference Bulik-Sullivan, Loh, Finucane, Ripke, Yang, Patterson, Daly, Price and Neale2015) to estimate genetic correlations between the FFM personality traits (Figure 1a). For ease of interpretation, the effect estimate column for neuroticism was multiplied by −1 to produce inverted neuroticism, which is used throughout subsequent analyses (we note that emotional stability is the commonly used term for low neuroticism; however, to avoid confusion with the meta-trait stability, we have used the term inverted neuroticism throughout the present work). The largest genetic correlations observed were between extraversion and openness (0.39), followed by agreeableness and inverted neuroticism (0.33).
We next conducted EFA on the genetic covariance matrix of the FFM traits. The EFA supported a 2-factor solution, which was consistent with the FFM meta-traits across odd, even, and full partitions of the genome. The first factor, interpreted as stability, was primarily characterized by loadings from agreeableness (0.64), inverted neuroticism (0.46), and conscientiousness (0.35). The second factor, interpreted as plasticity, was primarily characterized by loadings from openness (0.99) and extraversion (0.43). This pattern of loadings for stability was weaker than what is typically observed at the phenotypic level (Digman, Reference Digman1997); however, the general pattern was still observed. Full results from the EFA are presented in Supplementary Table S11.
This two-factor solution was carried forward for confirmatory factor analysis (CFA) using Genomic SEM (Grotzinger et al., Reference Grotzinger, Rhemtulla, de Vlaming, Ritchie, Mallard, Hill, Ip, Marioni, McIntosh, Deary, Koellinger, Harden, Nivard and Tucker-Drob2019). We also tested a one-factor model to investigate evidence for a general genetic factor of personality (Musek, Reference Musek2007); however, this model indicated poor fit to the data (AIC = 144.89, CFI = 0.67, SRMR = 0.093). The initial two-factor CFA indicated good fit (AIC = 51.7, CFI = 0.92, SRMR = 0.037). However, parameter estimates for extraversion were out of bounds (Heywood case), reflecting the fact that the plasticity factor was defined by only two indicators. Latent factors with only two indicators are not fully identified and therefore require additional constraints, a known limitation of identifying the meta-trait plasticity (DeYoung et al., Reference DeYoung, Tai, Chou and Mlačić2026). To address this issue, we tested a series of alternative constrained CFA models (Supplementary Table S12). The best-fitting model constrained the residual variances of extraversion and openness to equality, which successfully identified the plasticity factor (Figure 1b). This model displayed adequate fit (AIC = 75.44, CFI = 0.86, SRMR = 0.056), with fit metrics and loading estimates being largely consistent across both odd and even chromosomes (CFA of odd and even partitions are presented in the Supplementary Note). Hence, this model was retained for all subsequent analyses.
We next conducted a GWAS of the FFM meta-traits to capture genetic loci having shared effects across the FFM personality traits by estimating SNP effects on the latent factors of stability and plasticity in Genomic SEM (Grotzinger et al., Reference Grotzinger, Rhemtulla, de Vlaming, Ritchie, Mallard, Hill, Ip, Marioni, McIntosh, Deary, Koellinger, Harden, Nivard and Tucker-Drob2019). For stability, we identified 83 independent genome-wide significant loci, 14 of which were not identified in our univariate FFM trait GWAS (Figure 1c). Interestingly, one novel locus for stability was mapped to NTRK2 (chromosome 9, position = 87585184–87664625, rs2378676), which encodes the BDNF receptor TrkB, implicated in antidepressant action and synaptic plasticity (Enkavi et al., Reference Enkavi, Girych, Moliner, Vattulainen and Castrén2024). We also identified 51 lead QSNPs for stability, 10 of which positionally overlapped genome-wide significant loci, suggesting these loci have heterogeneous effects across the stability indicators. Further inspection revealed that all 10 of these loci were also significant hits for neuroticism, suggesting these genetic loci may be better explained as having neuroticism-specific effects. For plasticity, we identified 13 independent genome-wide significant loci, 4 of which were not present in our original FFM trait GWAS (Figure 1d). Notably, one of the novel loci for plasticity (chromosome 11, position = 27541623–27742447, rs7103411) was mapped to BDNF, a key regulator of synaptic plasticity implicated in learning and memory (Wang, Kavalali, & Monteggia, Reference Wang, Kavalali and Monteggia2022). We also identified seven lead QSNPs for plasticity, none of which overlapped with genome-wide significant signals. For stability, the GWAS association signal (mean
$ {\chi}^2 $
 [1] = 1.54) was greater than the QSNP signal (mean QSNP
$ {\chi}^2 $
 [1] = 1.37); however, inflation was observed for both. A similar pattern was observed for plasticity (mean GWAS
$ {\chi}^2 $
 [1] = 1.23; mean QSNP
$ {\chi}^2 $
 [1] = 1.14), suggesting our genetic meta-traits are capturing genuine shared architecture, with FFM trait-specific effects also being present (Clapp Sullivan et al., Reference Clapp Sullivan, Schwaba, Harden, Grotzinger, Nivard and Tucker-Drob2024). This is consistent with the meta-traits being modest factors that capture moderate shared variance between the FFM personality traits, with each FFM trait having a substantial amount of unique variance (DeYoung et al., Reference DeYoung, Tai, Chou and Mlačić2026). With the caveat that our model fit was only adequate, overall, our results support two genetic meta-traits consistent with stability and plasticity, which capture the modest shared genetic variance between the FFM traits.
We then compared our significant meta-trait loci to lead SNPs from the recent large reGPC GWAS (Schwaba et al., Reference Schwaba, Clapp Sullivan, Akingbuwa, Ilves, Tanksley, Williams, Giannelis, de Vlaming, Mõttus, Realo, Allik, van der Sluis, Nivard, Bartels, Boomsma, Cath, de Geus, Grotzinger, Harden and Tucker-Drob2025) to highlight loci from this work which may potentially be acting through the meta-traits. Of the 83 genome-wide significant loci identified for stability, 53 were significant for 1 trait, 10 for 2 traits, 7 for 3 traits, and 3 for 4 traits in the reGPC GWAS, with 10 of our stability loci representing novel loci not identified in this work. For plasticity, six loci were identified for one trait, five for two traits, and one for three traits, with one novel locus not identified in the reGPC GWAS. A summary of all genome-wide significant loci for stability and plasticity with QSNP and reGPC comparisons can be found in Supplementary Tables S13 and S14. The top 10,000 SNPs for the meta-traits can be found in Supplementary Tables S15 and S16. Lead QSNPs and their LD partners are presented in Supplementary Tables S17 and S18.
Cell-type enrichment
To investigate whether the genetic signal from our FFM personality trait GWASs was enriched in specific brain cell types, we used stratified LD score regression (S-LDSC) and estimated SNP-heritability enrichment for the baselineLD v2.2 and Yao et al. (Reference Yao, Harder, Darki, Chang, Li, Nikouei, Volpe, Lundström, Zeng, Wray, Lu, Sullivan and Hjerling-Leffler2025) annotations. For the FFM meta-traits, we used stratified Genomic SEM (Grotzinger et al., Reference Grotzinger, Mallard, Akingbuwa, Ip, Adams, Lewis, McIntosh, Grove, Dalsgaard, Strom, Meier, Mattheisen, Børglum, Mors, Breen, Lee, Kendler, Smoller, Tucker-Drob and Lesch2022b) to investigate SNP heritability enrichment across these same annotations for stability and plasticity. Full results from the S-LDSC and stratified Genomic SEM analyses are presented in Supplementary Tables S19–S25.
Overall, the FFM personality traits primarily show enrichment across both cortical and subcortical neurons, while glial and support cells do not show enrichment despite a few exceptions (Figure 2). Agreeableness showed enrichment in fewer cell types than the other FFM traits, likely due to the agreeableness GWAS having fewer genome-wide significant loci. Despite this, the broader pattern of enrichment for the FFM traits suggests a brain-wide genetic contribution to personality and implicates cortical and subcortical neurons as being principally relevant for personality traits.
Bubble plot heatmap showing −log10 enrichment P-values across 31 brain cell types for each of the Five-Factor Model personality traits. Note: The groupings of the superclusters from Siletti et al. (cortical, subcortical, and others) were used to assist interpretation. Colored/shaded dots represent enrichments that had FDRBH < 0.05. None of the cell-type annotations had FDRBH < 0.05 for stability or plasticity and, hence, were omitted from the plot.

Figure 2. Long description
The Y-axis lists 31 brain cell types organized into five hierarchical superclusters: Cortical Neurones, Sub-Cortical Neurones, Other Neurones, Glial Cells, and Support Cells. The X-axis lists five personality traits: Agreeableness, Conscientiousness, Extraversion, Inv-Neuroticism, and Openness.
Data is represented by colored bubbles where size and color indicate the minus log 10 P-value. A legend on the right shows a gradient from yellow (value of 2) to red (value of 8).
Key observations include:
* Cortical Neurones: Show high enrichment across all traits, particularly Inv-Neuroticism, which features the largest red bubble for Deep layer intratelencephalic cells.
* Sub-Cortical Neurones: Display significant enrichment for Conscientiousness, Extraversion, and Inv-Neuroticism, with Thalamic excitatory and Amygdala excitatory cells showing prominent yellow-to-orange bubbles.
* Other Neurones: The Miscellaneous category shows moderate enrichment across the first four traits.
* Glial Cells: Microglia and Oligodendrocyte precursors show enrichment specifically for Inv-Neuroticism. Bergmann glia and Astrocytes show enrichment for Conscientiousness.
* Support Cells: Fibroblasts show enrichment for Agreeableness and Extraversion, while Vascular cells are enriched for Inv-Neuroticism.
* Openness: This trait shows the least overall enrichment, with small yellow bubbles primarily in the Cortical and Sub-Cortical Neurone clusters.
For both meta-traits, no brain cell annotations displayed significant enrichment in the stratified Genomic SEM analyses after FDR correction. Several of the baseline annotations also produced warnings about negative residual variances, suggesting that our FFM trait GWASs are currently underpowered for stratified Genomic SEM. For stability, the only significantly enriched annotation was for highly conserved regions of the genome (Genomic Evolutionary Rate Profiling [GERP.RSsup4], FDRBH = 0.02), which are thought to be under strong negative selection and integral to the overall functioning of an organism. Interestingly, conserved regions have also been shown to be enriched for general psychopathology (Grotzinger et al., Reference Grotzinger, Mallard, Akingbuwa, Ip, Adams, Lewis, McIntosh, Grove, Dalsgaard, Strom, Meier, Mattheisen, Børglum, Mors, Breen, Lee, Kendler, Smoller, Tucker-Drob and Lesch2022b), suggesting a potential genetic pathway linking trait stability and general psychopathology risk. No annotations were significant for plasticity after FDR correction.
Transcriptome-wide association study
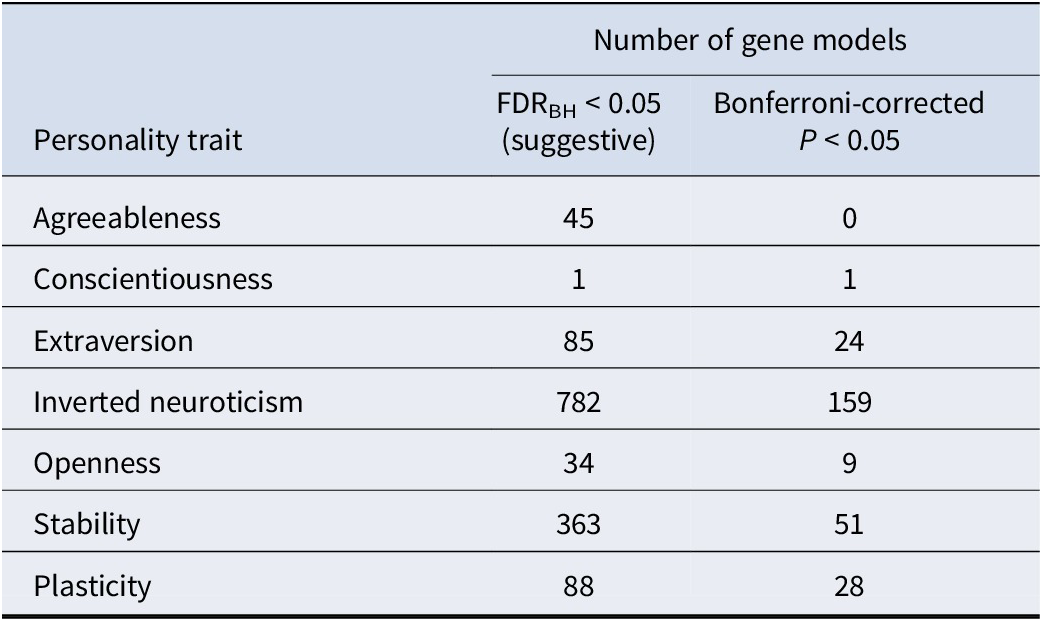
To identify potential effector gene candidates, we used the summary statistics generated from our FFM GWAS to conduct a TWAS in the 13 available brain tissues and whole blood from GTEx v8 (Consortium et al., Reference Aguet, Anand, Ardlie, Gabriel, Getz, Stricker, Alperovich, Segrè, Garrido-Martín, Park, Flutre, Gillard, Zhou, Overbey, Rush, Carter, Weber, Juster and Volpi2020) using FUSION (Gusev et al., Reference Gusev, Ko, Shi, Bhatia, Chung, Penninx, Jansen, de Geus, Boomsma, Wright, Sullivan, Nikkola, Alvarez, Civelek, Lusis, Lehtimäki, Raitoharju, Kähönen, Seppälä and Pasaniuc2016). We then used these results to conduct a TWAS of the FFM meta-traits using T-SEM (Grotzinger et al., Reference Grotzinger, Mallard, Akingbuwa, Ip, Adams, Lewis, McIntosh, Grove, Dalsgaard, Strom, Meier, Mattheisen, Børglum, Mors, Breen, Lee, Kendler, Smoller, Tucker-Drob and Lesch2022b). A summary of gene–trait associations is presented in Table 1. Suggestive gene–trait associations broken down by tissue are presented in Figure 3a, and a summary of all TWAS hits is presented in Supplementary Tables S26–S32. Full TWAS results are presented in Supplementary Tables S33–S39.
Summary of significant and suggestive gene–trait associations across transcriptome-wide association analyses for the five-factor model personality traits and meta-traits

Table 1. Long description
The table consists of three columns: Personality trait, F D R sub B H less than 0.05 (suggestive), and Bonferroni-corrected P less than 0.05. The data rows are as follows:
* Agreeableness: 45 suggestive, 0 Bonferroni-corrected.
* Conscientiousness: 1 suggestive, 1 Bonferroni-corrected.
* Extraversion: 85 suggestive, 24 Bonferroni-corrected.
* Inverted neuroticism: 782 suggestive, 159 Bonferroni-corrected.
* Openness: 34 suggestive, 9 Bonferroni-corrected.
* Stability: 363 suggestive, 51 Bonferroni-corrected.
* Plasticity: 88 suggestive, 28 Bonferroni-corrected.
A note at the bottom states that counts correspond to gene-trait associations which were significant or suggestive in at least 1 of the 14 sub-tissues tested.
Note: Counts correspond to gene–trait associations which were significant/suggestive in at least 1 of the 14 sub-tissues tested.
(a) Bar chart of the number of suggestive gene–trait associations from our transcriptome-wide analyses in each of the GTEx v8 sub-tissues tested for the Five-Factor Model personality traits/meta-traits. (b, c) Scatterplots of gene–trait association Z-scores for the meta-traits stability and plasticity. Labels correspond to the strongest gene–trait association observed. Dashed lines correspond to the suggestive FDRBH < 0.05 threshold for each meta-trait. Note: agree, ‘agreeableness’; consc, ‘conscientiousness’; extra, ‘extraversion’; invneuro, ‘inverted neuroticism’; openn, ‘openness’; ACC, ‘anterior cingulate cortex’.

Figure 3. Long description
Panel A is a bar chart titled T W A S hits on the y-axis, ranging from 0 to 200. The x-axis lists seven categories: agree, consc, extra, invneuro, openn, plasticity, and stability. Each category contains a cluster of colored bars representing 14 brain tissues, including A C C, Amygdala, Blood, and various cortex regions. The invneuro category shows the highest number of hits, peaking over 200 for the Caudate and Cerebellar Hemisphere. The consc category shows nearly zero hits across all tissues.
Panel B is a scatterplot for Stability. The y-axis is T W A S Z score from minus 10 to 10, and the x-axis is Chromosome from 1 to 22. Data points are clustered around the zero line in alternating gray and black bands. Red dots indicate significant associations beyond dashed horizontal lines at Z scores of approximately plus or minus 3. A prominent outlier on chromosome 17 is labeled L R R C 3 7 A 2 with a Z score near minus 9.
Panel C is a scatterplot for Plasticity with the same axes as Panel B. Significant red data points are less frequent than in Panel B, with a notable cluster on chromosome 17. An outlier on chromosome 11 is labeled E N S G 0 0 0 0 0 2 5 4 1 0 with a Z score near minus 6.
Except for conscientiousness, for which the only significant gene–trait association was PLCH1 in the hypothalamus, significant/suggestive gene–trait associations were present throughout all brain tissues tested for the FFM traits/meta-traits (Figure 3a). Although a TWAS can only identify potential effector gene candidates, notably, the strongest signal for plasticity was ENSG00000254510 in the nucleus accumbens (Figure 3b), a long noncoding RNA located ~4,000 bp upstream of NPAS4, an activity-dependent transcription factor involved in synaptic plasticity (Fu, Guo, Zhen, & Zhen, Reference Fu, Guo, Zhen and Zhen2020). The nucleus accumbens is also part of the mesolimbic dopamine pathway, which has been theorized to contribute to the meta-trait plasticity (Colin G DeYoung, Reference DeYoung2015). The strongest signal for stability was LRRC37A2 (Figure 3c), which has been suggested to play a role in fetal brain development (Giannuzzi et al., Reference Giannuzzi, Siswara, Malig, Bekpen, Marques-Bonet, Mullikin, Ventura and Eichler2013) and has previously been implicated in other cognitive traits and neurological conditions (Liu et al., Reference Liu, Wang, Zhang, Dong, Wang, Chen, Qian, Zhang, Wang, Zhao, Zhang, Lei, Wang, Zhao and Liu2024; Tian et al., Reference Tian, Ma, Li, Zeng, Zhou, Wang, Shan, Xu, Xiong and Cheng2023).
Genetic correlations between FFM personality traits and psychiatric conditions
We then sought to investigate the genetic overlap between the FFM personality traits and 11 different psychiatric conditions (Arnold et al., Reference Arnold, Askland, Barlassina, Bellodi, Bienvenu, Black, Bloch, Brentani, Burton, Camarena, Cappi, Cath, Cavallini, Conti, Cook, Coric, Cullen, Cusi and Davis2018; Demontis et al., Reference Demontis, Walters, Athanasiadis, Walters, Therrien, Nielsen, Farajzadeh, Voloudakis, Bendl, Zeng, Zhang, Grove, Als, Duan, Satterstrom, Bybjerg-Grauholm, Bækved-Hansen, Gudmundsson, Magnusson and Børglum2023; Friligkou et al., Reference Friligkou, Løkhammer, Cabrera-Mendoza, Shen, He, Deiana, Zanoaga, Asgel, Pilcher, di Lascio, Makharashvili, Koller, Tylee, Pathak and Polimanti2024; Grove et al., Reference Grove, Ripke, Als, Mattheisen, Walters, Won, Pallesen, Agerbo, Nærland, Palmer, Palotie, Pedersen, Stefansson, Geschwind, Nordentoft, Hougaard, Werge, Mortensen and Anney2019; Howard et al., Reference Howard, Adams, Clarke, Hafferty, Gibson, Shirali, Coleman, Ward, Wigmore, Alloza, Shen, Barbu, Xu, Whalley, Marioni, Porteous, Davies, Deary, Hemani and Wigmore2019; Nievergelt et al., Reference Nievergelt, Maihofer, Klengel, Atkinson, Chen, Choi, Coleman, Dalvie, Duncan, Gelernter, Levey, Logue, Polimanti, Provost, Ratanatharathorn, Stein, Torres, Aiello, Almli and Koenen2019; O’Connell et al., Reference O’Connell, Koromina, van der Veen, Boltz, David, Yang, Lin, Wang, Coleman, Mitchell, McGrouther, Rangan, Lind, Elise, Harder, Parker, Bendl, Adorjan and Agerbo2025; Trubetskoy et al., Reference Trubetskoy, Pardiñas, Qi, Panagiotaropoulou, Awasthi, Bigdeli, Bryois, Chen, Dennison, Hall, Lam, Watanabe, Frei, Ge, Harwood, Koopmans, Magnusson, Richards, Sidorenko and Hall2022; Walters et al., Reference Walters, Polimanti, Johnson, McClintick, Adams, Adkins, Aliev, Bacanu, Batzler, Bertelsen, Biernacka, Bigdeli, Chen, Clarke, Chou, Degenhardt, Edenberg, Elson and Erickson2018; Watson et al., Reference Watson, Yilmaz, Thornton, Hübel, Coleman, Gaspar, Bryois, Hinney, Leppä, Mattheisen, Medland, Ripke, Yao, Giusti-Rodríguez, Hanscombe, Purves, Adan and Mattheisen2019b; Yu et al., Reference Yu, Sul, Tsetsos, Nawaz, Huang, Zelaya, Illmann, Osiecki, Darrow, Hirschtritt, Greenberg, Muller-Vahl, Stuhrmann, Dion, Rouleau, Aschauer, Stamenkovic, Sandor, Barr and Scharf2019) using LDSC regression (Bulik-Sullivan et al., Reference Bulik-Sullivan, Loh, Finucane, Ripke, Yang, Patterson, Daly, Price and Neale2015) (a summary of the psychiatric condition GWAS used in the genetic correlation analyses is presented in the Supplementary Note; full results from genetic correlation analyses are presented in Supplementary Tables S40 and S41). Genetic correlations for the FFM traits and meta-traits are visualized in Figure 4.
Bar chart of genetic correlations (rg) between the FFM personality traits/meta-traits and 11 psychiatric conditions. Note: * = significant at Bonferroni correction for 55 tests for the FFM traits (P < 0.0009) and 22 tests for the meta-traits (P < 0.0023). Error bars represent standard errors. ADHD, attention deficit hyperactivity disorder; ALCH, ‘problematic alcohol use’; AN, ‘anorexia nervosa’; ANX, ‘anxiety’; AUT, ‘autism spectrum disorder’; BIP, ‘bipolar disorder’; MDD, ‘major depressive disorder’; OCD, ‘obsessive compulsive disorder’; PTSD, ‘post-traumatic stress disorder’; SCZ, ‘schizophrenia’; TS, ‘Tourette syndrome’.

Figure 4. Long description
The y-axis represents genetic correlation r sub g ranging from negative 0.8 to 0.6. The x-axis lists eleven psychiatric conditions. A legend on the right identifies seven traits: Agreeableness (blue), Conscientiousness (green), Extraversion (orange), Inverted Neuroticism (purple), Openness (yellow), Stability (dark gray), and Plasticity (light gray). Asterisks indicate statistical significance.
* A D H D: Negative correlations for Agreeableness, Conscientiousness, Inverted Neuroticism, and Stability; positive for Extraversion and Plasticity.
* A L C H: Negative for Agreeableness, Conscientiousness, Inverted Neuroticism, and Stability; positive for Extraversion.
* A N: Negative for Agreeableness and Inverted Neuroticism; positive for Conscientiousness and Openness.
* A N X: Strong negative correlations for Inverted Neuroticism and Stability; positive for Openness and Plasticity.
* A U T: Negative for Agreeableness, Conscientiousness, and Stability; positive for Openness.
* B I P: Negative for Inverted Neuroticism and Stability; positive for Extraversion, Openness, and Plasticity.
* M D D: Strong negative correlations for Inverted Neuroticism and Stability; positive for Openness.
* O C D: Negative for Inverted Neuroticism and Stability; positive for Conscientiousness.
* P T S D: Strongest negative correlations for Inverted Neuroticism and Stability; positive for Openness.
* S C Z: Negative for Agreeableness, Inverted Neuroticism, and Stability; positive for Openness and Plasticity.
* T S: Negative for Inverted Neuroticism; positive for Conscientiousness.
As has been demonstrated previously, the FFM personality traits displayed considerable genetic overlap with psychiatric conditions (Schwaba et al., Reference Schwaba, Clapp Sullivan, Akingbuwa, Ilves, Tanksley, Williams, Giannelis, de Vlaming, Mõttus, Realo, Allik, van der Sluis, Nivard, Bartels, Boomsma, Cath, de Geus, Grotzinger, Harden and Tucker-Drob2025). Interestingly, all three traits that define stability (agreeableness, conscientiousness, and inverted neuroticism) largely show negative associations with the psychiatric conditions tested, suggesting that stability may be able to capture these shared associations. We next used Genomic SEM (Grotzinger et al., Reference Grotzinger, Rhemtulla, de Vlaming, Ritchie, Mallard, Hill, Ip, Marioni, McIntosh, Deary, Koellinger, Harden, Nivard and Tucker-Drob2019) to estimate the genetic overlap between the FFM meta-traits, which capture the shared genetic architecture of the FFM personality traits, and these same psychiatric conditions (Figure 4). As was suggested by the pattern of effects for the FFM traits, stability showed consistent negative associations with all psychiatric conditions besides TS. This pattern was most pronounced for the internalizing conditions (ANX, MDD, and PTSD). Plasticity, on the other hand, displayed moderate positive associations with both ADHD and BIP, and small positive associations with ANX and SCZ, but otherwise did not display genetic overlap with other psychiatric conditions.
Mendelian randomization analyses
To investigate genetic evidence for a directional relationship between FFM personality traits and psychiatric conditions, we next conducted bidirectional MR analyses for all personality traits and psychiatric conditions that had significant genetic overlap in our genetic correlation analyses. We used CAUSE (Morrison et al., Reference Morrison, Knoblauch, Marcus, Stephens and He2020), as this method specifically compares a causal model to a shared pleiotropy model, which is essential in the context of personality traits and psychiatric conditions where the boundaries between these traits are unclear (Monaghan & Bizumic, Reference Monaghan and Bizumic2023). All results with CAUSE P < 0.05 are presented in Table 2, and full results from all CAUSE analyses are presented in Supplementary Tables S42–S50. Forest plots summarizing reverse effect estimates for psychiatric conditions on personality traits are presented in the Supplementary Note.
Summary of CAUSE Mendelian randomization results between the five-factor model personality traits/meta-traits and psychiatric conditions

Table 2. Long description
The table is divided into two primary sections: Personality as exposure and Personality as outcome. Each section contains four columns: Delta E L P D, S E Delta E L P D, gamma (95% C I), and P (F D R B H adj P).
Key findings by personality trait:
* Agreeableness: Shows significant causal effects as an exposure for A D H D (gamma = -0.25), A N X (gamma = -0.11), and M D D (gamma = -0.16). As an outcome, it is significant for A N X (gamma = -0.34).
* Inverted neuroticism: Highly significant causal effects as an exposure for M D D (gamma = -0.71, P = 3.0e-43) and S C Z (gamma = -0.41). As an outcome, it is significant for A D H D, A N X, M D D, and S C Z.
* Openness: No significant causal effect as an exposure for S C Z; as an outcome, gamma is 0.03.
* Plasticity: No significant causal effect as an exposure for B I P; as an outcome, gamma is 0.12.
* Stability: Significant causal effects as an exposure for A D H D, A N, A N X, B I P, P T S D, and S C Z. As an outcome, it is highly significant for A N X (gamma = -1.95) and M D D (gamma = -1.01).
Negative Delta E L P D values throughout the table generally favor the causal model over the sharing model. Bolded P-values indicate significance after F D R correction.
Note: ADHD, attention deficit hyperactivity disorder; AN, anorexia nervosa; ANX, anxiety; BIP, bipolar disorder; MDD, major depressive disorder; PTSD, post-traumatic stress disorder; SCZ, schizophrenia. P-values correspond to comparison between shared and causal models.
a Causal model was not nominally significant (P > 0.05).
b Causal model was significant after FDR correction (FDRBH < 0.05). Parentheses in P column represent FDRBH corrected P-values. ΔELPD = difference in expected log predictive density between sharing and causal models; negative values favor the causal model. γ = estimated causal effect of the exposure on the outcome per unit increase in the exposure.
Agreeableness, inverted neuroticism, and the meta-trait stability all displayed genetic evidence for a negative effect on psychiatric conditions (visualized in Figure 5). Genetic propensity for high agreeableness was protective of ANX and MDD in addition to there being suggestive evidence for a protective effect on ADHD. There was also suggestive evidence of a reverse effect for ANX and MDD on agreeableness, with genetic risk for these psychiatric conditions being negatively associated with agreeableness.
(a) Scatter plots summarizing CAUSE models for agreeableness, inverted neuroticism, and stability as exposures and psychiatric conditions as outcomes. Each point represents a personality-psychiatric condition pair. The x-axis corresponds to the change in expected log pointwise posterior density (ΔELPD) between causal and shared pleiotropy models, with negative values indicating a causal model fits better than a sharing model and vice versa. −log10(CAUSE P) values are plotted on the y-axis. Black dots represent nominally significant results (CAUSE P < 0.05), and red dots/stars represent results with FDRBH < 0.05. (b) Forest plots showing effect estimates of agreeableness, inverted neuroticism, and stability on psychiatric conditions (posterior median γ ± 95% CI). (c) Bar charts summarizing CAUSE models for psychiatric traits as exposure and agreeableness, inverted neuroticism, and stability as outcomes. Again, the x-axis corresponds to the ΔELPD between causal and shared pleiotropy models. Note: Effect sizes are scaled to the exposure trait and indicate relative influence, not absolute magnitude. *CAUSE P < 0.05; **FDRBH < 0.05).

Figure 5. Long description
Panel A contains three scatter plots for Agreeableness, Inverted Neuroticism, and Stability as exposures. The x-axis is Delta E L P D from negative 7.5 to 0.0, and the y-axis is minus log 10 (C A U S E P) from 0 to 40. Data points are color-coded: grey for not significant, black for nominal significance (P less than 0.05), and red for F D R B H significance (P less than 0.05). Inverted Neuroticism shows a high outlier for M D D near y equals 40.
Panel B displays three forest plots for the same traits. The y-axis lists psychiatric conditions: A D H D, A L C H, A N, A N X, A U T, B I P, M D D, O C D, P T S D, S C Z, and T S. The x-axis shows Posterior Median gamma plus or minus 95 percent C I from negative 0.8 to 0.0. Most points for Inverted Neuroticism and Stability fall between negative 0.2 and negative 0.6, indicating negative causal effects.
Panel C is a horizontal bar chart where psychiatric conditions are exposures and personality traits are outcomes. The x-axis is Delta E L P D from negative 7.5 to 0.0. Bars are grouped by condition and colored blue for Agreeableness, green for Inverted Neuroticism, and red for Stability. Significant negative Delta E L P D values are prominent for A N X, M D D, and S C Z across all three personality traits, marked with double asterisks for F D R B H significance.
For inverted neuroticism, evidence of a negative effect was observed for ADHD, BIP, MDD, PTSD, and SCZ. Interestingly, the causal model was not preferred over the shared model for ANX (CAUSE P = 0.12), suggesting shared pleiotropy accounts for much of the relationship between inverted neuroticism and ANX (Figure 5a). In the reverse direction, ADHD, ANX, MDD, and SCZ displayed a negative effect on inverted neuroticism (i.e. increased neuroticism), with there being suggestive evidence for AN and BIP as well (Figure 5c).
Higher genetic liability for the meta-trait stability was negatively associated with multiple psychiatric conditions (ADHD, AN, ANX, BIP, PTSD, and SCZ); however, there was only suggestive evidence of a protective effect of stability on MDD (CAUSE P = 0.015; FDRBH = 0.059) (Figure 5b). Again, in the reverse direction, ANX, MDD, and SCZ displayed evidence of a negative effect on stability, with suggestive effects also being observed for ADHD, AN, and BIP (Figure 5c).
Sensitivity MR analyses using IVW, weighted median, and MR-Egger estimators broadly supported the patterns observed in the primary CAUSE analyses for both inverted neuroticism and stability, with consistent bidirectional negative effects with psychiatric conditions being observed for the IVW and weighted median estimators for most conditions. However, these sensitivity analyses should be interpreted cautiously given the substantial conceptual and genetic overlap between personality traits and psychiatric conditions, as well as the differing assumptions and limitations of the individual MR estimators. Sensitivity analyses for agreeableness, however, were largely uninformative due to the limited number of genome-wide significant instruments for agreeableness (n = 3). Full results from our sensitivity analyses are presented in Supplementary Table S51.
Overall, both inverted neuroticism and the meta-trait stability show genetic evidence for protective effects across many psychiatric conditions, with a higher genetic propensity for these traits being negatively associated with psychopathology. There is also substantial evidence that psychiatric conditions exert negative effects on these personality traits, suggesting complex bidirectional pathways linking emotional stability and psychiatric conditions. This is as expected given the substantial conceptual overlap between personality traits and psychiatric liability. Apart from suggestive positive effects of schizophrenia on openness and bipolar disorder on plasticity, there was no evidence for any other directional relationships for conscientiousness, extraversion, openness, and plasticity, suggesting that genetic liability for these traits plays a limited role in psychiatric risk.
Discussion
In the present study, we integrated large-scale GWAS meta-analyses with multivariate modeling to test whether the FFM meta-traits stability and plasticity reflect genetically coherent dimensions of personality. With the caveat that our final model only displayed adequate fit, our results indicated that the genetic covariance between the FFM traits was best captured by two latent genetic factors corresponding to stability (agreeableness, conscientiousness, and inverted neuroticism) and plasticity (extraversion and openness), whereas a single general factor of personality model fit poorly. Consistent with recent phenotypic work, we found the genetic meta-traits to be modest factors that capture the moderate shared genetic variance between the FFM traits, with a substantial amount of unique variance still being present at the FFM trait level (Colin G DeYoung et al., Reference DeYoung, Tai, Chou and Mlačić2026). Comparison between GWAS association
$ {\chi}^2 $
 [1] and QSNP
$ {\chi}^2 $
 [1] for the meta-traits, as outlined in Clapp Sullivan et al. (Reference Clapp Sullivan, Schwaba, Harden, Grotzinger, Nivard and Tucker-Drob2024), provided further support for this interpretation. Although GWAS
$ {\chi}^2 $
 [1] was greater than QSNP
$ {\chi}^2 $
 [1], inflation was observed for both, suggesting the genetic meta-traits capture genuine shared architecture while also flagging heterogeneous genetic effects better explained at the FFM level. Overall, these results are consistent with CB5T (Colin G DeYoung, Reference DeYoung2015), which posits a biological basis for the FFM meta-traits that reflect individual differences in goal-directed control and exploratory-mediated belief updating.
Within CB5T, the FFM meta-traits are conceptualized as high-level ‘control parameters’ governing how individuals identify goals, select strategies for achieving them, and track progress towards desired states (DeYoung, Reference DeYoung2015; Safron & DeYoung, Reference Safron, DeYoung, Wood, Read, Harms and Slaughter2021). In this framework, genetic variants associated with stability likely contribute to differences in individuals’ broad ability to maintain coherent goal-directed behavior, whereas variants associated with plasticity contribute to general tendencies toward novelty seeking, exploration, and goal updating. For stability, we identified 83 independent genome-wide loci, with 14 not identified in our univariate FFM GWAS. Seventy-three of these loci for stability were found to overlap with lead SNPs from the recent reGPC GWAS, with 20 identified across multiple FFM traits. A similar pattern was observed for plasticity, with 12 of the 13 genome-wide loci also being identified in Schwaba et al. (Reference Schwaba, Clapp Sullivan, Akingbuwa, Ilves, Tanksley, Williams, Giannelis, de Vlaming, Mõttus, Realo, Allik, van der Sluis, Nivard, Bartels, Boomsma, Cath, de Geus, Grotzinger, Harden and Tucker-Drob2025), 6 of which were identified for multiple FFM traits, suggesting that these genetic effects on personality may potentially be operating at the meta-trait level rather than the level of the FFM traits.
Results from our TWAS/T-SEM and cell-type enrichment analyses were consistent with diffuse genetic effects on personality from across both cortical and subcortical brain regions. Consistent with findings on other brain traits (Yao et al., Reference Yao, Harder, Darki, Chang, Li, Nikouei, Volpe, Lundström, Zeng, Wray, Lu, Sullivan and Hjerling-Leffler2025), we found that neurons, and not glial or support cells, showed enriched SNP heritability for the FFM personality traits, with each FFM trait showing enrichment across multiple neuronal cell types. For the meta-traits, no cell-type enrichment was observed after multiple testing correction, likely indicating we were underpowered for stratified Genomic SEM, which is sensitive to low-powered traits and small annotations. There was also at least suggestive evidence for gene–trait associations across each of the brain tissues tested for all FFM traits/meta-traits, except conscientiousness. Interestingly, our top TWAS signal for plasticity was for a lncRNA located ~4 kb upstream of NPAS4 in the nucleus accumbens, a known regulator of synaptic plasticity in medium spiny neurons (Hughes et al., Reference Hughes, Huebschman, Tsvetkov, Siemsen, Snyder, Akiki, Wood, Penrod, Scofield, Berto, Taniguchi and Cowan2024). Although TWAS evidence can only be suggestive, given recent research demonstrating NPAS4 regulation by nearby lncRNAs (Akiki et al., Reference Akiki, Cornbrooks, Magami, Greige, Snyder, Wood, Herrington, Mace, Blidy, Koike, Berto, Cowan and Taniguchi2024) and the theorized role of mesolimbic dopamine circuitry in plasticity (Colin G DeYoung, Reference DeYoung2015), NPAS4 regulation in the nucleus accumbens may be a plausible candidate for future work attempting to elucidate the biological underpinnings of plasticity.
As has been documented previously (Gupta et al., Reference Gupta, Galimberti, Liu, Beck, Wingo, Wingo, Ashley-Koch, Aslan, Assimes, Aouizerat, Balkan, Beckham, Belanger, Bierut, Boundy, Brady, Bryant, Bustamante and Program2024; Lo et al., Reference Lo, Hinds, Tung, Franz, Fan, Wang, Smeland, Schork, Holland, Witoelar, Podgorny, Diallo, Dale, Djurovic, Andreassen and Chen2017; Schwaba et al., Reference Schwaba, Clapp Sullivan, Akingbuwa, Ilves, Tanksley, Williams, Giannelis, de Vlaming, Mõttus, Realo, Allik, van der Sluis, Nivard, Bartels, Boomsma, Cath, de Geus, Grotzinger, Harden and Tucker-Drob2025), genetic correlation analyses indicated substantial genetic overlap between the FFM personality traits and psychiatric conditions, particularly for agreeableness and inverted neuroticism. As was suggested by the pattern observed at the univariate level, the meta-trait stability, which captures the shared genetic effects across agreeableness, conscientiousness, and inverted neuroticism, also showed substantial genetic overlap with all psychiatric conditions tested, except for Tourette’s syndrome. Subsequent MR analyses indicated bidirectional effects between stability, neuroticism, and psychopathology, with genetic propensity for low neuroticism and high stability being broadly protective of psychopathology risk and increased genetic liability for psychopathology being associated with lower stability and higher neuroticism. This is consistent with dimensional approaches to psychopathology such as HiTOP, which consider personality traits as important factors contributing to psychiatric liability (DeYoung & Krueger, Reference DeYoung and Krueger2018; Kotov et al., Reference Kotov, Krueger, Watson, Achenbach, Althoff, Bagby, Brown, Carpenter, Caspi, Clark, Eaton, Forbes, Forbush, Goldberg, Hasin, Hyman, Ivanova, Lynam, Markon and Clark2017) and suggests complex bidirectional pathways linking emotional stability and psychiatric risk.
Given the rather undifferentiated genetic relationship observed between the meta-trait stability across multiple psychiatric conditions, it is likely that the meta-trait stability captures broad pathways that capture transdiagnostic psychiatric liability rather than specific pathways that would differentiate between psychiatric conditions. It has long been noted that emotional states are directly tied to the goal-related behavior of organisms, with negative affect reflecting impeded or impaired progress towards desired states (Damasio & Carvalho, Reference Damasio and Carvalho2013). One of the key components of general psychopathology (captured by the p-factor) is a general tendency towards negative emotionality (Caspi et al., Reference Caspi, Houts, Belsky, Goldman-Mellor, Harrington, Israel, Meier and Poulton2014; Grotzinger et al., Reference Grotzinger, Werme, Peyrot, Frei, de Leeuw, Bicks, Guo, Margolis, Coombes, Batzler, Pazdernik, Biernacka, Andreassen, Anttila, Børglum, Breen, Cai, Demontis, Edenberg and Smoller2025). Given that the meta-trait stability captures the robustness of systems supporting goal-directed behavior and emotional regulation, it is likely that genetic factors that lower stability may increase susceptibility to negative affect when goals are blocked, or the environment is uncertain. Conversely, excesses of negative affect which categorize psychopathology may impair the cognitive and motivational processes required for maintaining goal-directed behavior. The observed bidirectional links between stability and psychopathology may then reflect shared pathways in how individuals maintain long-term goal-directed behavior and manage affective responses to goal disruption (DeYoung & Krueger, Reference DeYoung and Krueger2018).
There are several limitations that need to be considered when interpreting the results of the present study. First, due to current data availability, the present study included only data from European ancestry, and so findings may not generalize to other ancestry groups. Different measures of the FFM personality traits were also used between cohorts, which may introduce measurement heterogeneity across instruments. It should also be noted that the BFI-10 used in the MVP cohort (which makes up much of our total sample size) includes ‘tends to find fault with others’ as one of its two agreeableness items, which may correlate more strongly with neuroticism compared to other measures. Second, although fit was comparable to other Genomic SEM (e.g. the p-factor model in the original genomic SEM paper [Grotzinger et al., Reference Grotzinger, Rhemtulla, de Vlaming, Ritchie, Mallard, Hill, Ip, Marioni, McIntosh, Deary, Koellinger, Harden, Nivard and Tucker-Drob2019]) our model fit was below the ideal good-fit thresholds (CFI > 0.90, SRMR <0.05). Despite boosting GWAS power for the FFM personality traits, our study was still likely underpowered for stratified Genomic SEM analyses. This was also likely for CAUSE analyses where there is only moderate genetic overlap between traits. Furthermore, although CAUSE accounts for shared pleiotropy, causal effect estimates may still be biased by horizontal pleiotropy, and residual pleiotropy may confound bidirectional effect estimates. Finally, we did not conduct any fine-mapping or colocalization analyses for GWAS or TWAS signals. Hence, the present work should be interpreted as a broad mapping of the genetic landscape of the FFM meta-traits, which highlights potential pathways for future follow-up work. The recent reGPC project (Schwaba et al., Reference Schwaba, Clapp Sullivan, Akingbuwa, Ilves, Tanksley, Williams, Giannelis, de Vlaming, Mõttus, Realo, Allik, van der Sluis, Nivard, Bartels, Boomsma, Cath, de Geus, Grotzinger, Harden and Tucker-Drob2025) has substantially increased the genetic discovery beyond both Gupta et al (Reference Gupta, Galimberti, Liu, Beck, Wingo, Wingo, Ashley-Koch, Aslan, Assimes, Aouizerat, Balkan, Beckham, Belanger, Bierut, Boundy, Brady, Bryant, Bustamante and Program2024) and the present work for the FFM traits, reporting GWAS meta-analyses including up to 1.2 million participants across multiple ancestries. Future work will seek to replicate our findings in this cohort once data becomes available, given the multiple ancestries and increased power it offers.
Here we leverage recent advances in GWAS of the FFM personality traits and multivariate statistical methods to perform a genomic investigation into the FFM meta-traits’ stability and plasticity. Using a variety of in silico methods, we highlight potential biological pathways underpinning personality traits and characterize the genetic relationship between personality traits and psychiatric conditions. These findings importantly contribute to our knowledge of the genetic architecture of personality, with genetic liability for lower stability potentially representing a broad transdiagnostic link between personality and psychiatric vulnerability.
Supplementary material
The supplementary material for this article can be found at http://doi.org/10.1017/S0033291726106308.
Data availability statement
23andMe Research Institute summary statistics are made available through 23andMe to qualified researchers under an agreement with 23andMe that protects the privacy of 23andMe participants. Please visit research.23andme.com/collaborate/#publication for more information. The top 10,000 SNPs for all our GWAS meta-analyses are provided in the Supplementary File. Information on where to download all other GWAS summary statistics/annotation files used in the present study is provided in the original publications.
Acknowledgments
The authors would like to thank the research participants and employees of 23andMe Research Institute for making this work possible. The authors also thank all the research groups whose data were used in our work for making their data/code publicly available (Arnold et al., Reference Arnold, Askland, Barlassina, Bellodi, Bienvenu, Black, Bloch, Brentani, Burton, Camarena, Cappi, Cath, Cavallini, Conti, Cook, Coric, Cullen, Cusi and Davis2018; Consortium et al., Reference Aguet, Anand, Ardlie, Gabriel, Getz, Stricker, Alperovich, Segrè, Garrido-Martín, Park, Flutre, Gillard, Zhou, Overbey, Rush, Carter, Weber, Juster and Volpi2020; Demontis et al., Reference Demontis, Walters, Athanasiadis, Walters, Therrien, Nielsen, Farajzadeh, Voloudakis, Bendl, Zeng, Zhang, Grove, Als, Duan, Satterstrom, Bybjerg-Grauholm, Bækved-Hansen, Gudmundsson, Magnusson and Børglum2023; Friligkou et al., Reference Friligkou, Løkhammer, Cabrera-Mendoza, Shen, He, Deiana, Zanoaga, Asgel, Pilcher, di Lascio, Makharashvili, Koller, Tylee, Pathak and Polimanti2024; Grove et al., Reference Grove, Ripke, Als, Mattheisen, Walters, Won, Pallesen, Agerbo, Nærland, Palmer, Palotie, Pedersen, Stefansson, Geschwind, Nordentoft, Hougaard, Werge, Mortensen and Anney2019; Gupta et al., Reference Gupta, Galimberti, Liu, Beck, Wingo, Wingo, Ashley-Koch, Aslan, Assimes, Aouizerat, Balkan, Beckham, Belanger, Bierut, Boundy, Brady, Bryant, Bustamante and Program2024; Howard et al., Reference Howard, Adams, Clarke, Hafferty, Gibson, Shirali, Coleman, Ward, Wigmore, Alloza, Shen, Barbu, Xu, Whalley, Marioni, Porteous, Davies, Deary, Hemani and Wigmore2019; Nievergelt et al., Reference Nievergelt, Maihofer, Klengel, Atkinson, Chen, Choi, Coleman, Dalvie, Duncan, Gelernter, Levey, Logue, Polimanti, Provost, Ratanatharathorn, Stein, Torres, Aiello, Almli and Koenen2019; O’Connell et al., Reference O’Connell, Koromina, van der Veen, Boltz, David, Yang, Lin, Wang, Coleman, Mitchell, McGrouther, Rangan, Lind, Elise, Harder, Parker, Bendl, Adorjan and Agerbo2025; Trubetskoy et al., Reference Trubetskoy, Pardiñas, Qi, Panagiotaropoulou, Awasthi, Bigdeli, Bryois, Chen, Dennison, Hall, Lam, Watanabe, Frei, Ge, Harwood, Koopmans, Magnusson, Richards, Sidorenko and Hall2022; Walters et al., Reference Walters, Polimanti, Johnson, McClintick, Adams, Adkins, Aliev, Bacanu, Batzler, Bertelsen, Biernacka, Bigdeli, Chen, Clarke, Chou, Degenhardt, Edenberg, Elson and Erickson2018; Watson et al., Reference Watson, Yilmaz, Thornton, Hübel, Coleman, Gaspar, Bryois, Hinney, Leppä, Mattheisen, Medland, Ripke, Yao, Giusti-Rodríguez, Hanscombe, Purves, Adan and Mattheisen2019b; Yao et al., Reference Yao, Harder, Darki, Chang, Li, Nikouei, Volpe, Lundström, Zeng, Wray, Lu, Sullivan and Hjerling-Leffler2025; Yu et al., Reference Yu, Sul, Tsetsos, Nawaz, Huang, Zelaya, Illmann, Osiecki, Darrow, Hirschtritt, Greenberg, Muller-Vahl, Stuhrmann, Dion, Rouleau, Aschauer, Stamenkovic, Sandor, Barr and Scharf2019). Without this, the current work would not have been possible.
Funding statement
L.V. was supported by an Australian Government Research Training Program (RTP) Scholarship doi.org/10.82133/C42F-K220. E.H. is funded by the National Health and Medical Research Council Leadership Investigator Award (GNT 2025349).
Competing interests
Members of the 23andMe Research Team are currently or were previously employed by the 23andMe Research Institute, a California nonprofit public benefit corporation. This research was conducted while 23andMe, Inc. operated as a for-profit entity. Members of the 23andMe Research Team may have held stock or stock options in 23andMe, Inc. during that period. There are no other conflicts of interest to report.
Ethical standards
The authors assert that all procedures contributing to this work comply with the ethical standards of the relevant national and institutional committees on human experimentation and with the Helsinki Declaration of 1975, as revised in 2008. The Human Research Ethics Committee of the University of South Australia (now Adelaide University) deemed the current project exempt from ethical approval (Application ID: 206516).




 Open access

