

1. Introduction
Understanding the origin and geodynamic significance of continental mafic magmas and the composition of their sources is one of the main goals of igneous petrology. In back-arc continental settings, the complex nature of subduction-related processes and the high number of geochemical reservoirs potentially involved in magma genesis and evolution make it difficult to meet these goals. Magmas erupted in continental back-arc regions may contain inputs from the sub- and supra-slab asthenosphere, the subducted oceanic lithosphere (melts/fluids from subducted igneous and sedimentary rocks), the subcontinental lithospheric mantle and the lower and upper continental crust. Over the last three decades, many studies have focused on one of the most important occurrences of mafic magmatism in continental back-arc settings, namely, the Cenozoic Patagonian Basaltic Province (e.g. Baker et al. Reference Baker, Rea, Skarmeta, Caminos and Rex1981; Stern et al. Reference Stern, Frey, Futa, Zartman, Peng and Kyser1990; Ramos & Kay, Reference Ramos and Kay1992; Gorring et al. Reference Gorring, Kay, Zeitler, Ramos, Rubiolo, Fernandez and Panza1997; D'Orazio et al. Reference D'Orazio, Innocenti, Manetti and Haller2004; Fig. 1). Throughout the Cenozoic, large volumes of alkaline and subalkaline basaltic lavas and subordinate amounts of more differentiated products erupted in extra-Andean Patagonia (Argentina and Chile), behind the Andean volcanic arc. Most published studies focus on the southernmost occurrences of this magmatism and emphasize the dominant role played in the petrogenesis of these basalts by ridge–trench collision and slab window opening under this sector of Patagonia (e.g. Ramos & Kay, Reference Ramos and Kay1992; Gorring et al. Reference Gorring, Kay, Zeitler, Ramos, Rubiolo, Fernandez and Panza1997; D'Orazio et al. Reference D'Orazio, Agostini, Mazzarini, Innocenti, Manetti, Haller and Lahsen2000, Reference D'Orazio, Agostini, Innocenti, Haller, Manetti and Mazzarini2001, Reference D'Orazio, Innocenti, Manetti, Haller, Vincenzo and Tonarini2005; Gorring & Kay, Reference Gorring and Kay2001; Gorring et al. Reference Gorring, Singer, Gowers and Kay2003; Espinoza et al. Reference Espinoza, Morata, Pelleter, Maury, Suárez, Lagabrielle, Polvé, Bellon, Cotten, Cruz and Guivel2005). More recently, mafic magmatic rocks from northern Patagonia (Meseta de Somuncura: de Ignacio et al. Reference de Ignacio, López, Oyarzun and Márquez2001; Kay et al. Reference Kay, Ardolino, Gorring and Ramos2007; Crater Basalt Volcanic Field: Massaferro et al. Reference Massaferro, Haller, D'Orazio and Alric2006; Neuquén Basin: Kay & Copeland, Reference Kay, Copeland, Kay and Ramos2006) have been investigated, and several hypotheses alternative to slab window opening have been proposed for their genesis.
Schematic geodynamic setting of southern South America and the adjacent Pacific Ocean. The sketch shows: the fracture zones of the oceanic Nazca and Antarctic plates (thin continuous lines), the Chile oceanic spreading ridge (grey strips), the Chile trench (heavy continuous line with triangles on the overriding plate), the transcurrent margin between the Scotia and South American plates (dashed line), the Chile Triple Junction, the main active volcanoes of the Southern South Volcanic Zone (SSVZ) and Austral Volcanic Zone (AVZ) of the Andes (black smoking triangles), the Cenozoic Patagonian lavas (black areas). The two large, black arrows are the convergence vectors of the Nazca and Antarctic plates with respect to South America according to the HS3-NUVEL-1A model (Gripp & Gordon, Reference Gripp and Gordon2002). Circled numbers indicate the main Patagonian basalt occurrences cited in the text: 1 – Pali Aike Volcanic Field (late Pliocene–Quaternary); 2 – Estancia Glencross area (late Miocene); 3 – Meseta de las Vizcachas (middle Miocene–late Pliocene); 4 – C. del Fraile (late Pliocene–Quaternary); 5 – Camusú Aike Volcanic Field (late Pliocene); 6 – Mesetas on the north side of the Río Santa Cruz valley (Laguna Amenida–Condor Cliff area; Miocene?–late Pliocene); 7 – Meseta del Viento (early Pliocene–late Pliocene); 8 – Meseta de la Muerte and Meseta Strobel (middle Miocene–early Pliocene); 9 – Meseta Central (late Miocene–late Pliocene); 10 – Mesetas of the Northeast region (Eocene–late Pliocene); 11 – Meseta Belgrano (late Miocene–late Pliocene); 12 – Meseta del Lago Buenos Aires and Meseta Chile Chico (Paleocene–Quaternary). The rectangle encloses the study area.

In this paper we report on the geochronology, petrography, geochemistry and Sr–Nd–Pb isotope composition of basaltic rocks exposed in a wide area of central Patagonia between the Patagonian Andes and Musters Lake (Chubut Province, Argentina; Fig. 1). The volcanic rocks found in this area were erupted over a time interval of about 35 Ma (from the late Eocene to the Pleistocene) and show wide chemical and isotopic variability. In addition, they were erupted just north of the vertical projection of the Neogene slab window thought to occur beneath southern Patagonia. Accordingly, the study of these rocks provides a good opportunity to better characterize the nature of Cenozoic basaltic magmatism in Patagonia and to test geodynamic models, alternative to the slab window model, for the genesis of basaltic magmas in the back-arc region of the Patagonian Andes.
2. Geological outline and geochronology
The study area (44.5–46° S, 69–71° W) is located in the back-arc region of the Patagonian Andes, in the central-western sector of the Golfo San Jorge Basin (Fig. 1). The latter is a dominantly extensional Mesozoic basin which trends east–west from the Andes to the Atlantic Ocean and is bounded to the north and south by the North Patagonian and Deseado massifs, respectively (Fitzgerald et al. Reference Fitzgerald, Mitchum, Uliana and Biddle1990; Sylwan, Reference Sylwan2001). These massifs represent part of a late Proterozoic–middle Palaeozoic orogenic belt that extended along the southwestern margin of Gondwana (Pankhurst et al. Reference Pankhurst, Rapela, Fanning and Márquez2006). At the latitude of the study area the Andes comprise, from west to east, the following main structural units: (1) a deformed Palaeozoic metamorphic basement (Coastal Cordillera) exposed in the Chonos Archipelago and in the Taitao Peninsula (Hervé et al. Reference Hervé, Davidson, Mpodozis and Covacevich1981); (2) an active Quaternary volcanic arc, in part related to the activity of the dextral strike-slip Liquiñe–Ofqui fault system (Cembrano, Hervé & Lavenu, Reference Cembrano, Hervé and Lavenu1996); (3) the Jurassic to Miocene calc-alkaline Patagonian Batholith and the Andean front.
A large portion of the study area is occupied by the Sierra de San Bernardo, a thick-skinned fold belt running approximately N–S (Fig. 2). The Sierra de San Bernardo predominantly consists of continental Cretaceous sedimentary rocks (Chubut Group; Fitzgerald et al. Reference Fitzgerald, Mitchum, Uliana and Biddle1990; Sylwan, Reference Sylwan2001; Hechem & Strelkov, Reference Hechem, Strelkov and Haller2002) and by Cenozoic (Priabonian to Pleistocene) igneous mafic rocks. During Tertiary times (probably Miocene: Chelotti, Reference Chelotti1997), these rocks were deformed and uplifted by compressional stresses that caused the tectonic inversion and reactivation of pre-existing Mesozoic normal faults (Homovc et al. Reference Homovc, Conforto, Lafourcade, Chelotti, Buchanan and Buchanan1995). The volcanic rocks of the Sierra de San Bernardo mainly occur as sequences of mafic lavas, sometimes forming plateaux, erupted from small and variably eroded volcanic cones. The lava flow sequences and sedimentary rocks are locally intruded by small stocks, sills, necks and dykes of olivine gabbro and microgabbro. The west side of the Sierra de San Bernardo abruptly ends in a wide plain which is crossed by the rivers Senguerr and Genoa. The boundary between Sierra de San Bernardo and the plain is marked by several well-preserved scoria cones aligned along a NNW–SSE trend (Fig. 2). These features are indicative of the possible extensional nature of the Genoa–Senguerr valley.
Geological sketch map of the study area, redrawn and largely simplified from Lizuain, Ragona & Folguera (Reference Lizuain, Ragona and Folguera1995).

Fourteen new K–Ar age determinations were made on lavas from the study area (Table 1). These ages significantly enlarge the existing dataset (Baker et al. Reference Baker, Rea, Skarmeta, Caminos and Rex1981; Marshall et al. Reference Marshall, Cifelli, Drake and Curtis1986), allowing the identification of three phases of volcanic activity separated by relatively long (10 and 15 Ma) intervals of time (Fig. 3): (1) late Eocene (Priabonian, c. 35 Ma); (2) late Oligocene–early Miocene (Chattian–Burdigalian, 25–18 Ma); (3) Plio-Pleistocene (Zanclean–Early Pleistocene, 3.8–1.5 Ma). A sample of a lava flow from the Cerro Grande scoria cone (PA-403; Fig. 2) was found to contain radiogenic 40Ar below the detection limit of the adopted method (Table 1). This may indicate the occurrence of volcanic activity younger than Early Pleistocene, as also suggested by the well-preserved morphology of the exposed surface of this flow.
K–Ar data

< d.l. – below detection limit.
Distribution of new and literature K–Ar ages for mafic lavas from the study area.

The Plio-Pleistocene lavas occurring at the top of Sierra de San Bernardo are undeformed and lie unconformably above the underlying formations (both sedimentary and igneous), whereas the older lavas are sometimes tilted and gently folded, indicating that they underwent the deformation processes responsible for the origin of the Sierra de San Bernardo fold belt. The scoria cones occurring along the eastern side of the Genoa–Senguerr valley, just above the westernmost formations of the Sierra de San Bernardo, formed during the Plio-Pleistocene. A ~ 150 km2 wide lava field (Meseta El Pedrero, 2.71 Ma) occurs in the central part of the valley (Quartino, Reference Quartino1958; Fig. 2), whereas scattered cones such as Cerro Ante (1.46 Ma; sampled for this study) and Cerro Gato (3.6 Ma; studied by Baker et al. Reference Baker, Rea, Skarmeta, Caminos and Rex1981) are located on the western side of the Genoa–Senguerr valley, above the easternmost slopes of the Patagonian Andes.
3. Petrography and classification
Volcanic rock samples represent lava flows and subordinate scoriae; they are fresh and only sporadically contain iddingsitic material partially replacing olivine. More weathered rocks containing secondary carbonates and zeolites were found in several localities of Sierra de San Bernardo and were discarded for this study. The studied samples are characterized by sub-aphyric to moderately porphyritic textures (porphyritic index = 5–20 vol. %) with small, sparsely distributed olivine (5–20 vol. %) and rare clinopyroxene (0–2 vol. %) phenocrysts set in a fine-grained to glassy groundmass. Olivine phenocrysts range from 0.5 to 1 mm in size, show euhedral shapes and, rarely, skeletal structures. Clinopyroxene phenocrysts generally occur in glomerophyric aggregates; they are euhedral, larger (1–2 mm) than olivine and light purple-brown coloured. The crystallinity of the groundmass is variable, ranging from glassy to holocrystalline. It consists of plagioclase, clinopyroxene ± olivine ± Fe–Ti oxides ± alkali feldspar ± glass.
Mantle xenoliths and xenocrysts are very commonly found within the lava flows and the cores of ovoidal and spindle-shaped pyroclastic bombs from the Cerro de los Chenques monogenetic cone (Fig. 2). Xenoliths may reach up to a decimetre in size; they are extremely fresh and are characterized by coarse- to medium-grained protogranular and/or tabular textures. Spinel-bearing dunite, lherzolite, harzburgite, websterite and composite websterite + lherzolite/harzburgite are the dominant lithologies (Rivalenti et al. Reference Rivalenti, Mazzucchelli, Laurora, Ciuffi, Zanetti, Vannucci and Cingolani2004, Reference Rivalenti, Mazzucchelli, Zanetti, Vannucci, Bollinger, Hémond and Bertotto2007).
Following the total alkali v. silica classification diagram (Fig. 4), the volcanic rocks from the study area are basanites, trachybasalts, alkaline and subalkaline basalts and basaltic andesites. Based on their degree of alkalinity, K2O/Na2O ratios and age, the studied Sierra de San Bernardo volcanic rocks were subdivided as follows: group Ia (basanites, alkali basalts, trachybasalts) includes late Eocene to early Miocene alkaline lavas; group Is (subalkaline basalts, basaltic andesites) includes early Miocene subalkaline lavas; group IINa (alkali basalts, trachybasalts) includes Plio-Pleistocene alkaline lavas with K2O/Na2O < 0.5; group IIK (basanites, trachybasalts) includes Plio-Pleistocene alkaline lavas with K2O/Na2O > 0.6. The Pleistocene basanites from Cerro Ante, by virtue of their peculiar chemistry (see Section 4), constitute a separate group.
Total alkali v. silica classification diagram for the studied rocks. Inset: K2O/Na2O v. K2O plot.

4. Geochemistry
Major- and trace-element analyses of representative samples from the study area are reported in Table 2. All the alkaline volcanic rocks are near primitive in composition, as indicated by their high Mg numbers (58–72) and high concentrations of MgO (6.8–12.9 wt %), Ni (110–375 ppm) and Cr (90–507 ppm). The basanite lavas from Cerro de los Chenques (samples PA-406–409 and PAT 70) are characterized by high MgO (> 10 wt %) and Ni (> 250 ppm) contents due to contamination by olivine and pyroxene xenocrysts from disaggregated mantle xenoliths (Fig. 5a). The subalkaline volcanic rocks show less primitive compositions, with Mg numbers between 56 and 59 and lower concentrations of MgO (6.1–7.5 wt %), Ni (122–162 ppm) and Cr (238–275 ppm). They show systematically higher Cr/Ni ratios with respect to the alkaline ones, but lower TiO2 and P2O5 contents (Fig. 5b). The basanite lavas from Cerro Ante are characterized by low TiO2 and Fe2O3 tot (Fig. 5b, c) and high CaO contents. The late Eocene lava samples have higher Fe2O3 tot contents with respect to the other alkaline lavas with the same Mg numbers (Fig. 5c).
Whole-rock major and trace element analyses

Abbreviations: Classif. – classification; BA – basaltic andesite; SB – subalkaline basalt; BN – basanite; AB – alkali basalt; HW – hawaiite; KTB – potassic trachybasalt; LOI – loss on ignition.
Binary plots illustrating some chemical features of Sierra de San Bernardo and Cerro Ante lavas (symbols as in Fig. 4). (a) Ni (ppm) v. MgO (wt %) plot showing the primitive nature of the studied samples; (b) P2O5 (wt %) v. TiO2 (wt %) plot showing the rough correlation of these elements in Sierra de San Bernardo lavas, and the very high P2O5/TiO2 of basanites from Cerro Ante; (c) Mg number v. Fe2O3 tot (wt %) plot showing the high and low total iron contents of group Ia and Cerro Ante lavas, respectively.

Incompatible element distributions are reported in the primordial mantle-normalized diagrams of Fig. 6. As observed for the majority of Cenozoic alkaline lavas from all of extra-Andean Patagonia (e.g. Stern et al. Reference Stern, Frey, Futa, Zartman, Peng and Kyser1990; Ramos & Kay, Reference Ramos and Kay1992; Gorring et al. Reference Gorring, Kay, Zeitler, Ramos, Rubiolo, Fernandez and Panza1997; D'Orazio et al. Reference D'Orazio, Agostini, Mazzarini, Innocenti, Manetti, Haller and Lahsen2000, Reference D'Orazio, Innocenti, Manetti and Haller2004; Guivel et al. Reference Guivel, Morata, Pelleter, Espinoza, Maury, Lagabrielle, Polvé, Bellon, Cotten, Benoit, Suárez and de la Cruz2006; Kay et al. Reference Kay, Ardolino, Gorring and Ramos2007), alkaline mafic rocks from Sierra de San Bernardo show a within-plate geochemical signature. They show the typical humped distributions, with Nb and Ta peaks and marked negative Pb anomalies (Fig. 6a, b). REE (rare earth elements) distributions (Fig. 7a, b) are remarkably similar: chondrite-normalized REE patterns are almost rectilinear and enriched in LREE (light REE) (LaN = 91–276, YbN = 7.9–12.2, (La/Yb)N = 9.7–30.6). Some samples display a slight positive Eu anomaly.
Primordial mantle-normalized incompatible element patterns. (a) Groups Ia and Is; (b) groups IINa, IIK and Cerro Ante. Normalizing values after McDonough & Sun (Reference McDonough and Sun1995).

CI chondrite-normalized REE patterns. (a) Groups Ia and Is; (b) groups IINa and IIK; (c) Cerro Ante. Normalizing values after McDonough & Sun (Reference McDonough and Sun1995).

The most remarkable differences among these alkaline groups are the relative enrichment of the most incompatible elements and the LREE/HREE (heavy REE) ratios, which increase from group Ia to IINa to IIK, and the systematic occurrence of negative K anomalies in Ia lavas (Fig. 6a).
The subalkaline basalts and basaltic andesites of group Is are characterized by different incompatible element distributions; they are less enriched and less fractionated and show a prominent positive Sr anomaly and a less marked positive Ba anomaly (Fig. 6a). Group Is lavas show less fractionated REE distributions (LaN = 30–50, YbN = 7.6–9.0, (La/Yb)N = 3.6–5.9; Fig. 7a), with LREE less fractionated than HREE ((La/Sm)N = 1.2–1.9, (Sm/Yb)N = 2.5–3.2), forming ‘kinked’ patterns. Samples PA-397 and PA-415 have a slight positive Eu anomaly.
Basanites from Cerro Ante have a completely different incompatible element distribution: the HFS (high field strength) elements Nb, Ta and Ti show marked negative anomalies, the LIL (large ion lithophile) elements Cs, Rb, Th, U and K are strongly enriched, and there is a prominent negative Ba anomaly (Fig. 6b). The concentrations of other elements are comparable to those in group IIK volcanics. The REE patterns (Fig. 7c) are characterized by moderate LREE/HREE fractionation ((La/Yb)N = 12.3–17.8) and by sigmoidal shapes, with concave-downward LREE and concave-upward HREE. The Pliocene basanite lava from Cerro Gato, analysed by Baker et al. (Reference Baker, Rea, Skarmeta, Caminos and Rex1981) and also located on the western side of the Genoa–Senguerr valley, has a whole-rock chemistry very similar to that of basanites from Cerro Ante.
5. Sr–Nd–Pb isotopes
Seventeen Sr–Nd and fifteen Pb isotope compositions were determined for the studied volcanic rocks (Table 3). Sr–Nd–Pb isotope variability is quite large, and comparable to that of the whole Patagonian Cenozoic magmatic province. Data show a variation in the Sr–Nd isotope composition over time, with a progressive increase in enriched components from the late Eocene to the Pleistocene (Fig. 8). The oldest lavas of group Ia (late Eocene) show the most depleted compositions (87Sr/86Sr = 0.70328–0.70349, 143Nd/144Nd = 0.51284–0.51287), close to the extreme values observed for Pali Aike and the Estancia Glencross area (~ 52° S; D'Orazio et al. Reference D'Orazio, Agostini, Mazzarini, Innocenti, Manetti, Haller and Lahsen2000, Reference D'Orazio, Agostini, Innocenti, Haller, Manetti and Mazzarini2001). Early Miocene lavas (group Is and part of group Ia) plot in the central part of the array defined by the studied samples, with 87Sr/86Sr and 143Nd/144Nd ranging from 0.70364 to 0.70455 and from 0.51269 to 0.51282, respectively. The Plio-Pleistocene lavas (groups IIK and IINa) show the most enriched Sr–Nd isotope compositions (87Sr/86Sr = 0.70454–0.70579; 143Nd/144Nd = 0.51254–0.51268), and some samples are the most isotopically enriched of the whole Patagonian Cenozoic magmatic province. The basanite sample from Cerro Ante plots to the right of the array defined by the other groups; it has a relatively high 87Sr/86Sr ratio (0.70488) and a 143Nd/144Nd ratio (0.51275) that falls within the values observed for the early Miocene lavas and for the volcanic rocks of the Southern South Volcanic Zone of the Andes.
Sr–Nd–Pb isotope data

All ratios are re-calculated back at the time of the eruption of the lavas. Ages in italics are assumed on the basis of geological and geographical relationships with dated rocks.
143Nd/144Nd v. 87Sr/86Sr plot for the studied samples (symbols as in Fig. 4). Also shown are the fields for the Cenozoic volcanic rocks from the Antarctic Peninsula (Hole, Kempton & Millar, Reference Hole, Kempton and Millar1993; Hole et al. Reference Hole, Saunders, Rogers, Sykes and Smellie1995; D'Orazio et al. Reference D'Orazio, Gonzalez-Ferrán, Innocenti, Mazzarini, Mazzuoli, Tonarini and Adorni-Braccesi1999), extra-Andean Patagonia from 46.5 to 50.5° S (Stern et al. Reference Stern, Frey, Futa, Zartman, Peng and Kyser1990; Gorring & Kay, Reference Gorring and Kay2001; D'Orazio et al. Reference D'Orazio, Innocenti, Manetti, Haller, Vincenzo and Tonarini2005; Gorring et al. Reference Gorring, Singer, Gowers and Kay2003), the Oligo-Miocene Somuncura Province (Kay et al. Reference Kay, Ardolino, Gorring and Ramos2007), the Pali Aike volcanic field and Estancia Glencross area (D'Orazio et al. Reference D'Orazio, Agostini, Mazzarini, Innocenti, Manetti, Haller and Lahsen2000, Reference D'Orazio, Agostini, Innocenti, Haller, Manetti and Mazzarini2001), the Chile Ridge (segments 1, 2, 4; Sturm et al. Reference Sturm, Klein, Graham and Karsten1999), and the Southern South Volcanic Zone (SSVZ) and Austral Volcanic Zone (AVZ) of the Andes (Hickey, Frey & Gerlach, Reference Hickey, Frey and Gerlach1986; Hickey-Vargas et al. Reference Hickey-Vargas, Moreno-Roa, López-Escobar and Frey1989; Futa & Stern, Reference Futa and Stern1988; Gerlach et al. Reference Gerlach, Frey, Moreno-Roa and López-Escobar1988; López-Escobar et al. Reference López-Escobar, Kilian, Kempton and Tagiri1993, Reference López-Escobar, Parada, Hickey-Vargas, Frey, Kempton and Moreno1995; Stern & Kilian, Reference Stern and Kilian1996; D'Orazio et al. Reference D'Orazio, Innocenti, Manetti, Tamponi, Tonarini, González-Ferrán, Lahsen and Omarini2003). BE – Bulk Earth.

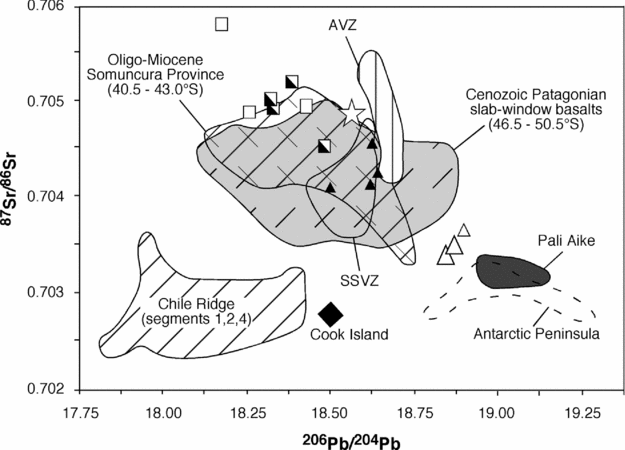
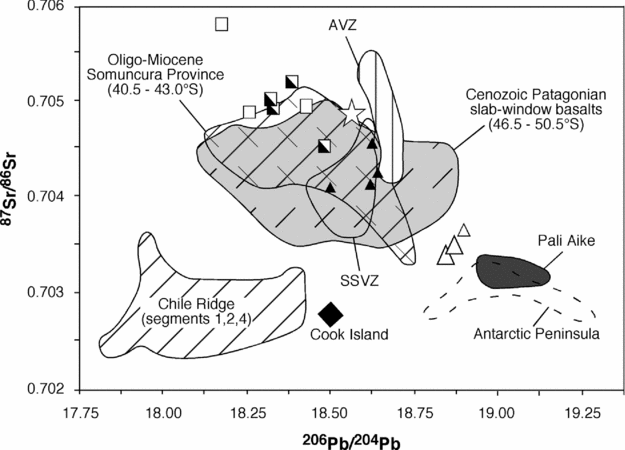
In the 207Pb/204Pb and 208Pb/204Pb v. 206Pb/204Pb (Fig. 9a, b) isotope diagrams, Sierra de San Bernardo lavas plot above the Northern Hemisphere Reference Line (Hart, Reference Hart1984) and largely overlap with the other Cenozoic Patagonian lavas from southern and northern Patagonia (Stern et al. Reference Stern, Frey, Futa, Zartman, Peng and Kyser1990; Gorring & Kay, Reference Gorring and Kay2001; Gorring et al. Reference Gorring, Singer, Gowers and Kay2003; Kay et al. Reference Kay, Ardolino, Gorring and Ramos2007). The variability of the 206Pb/204Pb ratio (18.17–18.90) is much larger than that of 207Pb/204Pb (15.55–15.62) and 208Pb/204Pb (38.37–38.75). Again, we observe a time-related distribution of the Pb isotope composition. Group Ia lavas have the highest 206Pb/204Pb ratios and fall close to the Northern Hemisphere Reference Line and to the extreme values of Pali Aike basalts, filling the gap between the latter and other Patagonian basalts. The lowest 206Pb/204Pb ratios have been measured in group IIK volcanic rocks. Similar Pb isotope compositions also characterize the Plio-Pleistocene ‘post-plateau’ lavas from Meseta del Lago Buenos Aires (Gorring et al. Reference Gorring, Singer, Gowers and Kay2003). The sample from Cerro Ante (206Pb/204Pb = 18.57) plots between group Is and groups IIK/IINa, and within the field of the calc-alkaline volcanic rocks from the Southern South Volcanic Zone of the Andes. The 87Sr/86Sr v. 206Pb/204Pb plot (Fig. 10) highlights the isotopic similarities between group Ia basalts and basalts from Pali Aike and the Antarctic Peninsula.
207Pb/204Pb v. 206Pb/204Pb (a) and 208Pb/204Pb v. 206Pb/204Pb (b) plots for the studied samples (symbols as in Fig. 4). The diagram also shows the Northern Hemisphere Reference Line (NHRL; Hart, Reference Hart1984). Data sources and abbreviations: see Figure 8 caption.

6. Discussion
6.a. Evaluation of crustal contamination processes
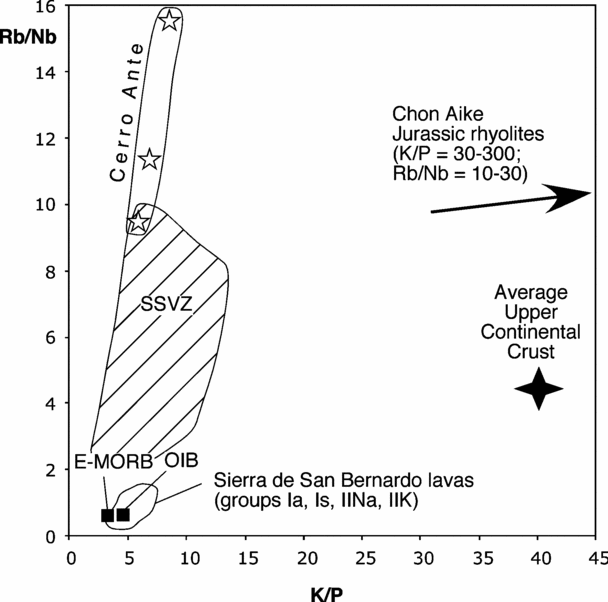
Mantle-derived magmas rising through the continental crust are susceptible to varying degrees of contamination by crustal materials. Before discussing the nature of the mantle sources of Sierra de San Bernardo magmas, we therefore need to assess how crustal inputs affect their chemistry and isotope composition. The basanites from Cerro Ante are sub-aphyric rocks characterized by high Mg numbers (71–72) and high Ni (175–220 ppm) and Cr (475–505 ppm) concentrations, which are indicative of negligible contamination by crustal materials during upwelling. The lavas of the other groups have elemental ratios which are more sensitive to upper crustal contamination (e.g. K/P, Rb/Nb, Pb/Nb, Th/La), with values that differ considerably from those of the average upper continental crust (Taylor & McLennan, Reference Taylor and McLennan1995) but are very close to those of the average E-MORB (Enriched Mid Ocean Ridge Basalts) and OIB (Ocean Island Basalts; Sun & McDonough, Reference Sun, McDonough, Saunders and Norry1989; Fig. 11). The Jurassic Chon Aike rhyolites, a voluminous and widespread upper crustal component of Patagonia (Pankhurst & Rapela, Reference Pankhurst and Rapela1995), are even more unlikely contaminants of Sierra de San Bernardo magmas, since they are characterized by much higher LILE/HFSE ratios. A further argument against contamination of Sierra de San Bernardo magmas by upper crustal materials is the lack of positive correlation between their degree of evolution and values of elemental ratios sensitive to crustal contamination.
Rb/Nb v. K/P plot for the studied samples. The diagram also shows the field for the Southern South Volcanic Zone of the Andes (SSVZ) volcanic rocks with MgO > 3 wt %, the average values for E-MORB and OIB (Sun & McDonough, Reference Sun, McDonough, Saunders and Norry1989), the average value of the Upper Continental Crust (Taylor & McLennan, Reference Taylor and McLennan1995), and the range for the Chon Aike Jurassic rhyolites (Pankhurst & Rapela, Reference Pankhurst and Rapela1995).
As stressed in the results sections, the early Miocene subalkaline lavas (group Is) are characterized by relatively low Mg numbers and Ni concentrations, coupled with low concentrations of most incompatible elements except Sr and Ba, which form positive spikes in the mantle-normalized plots (Fig. 6a). Moreover, these lavas have more enriched Sr and Nd isotope compositions with respect to the coeval or older alkaline lavas of group Ia. These compositional features are compatible with a process of crystal fractionation of mafic phases coupled with an assimilation of felsic materials from the lower continental crust. It is difficult to test the case for a lower crust contamination of group Is lavas, as we know neither the composition of group Is magmas before the supposed contamination nor the nature of the lower crust under the study area. Nonetheless, we tried to test this hypothesis using the energy-constrained assimilation and fractional crystallization (EC-AFC) model of Spera & Bohrson (Reference Spera and Bohrson2001). The lower continental crust contaminant was obtained by averaging the compositions of the mafic granulite xenoliths from Sierra de los Chacays (southern Meseta de Somuncura, ~ 42.5° S 68° W: Pankhurst & Rapela, Reference Pankhurst and Rapela1995). Calculation results indicate that starting from a model subalkaline primary melt with the Sr/Nd, 87Sr/86Sr and 143Nd/144Nd ratios of group Ia lavas, ~ 20 wt % crystal fractionation of mafic phases coupled with 0.4–0.8 wt % assimilation of lower crust melts reproduce quite well the 87Sr/86Sr and Sr/Nd ratios of group Is lavas (Fig. 12a). However, the 143Nd/144Nd ratios of group Is can only be reproduced starting from the sample of group Ia with the lowest 143Nd/144Nd ratio (Fig. 12b).
Sr/Nd v. 87Sr/86Sr (a) and 143Nd/144Nd v. 87Sr/86Sr (b) plots showing the results of EC-AFC (energy constrained-assimilation fractional crystallization) modelling (Spera & Bohrson, Reference Spera and Bohrson2001; symbols as in Fig. 4). The Patagonian lower crust contaminant (Sr = 625 ppm, Nd = 4.1 ppm, 87Sr/86Sr = 0.70695, 143Nd/144Nd = 0.51237) was estimated by averaging the compositions of mafic granulite xenoliths from Sierra de los Chacays (Pankhurst & Rapela, Reference Pankhurst and Rapela1995). The basalt magma composition before contamination was approximated assuming that it had the REE concentrations (Nd = 8.5 ppm) of a subalkaline silicate melt obtained by 15 % partial melting of a garnet-bearing pyrolite source, and Sr/Nd, 87Sr/86Sr and 143Nd/144Nd ratios of group Ia lavas. In particular, in the calculations we selected Eocene sample PA-426, characterized by the most depleted Sr–Nd isotope composition and, as an alternative, Miocene sample PA-417, showing the most enriched Sr–Nd isotope composition. Thermal and thermodynamic parameters and bulk partition coefficients for Nd and Sr are those used by Spera & Bohrson (Reference Spera and Bohrson2001) for their lower crust assimilation example, except for the Sr bulk partition coefficient in the crystallizing basalt magma, that has been taken equal to 0.05. Numbers on tick marks are the mass of assimilated material (Ma) and the mass of cumulates (Mc), respectively, both referred to a unitary mass of initial magma.

In summary, based on isotopic and trace element data, we conclude that none of the alkaline magmas from the study area suffered any detectable contamination by materials from the Patagonian continental crust, whereas the chemical and isotopic features of group Is subalkaline basalts and basaltic andesites do not allow us to exclude a slight contamination by lower crust melts, possibly during magma ponding and crystallization at the base of the continental crust.
6.b. Time–depth evolution of mantle sources of Sierra de San Bernardo magmas
A major finding of this study is the large time-related variation in the Sr–Nd–Pb isotope composition of Sierra de San Bernardo lavas (Figs. 8–10). From the late Eocene to the Pleistocene, magmas with progressively lower 143Nd/144Nd and 206Pb/204Pb and higher 87Sr/86Sr ratios were erupted. These time-related isotopic variations are not associated with corresponding regular variations in the chemistry of the lavas. Indeed, moderate- to low-degree melting during late Eocene, Miocene, Pliocene and Pleistocene times produced alkaline magmas, whereas high-degree melting was restricted to the Miocene and produced subalkaline magmas.
Though characterized by different Sr–Nd–Pb isotope compositions and ages, group Ia, IIK and IINa alkaline basalts, trachybasalts and basanites show similar incompatible element distributions (Fig. 6a, b). These distributions are common among the alkaline mafic lavas in many volcanic fields of central and southern Patagonia and are generally interpreted as the result of moderate- to low-degree (1–6 %) melting of a slightly enriched mantle source, leaving garnet in the solid residue (Gorring et al. Reference Gorring, Kay, Zeitler, Ramos, Rubiolo, Fernandez and Panza1997; Espinoza et al. Reference Espinoza, Morata, Pelleter, Maury, Suárez, Lagabrielle, Polvé, Bellon, Cotten, Cruz and Guivel2005; Massaferro et al. Reference Massaferro, Haller, D'Orazio and Alric2006). The MgO contents and Mg numbers for the alkaline lavas, excluding those contaminated by disaggregated ultramafic xenoliths and the basanites from Cerro Ante, are too low to be in equilibrium with mantle olivine (~ Fo90), indicating that they lost olivine (the main or only phenocryst phase) during their ascent. The composition of the primary magmas was restored by continuously adding equilibrium olivine to the lavas until they were in equilibrium with olivine Fo90 (Pearce, Reference Pearce1978). In the calculation, the KD (Fe/Mg)ol/liq was taken as constant and equal to 0.30. Results indicate that the amount of added olivine varies between 12 and 23 wt %. Though affected by uncertainties linked to model assumptions, the compositions of the calculated primary magmas can be profitably used to make a relative estimate of the pressure of their last equilibration with the mantle. We here used the equation proposed by Albarede (Reference Albarede1992), which is based on the SiO2 and MgO content of the primary liquid. Results show that the alkaline primary melts were originated at variable pressures of 1.6 to 3.6 GPa, with the late Eocene magmas equilibrating at the highest pressures (2.7–3.6 GPa). The pressure interval obtained in the calculations is consistent with the occurrence of residual garnet in the source, as expected on the basis of LREE/HREE fractionation in the alkaline lavas, which indicates pressures in excess of 2.0 GPa (Klemme & O'Neill, Reference Klemme and O'Neill2000). The higher equilibration pressures estimated for the late Eocene lavas are also in agreement with their higher iron contents, which, as experimental data suggest, increase with melting pressure (Hirose & Kushiro, Reference Hirose and Kushiro1993). The transition from lavas with high 143Nd/144Nd and 206Pb/204Pb and low 87Sr/86Sr (late Eocene) to lavas with high 87Sr/86Sr and low 143Nd/144Nd and 206Pb/204Pb (Plio-Pleistocene) is related to a vertical mantle heterogeneity with domains characterized by more radiogenic Sr and less radiogenic Nd and Pb residing at shallower levels.
It is more difficult to evaluate the melting pressures of primary magmas parental to the group Is subalkaline lavas. As shown before, these rocks have more differentiated major element compositions but lower incompatible element concentrations with respect to the alkaline lavas, and Sr–Nd–Pb isotope compositions intermediate between those of group Ia and groups IIK and IINa. In the previous paragraph we showed that the assimilation of lower crust materials cannot be excluded, justifying, at least in part, some of their compositional features.
In accordance with experimental data (e.g. Kushiro, Reference Kushiro2001), the silica-oversaturated nature of these basalts suggests that they segregated from the peridotite mantle at pressures of 1.0–1.5 GPa. On the other hand, their HREE fractionation ((Sm/Yb)N = 2.5–3.2), indicative of garnet in the solid residue during partial melting, implies pressures in excess of 2.0 GPa (Klemme & O'Neill, Reference Klemme and O'Neill2000). This apparent paradox has been previously reported for subalkaline basalts occurring in other parts of the world (e.g. Hawaii: Wagner & Grove, Reference Wagner and Grove1998; southern Patagonia: D'Orazio et al. Reference D'Orazio, Agostini, Innocenti, Haller, Manetti and Mazzarini2001; northeastern China: Xu et al. Reference Xu, Ma, Frey, Feigenson and Liu2005) and interpreted as an effect of the reaction between an upwelling primary basalt magma, originated by partial melting of a garnet–lherzolite, and the shallower lithospheric mantle. Besides reconciling the above-mentioned melting depths paradox, this kind of reaction process can also account for the anomalously high Cr/Ni ratios and silica-oversaturation of group Is lavas. During the reaction process, the magma crystallizes olivine (lower SiO2 and Cr/Ni) and dissolves pyroxene (higher SiO2 and Cr/Ni), thus increasing its silica saturation and Cr/Ni ratios. As shown by the numerical plate models developed by Vernieres, Godard & Bodinier (Reference Vernieres, Godard and Bodinier1997), basalt melt/peridotite reactions are also able to reproduce the peculiar ‘kinked’ REE pattern of group Is lavas.
6.c. Asthenospheric v. lithospheric mantle sources
The Sr–Nd–Pb isotope compositions of Sierra de San Bernardo lavas clearly indicate that different mantle reservoirs were progressively activated from the late Eocene to the Pleistocene. When plotted in the compositional tetrahedron which has at its vertices the 87Sr/86Sr, 143Nd/144Nd, 206Pb/204Pb of the four HIMU-DMM-EM I-EM II end-members (Fig. 13; Hart et al. Reference Hart, Hauri, Oschmann and Whitehead1992), Sierra de San Bernardo data form a linear array whose extremes fall close to the HIMU-DMM-EM I face (group Ia) and the EM I–EM II edge (group IIK), respectively. In accordance with their higher depth of equilibration and their Sr–Nd–Pb isotope features, the oldest alkaline magmas (group Ia) are believed to be sourced within the asthenospheric mantle. This conclusion is sustained by the close similarity between group Ia lavas and the Neogene basalts from Pali Aike, the Estancia Glencross area and the Antarctic Peninsula, which have been interpreted as more or less pure asthenospheric melts (Hole, Kempton & Millar, Reference Hole, Kempton and Millar1993; Hole et al. Reference Hole, Saunders, Rogers, Sykes and Smellie1995; D'Orazio et al. Reference D'Orazio, Agostini, Mazzarini, Innocenti, Manetti, Haller and Lahsen2000, Reference D'Orazio, Agostini, Innocenti, Haller, Manetti and Mazzarini2001). Note that the isotopic features of this subcontinental asthenosphere strongly contrast with those of the suboceanic asthenosphere sampled by the Chile Ridge basalts (Figs. 8–10). Indeed, the latter have MORB-like Sr–Nd–Pb isotope compositions (87Sr/86Sr = 0.7024–0.7036, 143Nd/144Nd = 0.5129–0.5132 and 206Pb/204Pb = 17.8–18.4: Sturm et al. Reference Sturm, Klein, Graham and Karsten1999).
Three-dimensional plot of 87Sr/86Sr, 143Nd/144Nd and 206Pb/204Pb for Sierra de San Bernardo and Cerro Ante samples, using the four end-members DMM, EM I, EM II and HIMU at the vertices of the tetrahedron (end-member compositions after Hart et al. Reference Hart, Hauri, Oschmann and Whitehead1992; symbols as in Fig. 4).

The Miocene subalkaline lavas and the subsequent Plio-Pleistocene alkaline lavas were derived from mantle sources containing an enriched component characterized by high 87Sr/86Sr (> 0.7055) and low 143Nd/144Nd (< 0.5126) and 206Pb/204Pb (< 18.2) ratios. The contribution of this component increased with time and with the degree of alkalinity of the erupted lavas. This enriched component, isotopically akin to the EM I mantle, is considered to be stored within the lower portions of the Patagonian lithospheric mantle (Gorring et al. Reference Gorring, Singer, Gowers and Kay2003). The Sr–Nd isotope compositions of Patagonian mantle xenoliths (e.g. Schilling et al. Reference Schilling, Conceição, Mallmann, Koester, Kawashita, Hervé, Morata and Motoki2005; Rivalenti et al. Reference Rivalenti, Mazzucchelli, Zanetti, Vannucci, Bollinger, Hémond and Bertotto2007 and references therein) indicate that the mantle lithosphere is isotopically heterogeneous (Fig. 14). Nonetheless, depleted compositions prevail, suggesting a recent (late Proterozoic–early Phanerozoic) stabilization of the subcontinental mantle from a MORB-source-type asthenosphere (Stern et al. Reference Stern, Kilian, Olker, Hauri and Kyser1999). The enriched lithospheric domains that we consider responsible for the geochemical features of groups Is, IINa and IIK were not frequently sampled as mantle xenoliths, possibly because they are seated at deeper levels close to the asthenosphere–lithosphere transition or because they are dispersed in a prevailing isotopically depleted mantle matrix.
143Nd/144Nd v. 87Sr/86Sr plot for Patagonian mantle xenoliths. Data sources: Pali Aike: Stern et al. (Reference Stern, Kilian, Olker, Hauri and Kyser1999) and Kempton et al. (Reference Kempton, Hawkesworth, Lopez-Escobar, Pearson, Ware, Gurney, Gurney, Pascoe and Richardson1999); Estancia Lote 17: Gorring & Kay (Reference Gorring and Kay2000) and Conceição et al. (Reference Conceição, Mallmann, Koester, Schilling, Bertotto and Rodriguez-Vargas2005); Cerro Redondo: Schilling et al. (Reference Schilling, Conceição, Mallmann, Koester, Kawashita, Hervé, Morata and Motoki2005); Tres Lagos: Ntaflos et al. (Reference Ntaflos, Bjerg, Labudia and Kurat2007); Cerro de los Chenques: Rivalenti et al. (Reference Rivalenti, Mazzucchelli, Zanetti, Vannucci, Bollinger, Hémond and Bertotto2007). Abbreviations: WR – whole rock; CPX – clinopyroxene; PHL – phlogopite; AMPH – amphibole.

In summary, according to our data, the late Eocene to Pleistocene basaltic rocks from the Sierra de San Bernardo record the progressive transition from mantle melting confined within the asthenosphere to mantle melting involving deep and enriched lithospheric domains whose role increases through time.
6.d. Petrogenesis of the basanites from Cerro Ante
The Pleistocene basanite lavas from Cerro Ante show some peculiar chemical features that set them apart from the other basaltic rocks in the study area. Particularly striking are the pronounced negative Ta and Nb anomalies (and the less marked negative Ti anomaly), the strong enrichment in alkaline elements (Cs, Rb and to a lesser extent K) and the negative Ba anomaly (Ba/Ba* = 0.3–0.4; Ba/Ba* = BaN/(RbN*ThN)1/2). One sample (PA-390) almost satisfies the chemical criteria for defining a rock as ultrapotassic (Foley et al. Reference Foley, Venturelli, Green and Toscani1987). The sigmoidal shape of the REE patterns is also peculiar, with LREE and HREE much less fractionated than the middle REE. The Sr–Nd–Pb isotope composition is similar to that of the volcanic rocks from the Southern South Volcanic Zone of the Andes, but is also very close to the most common values for Cenozoic basalts from southern Patagonia. It is also noteworthy that the lavas from Cerro Ante have reasonably low Ti/V ratios (37–38), as expected for subduction-related magmas (Shervais, Reference Shervais1982). Indeed, the Ti/V ratios are intermediate between those of the basalt and basaltic andesite lavas from Cay and Maca volcanoes (Ti/V = 25 ± 3: D'Orazio et al. Reference D'Orazio, Innocenti, Manetti, Tamponi, Tonarini, González-Ferrán, Lahsen and Omarini2003), located on the active magmatic arc at approximately the same latitude as Cerro Ante, and those of the large majority of the other Cenozoic mafic lavas from the study area and southern Patagonia (Ti/V = 50–100). However, Cerro Ante lavas display negative Pb anomalies, in contrast with the volcanic rocks from the nearby Southern South Volcanic Zone of the Andes where Pb forms marked positive spikes (e.g. Cay and Maca volcanoes: D'Orazio et al. Reference D'Orazio, Innocenti, Manetti, Tamponi, Tonarini, González-Ferrán, Lahsen and Omarini2003). Lastly, their CaO/Al2O3 wt % ratio (~ 0.70) is higher than that of Sierra de San Bernardo lavas (0.58 ± 0.07).
Whatever the melting mineral assemblage and the melting mode, a pyrolite or a more depleted mantle rock cannot be the source of the LILE-enriched basanites from Cerro Ante, even at extremely low (< 1 %) degrees of melting. A mantle that is strongly enriched in Cs, Rb, K, Th, U and LREE is clearly needed for the generation of these magmas. While the high LILE/HFSE and low Ti/V ratios are typical of mantle sources metasomatized by subduction-derived materials, the negative Pb anomalies and the low Ba/Ba* values require additional explanations. Lead is one of the most mobile elements in aqueous fluids (Kogiso, Tatsumi & Nakano, Reference Kogiso, Tatsumi and Nakano1997), thus, it can be more efficiently removed from the subducting slab beneath the Andean forearc and active volcanic arc with respect to the other fluid mobile elements, leaving the subducted material beneath the back-arc region strongly Pb-depleted. Assuming a constant slab dip in the 0–400 km space interval from the trench, and a depth of the slab top under the active volcanic arc of 110 km (corresponding to a slab dip of ~ 29°), we estimate that the top of the subducted slab beneath Cerro Ante should be located at a depth of about 190 km (~ 6 GPa). Hydrous silicate phases stable in this deep part of the slab or the immediately overlying mantle wedge, such as phlogopite and K-richterite (Sudo & Tatsumi, Reference Sudo and Tatsumi1990), have variable partition coefficients for the LILE but DRb/DBa > 1 (Plá Cid et al. Reference Plá Cid, Nardi, Gisbert, Merlet and Boyer2005; Tiepolo et al. Reference Tiepolo, Zanetti, Oberti, Brumm, Foley and Vannucci2003). Low-degree melts or fluids released from these materials would be able to metasomatize a portion of the overlying mantle whose succesive partial melting may produce the peculiar geochemical features of Cerro Ante basanites.
The subduction-related origin of the Cerro Ante magmas is in agreement with the geological setting of this small volcanic occurrence on the easternmost slopes of the Andean foothills, in the westernmost part of the study area (Fig. 2). The paucity of lavas with these geochemical features has to be linked to the tectonic setting of the Andean foothills that allows the ascent of deep-seated magmas only in very confined areas.
6.e. Sierra de San Bernardo magmatism and geodynamic evolution
Current knowledge of intra-continental, Cenozoic basaltic magmatism in Patagonia strongly suggests that it originated neither in relation to a high heat flux mantle plume nor in relation to significant regional-scale lithospheric extension (Ramos & Kay, Reference Ramos and Kay1992). The cause of widespread mantle melting under this area during the Cenozoic thus remains unresolved.
To the southeast of the modern Chile Triple Junction, the genesis of basaltic magmas has been ascribed to the middle Miocene to Present opening of a slab window (Ramos & Kay, Reference Ramos and Kay1992; Gorring et al. Reference Gorring, Kay, Zeitler, Ramos, Rubiolo, Fernandez and Panza1997; D'Orazio et al. Reference D'Orazio, Agostini, Mazzarini, Innocenti, Manetti, Haller and Lahsen2000, Reference D'Orazio, Agostini, Innocenti, Haller, Manetti and Mazzarini2001, Reference D'Orazio, Innocenti, Manetti, Haller, Vincenzo and Tonarini2005; Gorring & Kay, Reference Gorring and Kay2001; Gorring et al. Reference Gorring, Singer, Gowers and Kay2003; Espinoza et al. Reference Espinoza, Morata, Pelleter, Maury, Suárez, Lagabrielle, Polvé, Bellon, Cotten, Cruz and Guivel2005). Within this tectonic framework, mantle melting occurs as the hot sub-slab asthenosphere rises to fill the space left by the diverging subducting plates and crosses its solidus by adiabatic decompression. According to some authors (Ramos & Kay, Reference Ramos and Kay1992; Espinoza et al. Reference Espinoza, Morata, Pelleter, Maury, Suárez, Lagabrielle, Polvé, Bellon, Cotten, Cruz and Guivel2005), mantle melting and basalt effusion related to slab window opening occurred several times in Patagonia as a consequence of Neogene, Palaeogene and even older ridge–trench collisions. Guivel et al. (Reference Guivel, Morata, Pelleter, Espinoza, Maury, Lagabrielle, Polvé, Bellon, Cotten, Benoit, Suárez and de la Cruz2006) alternatively proposed that beneath the Meseta Chile Chico–Meseta del Lago Buenos Aires area, the sub-slab asthenospheric mantle rose up through a tear-in-the-slab formed starting from c. 15 Ma. The Sierra de San Bernardo is located outside (north of) the vertical projection of the supposed middle Miocene to Present slab window; however, the Plio-Pleistocene basalts were erupted just about 50 to 150 km north of the northernmost slab window edge. This relatively short distance from the slab window does not preclude at least a thermal influence of this latter on the genesis of the most recent basalts from Sierra de San Bernardo. The limited amount of palaeomagnetic data on Pacific oceanic crust pre-dating the Miocene does not allow us to constrain accurately the space–time evolution of the Palaeogene slab-window, but it is very likely that at the time the first basalts were erupted in the Sierra de San Bernardo (late Eocene), the slab window had already migrated to more southern latitudes (Cande & Leslie, Reference Cande and Leslie1986).
Several models have been put forward to explain the upwelling and melting of the asthenosphere under northern Patagonia: de Ignacio et al. (Reference de Ignacio, López, Oyarzun and Márquez2001) proposed that a combination of slab roll-back, the curved (concave-up) topography of the subducted slab, and late Oligocene plate reorganization favoured the intake of hot asthenospheric mantle under the Meseta de Somuncura area (northern Patagonia). As an alternative, Kay et al. (Reference Kay, Ardolino, Gorring and Ramos2007) attributed the Oligocene–Miocene magmatism of the same area to asthenosphere upwelling due to thermal instability in the mantle associated with the late Oligocene change in the convergence vectors of the Pacific oceanic plates with respect to South America.
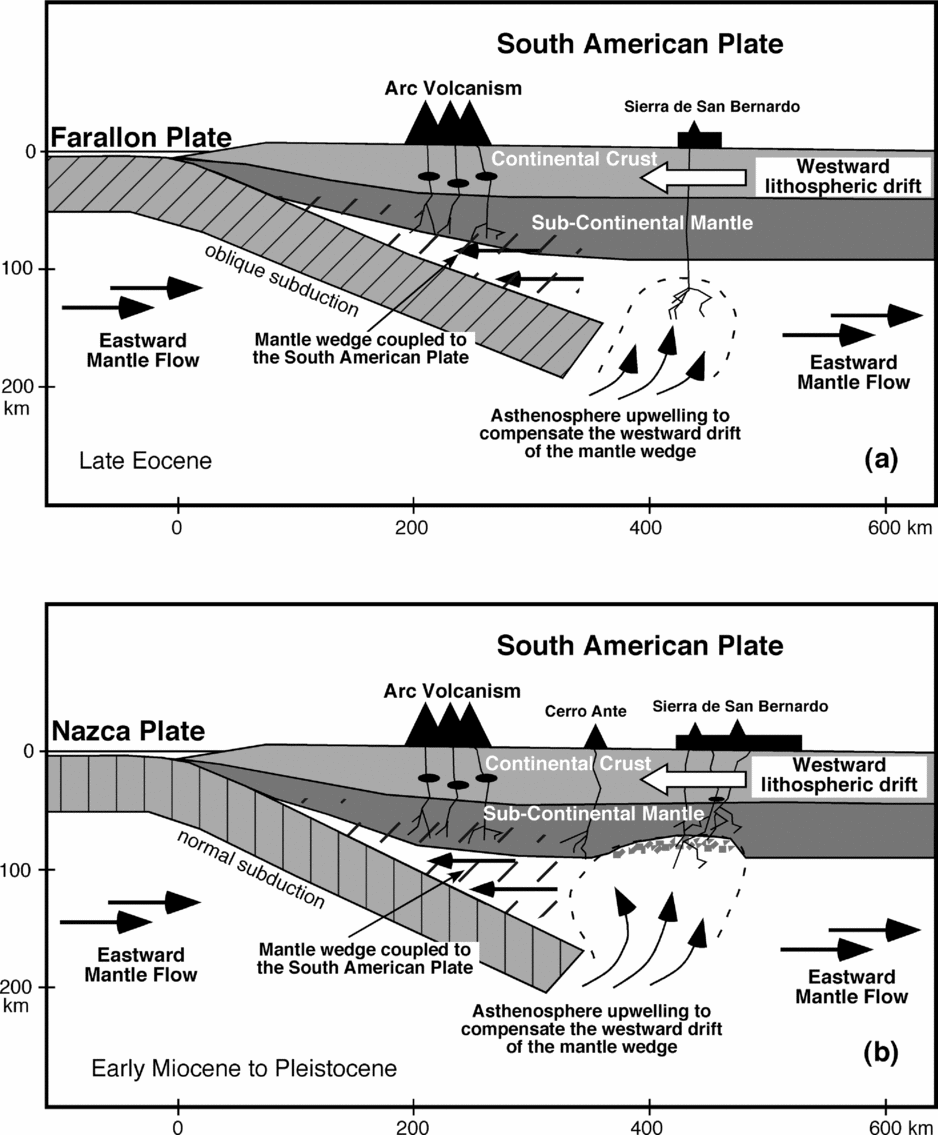
Reconstructed global absolute plate motions suggest a generalized ‘westward’ drift of lithosphere relative to the underlying mantle (e.g. Scoppola et al. Reference Scoppola, Boccaletti, Bevis, Carminati and Doglioni2006 and references therein). In the hotspot reference frame (Gripp & Gordon, Reference Gripp and Gordon2002), the South American Plate is moving westward relative to the mantle. Assuming that the main mantle–lithosphere décollement surface is located in the Low-Velocity Zone (Thybo, Reference Thybo2006), we suppose that the relative eastward-directed mantle flow involves the sub-lithospheric mantle, whereas the mantle wedge sandwiched between lower and upper converging plates is shielded and free to move westward along with the upper plate (Fig. 15). As a consequence, the space created by this motion is compensated by the upwelling of mantle. In this framework, the upwelling asthenospheric mantle melted by decompression, producing the late Eocene–early Miocene alkaline magma (group Ia; Fig. 15a). The melting source eventually moved upward, thereby involving the lower part of the lithospheric mantle and originating the Miocene to Pleistocene basaltic magmas with an enriched Sr–Nd isotope signature (Fig. 15b).
Schematic illustration showing the geodynamic model for Cenozoic mafic magmatism in central Patagonia. (a) Magmatism started during the late Eocene, when the asthenosphere welled up to compensate for the westward drift of the mantle wedge associated with the South American Plate and melted by adiabatic decompression. (b) Progressive lithospheric erosion induced by the upwelling of the asthenospheric mantle activated more isotopically enriched sources that produced the subsequent Miocene, Pliocene and Pleistocene lavas. The Pleistocene lavas from Cerro Ante, located between the Andean Arc and Sierra de San Bernardo, were sourced from a mantle domain extensively modified by subduction-related components (hatched area).
7. Summary and conclusions
The study of the mafic volcanic rocks from the Sierra de San Bernardo and neighbouring areas allows us to discuss the time-evolution of the sources of Cenozoic magmatism in central Patagonia in the framework of the geodynamic evolution of southern South America. Based on K–Ar geochronology, bulk chemistry and Sr–Nd–Pb isotope data we conclude that:
(1) The studied rocks can be subdivided into five groups: group Ia consists of alkaline mafic lavas (basanites, alkali basalts, trachybasalts) erupted during the late Eocene and early Miocene; group Is comprises quartz-normative lavas (subalkaline basalts, basaltic andesites) erupted exclusively during the early Miocene; groups IIK and IINa are alkaline Plio-Pleistocene lavas (basanites, alkali basalts, trachybasalts) discriminated on the basis of their K2O/Na2O ratios; the Pleistocene basanite lavas from the Cerro Ante monogenetic cone (located on the easternmost slopes of the Patagonian Andes) have a marked orogenic geochemical affinity that sets them apart from the other lavas.
(2) The Sr–Nd–Pb isotope compositions and bulk chemical compositions of the late Eocene to early Miocene alkaline group Ia lavas match those of the asthenospheric magmas erupted in the Pali Aike Volcanic Field, in the Estancia Glencross area (southernmost Patagonia, Miocene–Recent) and in the Antarctic Peninsula (Miocene to Recent). Moreover, their compositions indicate a deeper level of equilibration in the mantle with respect to subsequent lavas. Accordingly, we suggest a dominantly asthenospheric origin for these magmas.
(3) The chemical and isotopic features of the early Miocene group Is subalkaline lavas are indicative of high-degree melting at depth, followed by reaction between the melt and the overlying lithospheric mantle. Some chemical peculiarities of these lavas also suggest a small input of lower crustal melts.
(4) The more recent alkaline lavas of groups IIK and IINa are among the most enriched in terms of Sr–Nd isotope composition of all of extra-Andean Patagonia. Their occurrence is due to the activation, possibly in relation to local extensional tectonic processes, of enriched lithospheric domains at the lithosphere–asthenosphere boundary.
(5) The basanites from Cerro Ante originated in the near back-arc of the Andes from a mantle source extensively modified by the addition of low-degree melts or fluids released from the deep portion of the subducting slab or from the metasomatized mantle immediately overlying the slab.
(6) The progressive involvement of enriched lithospheric mantle domains in the genesis of the studied lavas from the late Eocene to the Pleistocene reveals a process of lithospheric erosion induced by the upwelling of asthenospheric mantle beneath the study area. Based on current knowledge about the relative movement and decoupling between lithosphere and asthenosphere, we propose that the asthenosphere under the study area rose up to compensate the westward drift of the mantle wedge associated with the South American lithosphere.
Acknowledgements
The authors wish to thank Carlo Doglioni for the critical reading of the manuscript and the fruitful discussions, Marco Bertoli and Marco Tamponi for XRF analyses, Riccardo Vannucci and Matthew L. Gorring for their constructive reviews, and David Pyle for the editorial assistance. This research was funded by MIUR-ITALY and by the Italian National Antarctic Research Program (PNRA).
Appendix. Analytical methods
Major and trace element analyses were performed at Pisa University's Dipartimento di Scienze della Terra. Major elements were determined by X-ray fluorescence on an ARL 9400 XP+ spectrometer using Li2B4O7 glass disks (sample:flux ratio = 1:7). Estimated precision (relative standard deviation, RSD) is about 1 % for SiO2 and about 2 % for the other major elements except those with low concentrations (~ < 0.50 wt %), for which the absolute standard deviation is about ± 0.01 %. Loss on ignition (LOI) was determined by gravimetry at 1000 °C after pre-heating at 110 °C.
The concentrations of a set of thirty-five trace elements were determined by inductively coupled plasma–mass spectrometry (VG PQII Plus). Sample powders were dissolved in PFA vessels on a hot plate at about 120 °C using HF + HNO3. The sample solutions, spiked with Rh, Re and Bi as internal standards, were measured by external calibration using international reference materials of basaltic composition. Analytical precision, assessed by repeated analysis of the in-house standard HE-1 (Mt Etna hawaiite), is between 2 and 5 % RSD, except for Gd, Tm, Be, Sc, Pb (6–8 % RSD).
Sr, Nd and Pb isotope compositions were measured with a Finnigan MAT 262V multicollector mass spectrometer at the CNR Istituto di Geoscienze e Georisorse in Pisa. Conventional ion exchange methods were used for Sr, Nd and Pb separations. Measured 87Sr/86Sr ratios were normalized to 86Sr/88Sr = 0.1194; 143Nd/144Nd ratios were normalized to 146Nd/144Nd = 0.7219. During the collection of isotopic data for this study, replicate measurements of NIST SRM 987 (SrCO3) and La Jolla standards yielded values of 0.710243 ± 13 (2σ, N = 20) for 87Sr/86Sr and 0.511848 ± 7 (2σ, N = 30) for 143Nd/144Nd. Lead was loaded on Re filaments with tetraethyl orthosilicate as activator. Replicate analyses (N = 50) of NIST SRM 981 (natural lead) indicate that Pb isotope ratios are measured with a precision of 0.03 % (2σ) per mass unit. Mass fractionation was corrected for by applying a factor of 0.14 ± 0.01 % per mass unit (NIST SRM 981 certified values after Todt et al. Reference Todt, Cliff, Hanser, Hofmann, Hart and Basu1996).
Potassium/argon analyses were carried out at the Institute of Nuclear Research of the Hungarian Academy of Sciences. The groundmass of fourteen samples was separated through standard separation techniques and purified by hand-picking under a stereo-microscope. Groundmass samples, which show intersertal or intergranular texture and are fresh or very weakly altered, have been chosen for the analytical work because the xenocrysts/xenoliths occurring in some basalts can strongly affect the radiometric age. About 500 mg of sample were spiked with 38Ar for the determination of 40Ar. The mass spectrometer, operating in static mode, was cleaned with conventional getter material prior to gas sample introduction. The HD-B1, GL-O, LP-6 and Asia 1/65 interlaboratory standards were used for calibration. Ages were calculated using the decay constants of Steiger & Jäger (Reference Steiger and Jäger1977). All analytical errors represent one standard deviation. Potassium concentrations were determined by flame photometry, and replicate analyses were reproducible within 2 %. Further details are reported in Balogh (Reference Balogh1985).