Introduction
The swelling and shrinkage properties of expansive soils are mainly attributed to the presence of montmorillonite (Mnt) and Ilt-Mnt interstratified minerals (Emmerich et al., Reference Emmerich, Wolters, Kahr and Lagaly2009; Zheng, Reference Zheng2013). These minerals swell when absorbing water and shrink when losing water due to their d 001 interlayer spacing. In contrast, common hydrophilic minerals such as illite (Ilt) and kaolinite (Kln) lack the expansible crystal layer structure and have lower hydrophilicity (1/10 to 1/60 that of Mnt). The 2:1 layered structure of Mnt minerals imparts strong cation-exchange and water-adsorption capabilities (Volk and Jackson, Reference Volk and Jackson1963; Li et al., Reference Li, Lu, Zhang, Cheng and Liu2019; Chen et al., Reference Chen, Zhao, Bai, Zhong, Chen, Hu, Song and Sridhar2020; Liu et al., Reference Liu, Ye and Gao2020). Greater Mnt contents lead to more pronounced swelling and shrinkage effects (Tan and Kong, Reference Tan and Kong2006), controlling the swelling-shrinkage property of expansive soil (Khoury, Reference Khoury2019). Therefore, reducing the amount of Mnt in expansive soil can significantly mitigate or eliminate these effects. The Earth’s surface has abundant active microorganisms that significantly influence the formation of minerals and the properties of soil and rock mass. As environmental concerns grow, eco-friendly microbial technology offers economic benefits and other merits in addressing geotechnical engineering problems (Jiang et al., Reference Jiang, Wang, Chu, Kawasaki, Tang, Cheng and Wang2022; Sarma and Mishra, Reference Sarma and Mishra2024).
Microbial geo-technology can be divided into two main categories. The first category involves biochemical reactions during microbial growth and metabolism, leading to the precipitation of carbonate and phosphate minerals, a process known as microbial mineralization. This can alter the engineering properties of soil and rock, enhancing characteristics such as cementation strength. The most widely applied technique is microbial-induced carbonate precipitation (MICP) (Liu et al., Reference Liu, Zhao and Xiao2024; Boruah et al., Reference Boruah, Mohanadhas and J2025), which has promising applications in soil and rock reinforcement (Stocks-Fisher et al., Reference Stocks-Fischer, Galinat and Bang1999; Wei et al., Reference Wei, Zhang, Xiao, Yan and Wang2023), seepage prevention (Seki et al., Reference Seki, Miyazaki and Nakano1998), and pollutant remediation (Wu et al., Reference Wu, Yao, Li, Shi, Zang, Shu and Zhang2022). However, challenges remain, including the controllability of calcium ion deposition and long-term stability. The second category involves changes in the original mineral structure caused by microbial dissolution of metabolic products, physical penetration, and the release of mineral cations, essentially promoting minerals weathering by altering the mineral structures. Microbial metabolic products can penetrate mineral interlayer spaces, altering the molecular environment of the mineral structures. Microbial growth and metabolism are interdependent with minerals, with the latter providing nutrients and energy, and microbial products promoting mineral weathering (Dong et al., Reference Dong, Huang, Zhao, Zeng, Liu, Sheng, Shi, Wu, Jiang, Li, Zhang, Guo, Li, Hou and Chen2022). Yang et al. (Reference Yang, Li and Hu2018) conducted a 60-day weathering experiment on trachyte using Bacillus safensis HR-2 strain, demonstrating effective promotion of trachyte weathering and the release of metal ions such as Si, Fe, Al, and Mg, which accelerated mineral weathering by altering the mineral structure. Iron-reducing bacteria can dissolve Mnt by reducing structural Fe(III) at ambient conditions, potentially triggering dissolution and re-precipitation of Mnt (Stucki et al., Reference Stucki, Komadel and Wilkinson1987; Kim et al., Reference Kim, Dong, Yang, Park, Elliott, Spivack and Heuer2019). Pseudomonas mendocina was found by Zhu et al. (Reference Zhu, Fan, Lu, Li, Lu and Yu2011a) to possibly reduce Fe(III) in the octahedron of Mnt, altering its crystal structure. Zhu et al. (Reference Zhu, Lu, Li and Wang2010) observed that the acidic metabolites produced by the bacteria changed the petrochemical composition and crystal structure of Mnt. Different microorganisms exhibit varying abilities to reduce iron in clay minerals, with Shewanella putrefaciens showing greater reduction capabilities (Dong et al., Reference Dong, Kostka and Kim2003). Zhang et al. (Reference Zhang, Kim, Dong and Sommer2007) utilized cysteine and toluene as model organic molecules embedded in iron-rich Mnt, finding that cysteine, as an electron shuttle, enhanced Fe(III) reduction compared with toluene, promoting Mnt-to-Ilt transformation under natural conditions. These studies indicate that microorganisms can accelerate Mnt weathering rates and alter Mnt compositions compared with natural weathering.
Nevertheless, the existing literature has largely addressed microbially mediated transformations in pure Mnt systems. Complex soil matrices containing Mnt as a component have received comparatively little attention. Expansive soils, rich in Mnt minerals, exhibit significant swelling and shrinking properties, pre-disposing them to engineering disasters. This study aims to investigate how Paenibacillus mucilaginosus (P. mucilaginosus ) can promote Mnt weathering, inducing a phase transformation to non-expansive minerals, thereby reducing soil expansiveness. The experiments with the microorganism P. mucilaginosus and expansive soil would be conducted to analyze the effects of microorganisms on the mineral phases, content, crystal chemical bonds in expansive soil, as well as changes in ion concentration, pH in the reaction solution and swelling-shrinking potential, of expansive soil, providing insights into microbial soil improvement.
Materials and methods
Soil samples
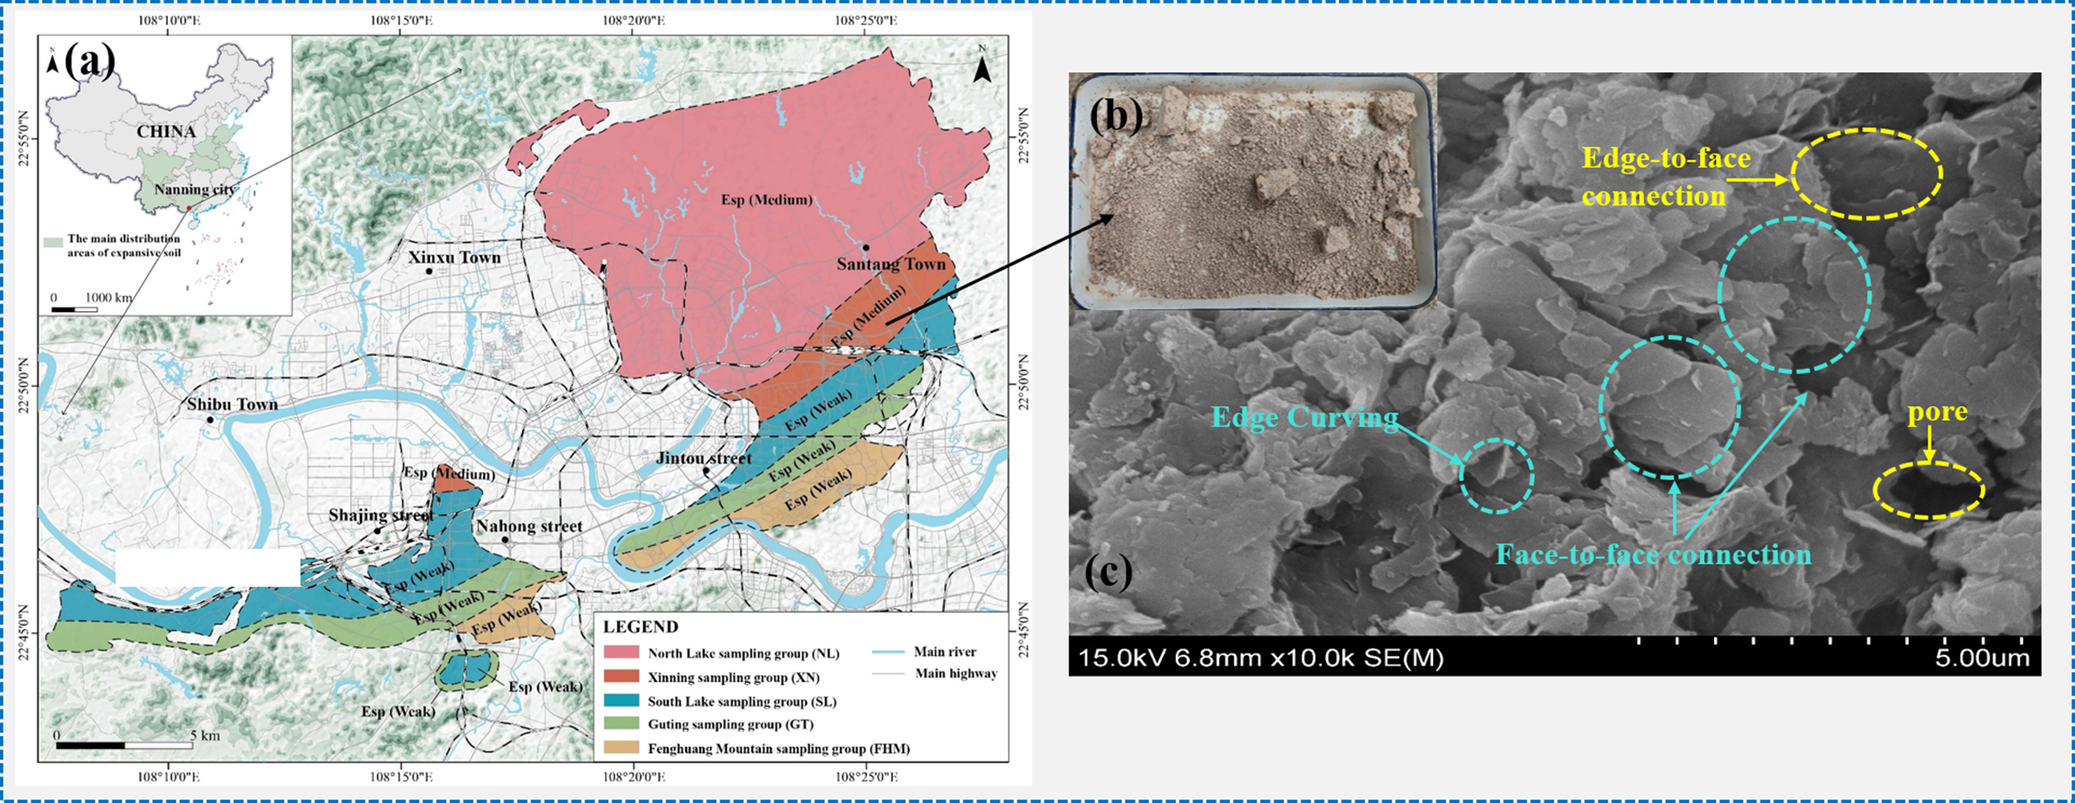
In the present study, a soil sample sourced from Nanjing, China, was mixed with 8% (w/w) calcium-based bentonite. The soil exhibited a grayish-yellow brown hue, as depicted in Fig. 1. Scanning electron microscopy (SEM) revealed that the clay minerals in the soil displayed flocculent morphology. Most clay particles were present as individual sheets, predominantly in a planar orientation.
Expansive soil used in the test: (a) sampling location; (b) sample soil; and (c) SEM image of soil sample.

Figure 1. Long description
The leftmost panel is a detailed regional map anchored on Nanning city, China, with a legend identifying five color-coded sampling groups: North Lake, Nanning, South Lake, Guting, and Fucheng Mountain. Sampling zones are shaded and labeled, with towns such as Xinxi, Shibu, and Santang marked. Main rivers and highways are shown, and an inset map of China highlights the study area. The central panel is a close-up photo of a soil sample, showing a granular, light brown texture. The rightmost panel is an S E M micrograph at 10,000 times magnification, with scale bar labeled 5.00 micrometers. Annotated features include edge-to-face connection (yellow dashed oval), face-to-face connection (blue dashed oval), edge curving (blue dashed circle), and pore (yellow dashed oval), all distributed across the microstructure from left to right.
The basic physical properties of the soil sample were determined in accordance with Test Methods of Soils for Highway Engineering (JTG 3430-2020) and are summarized in Table 1. The soil sample has a free swell ratio of 171%, a Mnt content of 35.9%, and a cation exchange capacity of 432 mmol kg–1. Based on China’s Technical Code for Building in Expansive Soil Regions (GB50112-2013), the soil sample was classified as having significant potential for expansion.
Primary physical properties of the expansive soil sample

Table 1. Long description
From left to right, the table columns and their values are: natural density 1.88 grams per cubic centimeter, maximum dry density 1.75 grams per cubic centimeter, optimal moisture content 25.2 percent, liquid limit 58.1 percent, plastic limit 22.8 percent, plasticity index 35.3 percent, standard moisture absorption 5.84 percent, free swelling ratio 171 percent, M n t content 35.9 percent, and C E C 432 millimoles per kilogram.
Microbial culture
Strain
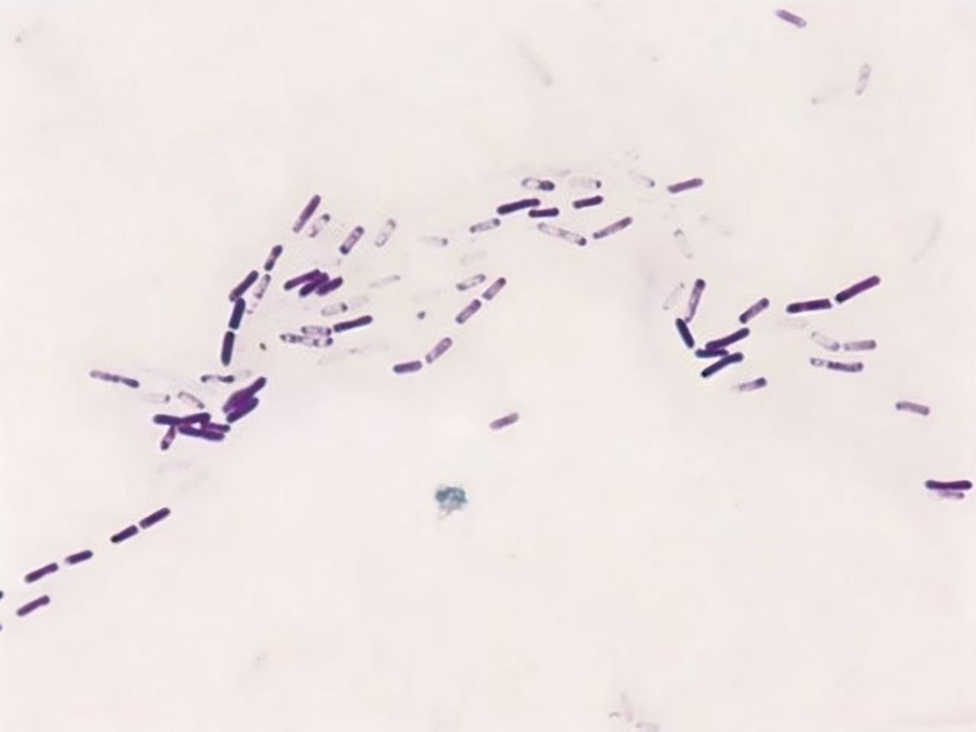
The microbial strain used in the experiment was P. mucilaginosus (strain CICC 21698) as shown in Fig. 2, which was purchased from the China Center of Industrial Culture Collection (CICC), Beijing. P. mucilaginosus is a Gram-variable, facultatively anaerobic bacterium with rod-shaped vegetative cells (typically 2–5 μm in length). Motility is conferred by peritrichous flagella. The bacterium produces translucent, highly viscous colonies on solid media.
Electron microscope image of P. mucilaginosus (1500×).

Medium
A nitrogen-free medium was used for bacterial cultivation and weathering experiments. The composition of the liquid medium was: 10 g sucrose, 0.1 g CaCO3·2H2O, 0.2 g K2HPO4, 5.0 g CaCO3, 0.2 g MgSO4·7H2O, 0.2 g NaCl (99% analytical purity; manufactured by Fuchen (Tianjin) Chemical Reagent Co., Ltd) per liter of deionized water, and the solution was adjusted to a pH of 7.0 using 0.1 mol L⁻¹ hydrochloric acid.
Bacterial solution
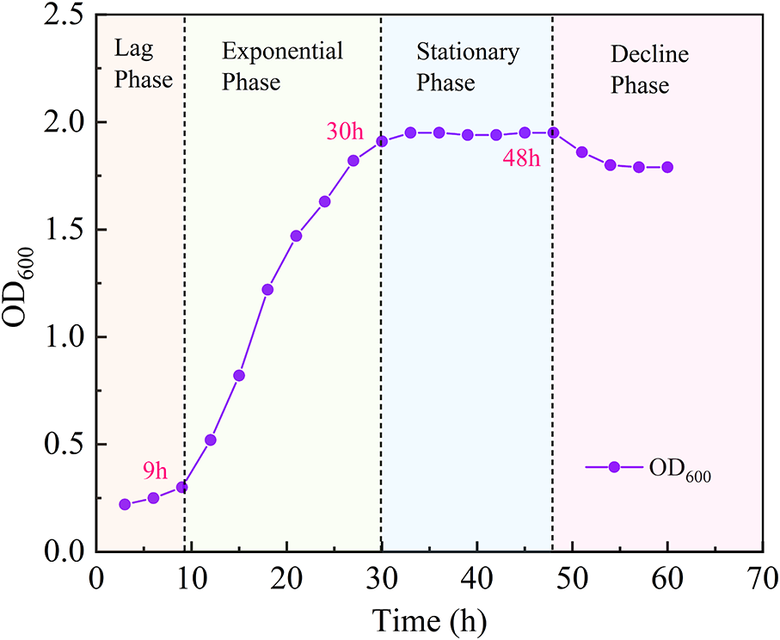
The seed solution at 4°C was transferred into 100 mL of the prepared liquid medium, and a seed culture was obtained after incubation for 36 h at 150 rpm and 30°C on a rotary shaker. The life cycle of P. mucilaginosus consists of four phases, namely: lag, exponential, stationary, and decline phases, as shown in Fig. 3. The abbreviation OD refers to the optical density of the biomass measured with a photometer at a specific wavelength. The bacterial cells for P. mucilaginosus are usually grown to reach the exponential phase. Measurement of the OD at a wavelength of 600 nm (OD600) is common.
Growth curve of P. mucilaginosus

Figure 3. Long description
The line graph plots O D sub 600 on the y-axis from 0.0 to 2.5 and time in hours on the x-axis from 0 to 70. Four vertical dashed lines divide the graph into lag phase (0 to about 10 hours), exponential phase (about 10 to 30 hours), stationary phase (about 30 to 48 hours), and decline phase (after 48 hours). The purple data line starts near O D sub 600 of 0.1 at 0 hours, rises gradually in the lag phase, then increases steeply during the exponential phase, reaching about O D sub 600 of 2.0 at 30 hours (marked as 30 h). The curve plateaus during the stationary phase, with a label at 48 hours (48 h), and then slightly declines in the decline phase. The legend at the lower right indicates the purple line represents O D sub 600. Additional labels in red mark 9 h, 30 h, and 48 h along the curve.
The stationary phase of P. mucilaginosus growth occurred between 30 and 48 h (Fig. 3), during which the bacterial population reached its maximum and the OD600 value stabilized at 1.82. The OD600 values observed may be slightly larger than the typically observed range, with potential contributing factors as follows: the culture medium employed in this study, formulated with sucrose as the carbon source and insoluble phosphates or silicates as the source of phosphorus or potassium, was designed to selectively enrich for and physiologically activate bacterial functions including acid production, EPS synthesis, and mineral solubilization. During liquid cultivation, P. mucilaginosus secretes viscous extracellular polymeric substances (EPS) extensively. The EPS secretion imparts a viscous, colloidal property to the culture broth, markedly enhancing light scattering and leading to an artificially elevated OD reading.
Experimental procedure
A quantity of expansive soil was dried, crushed, and sieved through a 0.5 mm mesh, then introduced into a conical flask containing 100 mL of culture medium, and sterilized at 120°C for 20 min. The experiment was divided into two groups: the experimental group (J-7, J-14, J-28, and J-42) and the control group (JM-7, JM-14, JM-28, and JM-42), each with one replicate, totaling 16 samples, as detailed in Table 2.
Sample scheme

Table 2. Long description
The table is divided into two sections per row. The left section lists samples J–7, J–14, J–28, and J–42, each with 100 mL medium, 5 mL bacteria solution, and interaction times of 7, 14, 28, and 42 days respectively. The right section lists paired samples JM–7, JM–14, JM–28, and JM–42, each with 100 mL medium, no bacteria solution (indicated by a dash), and matching interaction times of 7, 14, 28, and 42 days. Each row pairs a J sample with its corresponding JM sample, showing the experimental setup for both conditions.
The treated soil samples were prepared under sterile conditions by adding 5 mL of a pre-prepared bacterial suspension. These samples were sealed with breathable film and placed in an intelligent precision shaker, agitated at 30°C with a shaking speed of 150 rpm for 7, 14, 28, and 42 days. In contrast, the control samples were stored in a 30°C incubator. After the specified incubation periods, the inoculated samples were removed and centrifuged at 4000 rpm (1790×g) for 20 min. The supernatant was extracted and stored at 4°C. The resulting solid soil samples were dried and ground using a pestle and mortar for subsequent testing.
Elemental concentration
The total elemental concentration of Si, Al, Mg, and K in the supernatant was measured using an inductively coupled plasma optical emission spectrometer (ICP-OES, Agilent 5110). Variations in the concentrations of the analytes were indirectly correlated with the interaction of P. mucilaginosus with Mnt.
FTIR spectroscopy
The molecular groups present in the untreated and reacted soil samples were characterized using Fourier-transform infrared spectroscopy (FTIR, Thermo Scientific Nicolet Is50) with the spectral range set at 600–4000 cm–1 and a resolution of 4 cm–1. The changes in the vibration spectra were used to differentiate the mineral phases.
X-ray diffraction (XRD)
The ground soil samples were sieved through a 200-mesh sieve and analyzed using a powder X-ray diffractometer equipped with a CuKα1 radiation source (λ=0.154 nm) and a step size of 0.02°. The wide-angle XRD (German Bruker D8) was employed during the experiment, with a scanning range of 5–70° and a scanning speed of 5° min–1. The qualitative phase analysis was performed using the Materials Data Inc. JADE 9.0 software, and the percentage of clay minerals was determined using the K-value method (Southam, Reference Southam and Lovely2000; Zhang, Reference Zhang2021; Yao et al., Reference Yao, Kan, Wang and Yin2002).
The absolute content of an individual clay mineral was quantified by multiplying its relative percentage by the dry weight of the corresponding sample. The basic formula of the K-value method is as follows:

where
$ {X}_{\mathrm{j}}={X}_{\mathrm{s}}=0.5 $
 , and:

where I j represents the diffraction peak intensity of the phase j to be measured; I s is the diffraction peak intensity of the reference material; X j is the percentage content of the phase j in the measured substance; X s is the percentage content of the reference materials for the measured substance j; and K sj is the reference intensity of the measured substance j for the reference materials.
Swelling-shrinkage test of expansive soil
Paenibacillus mucilaginosus was mixed with the culture medium at a specific ratio and blended with expansive soil to achieve the optimal moisture content for the experiment. The mixture was then placed in a constant-temperature biochemical incubator at 35°C. After curing periods of 0, 7, 14, 28, and 42 days, samples were centrifuged at 4000 rpmn (1790×g) for 20 min and thus the supernatant and the solid soil particles were separated effectively.
The supernatant was used to measure carbonic anhydrase activity in soil samples following interaction with P. mucilaginosus by the p‑nitrophenol method (Armstrong et al., Reference Armstrong, Myers, Verpoorte and Edsall1966). In this method, p‑nitrophenol acetate served as the substrate. The absorbance of the enzymatically released p‑nitrophenol was measured at 400 nm, which is proportional to its concentration. A standard curve was prepared using p‑nitrophenol solutions of known concentration. The supernatant from the bacteria‑soil system, obtained after centrifugation and filtration, was used as the enzyme source. Under defined reaction conditions, the absorbance at 400 nm (OD400) was recorded, and enzyme activity was calculated based on the standard curve.
The solid samples were air-dried and sieved through a 2 mm sieve, and then prepared as ring knife samples with a height of 20 mm and a diameter of 61.8 mm. The samples were labeled as Blank, JC-7, JC-14, JC-28, and JC-42, with two parallel samples for each type. According to the GB/T50123-2019 standard, the free swell test, the confined swell test under a load of 50 kPa, and the shrinkage test were conducted on the samples.
Results
Variation of solution elements concentration
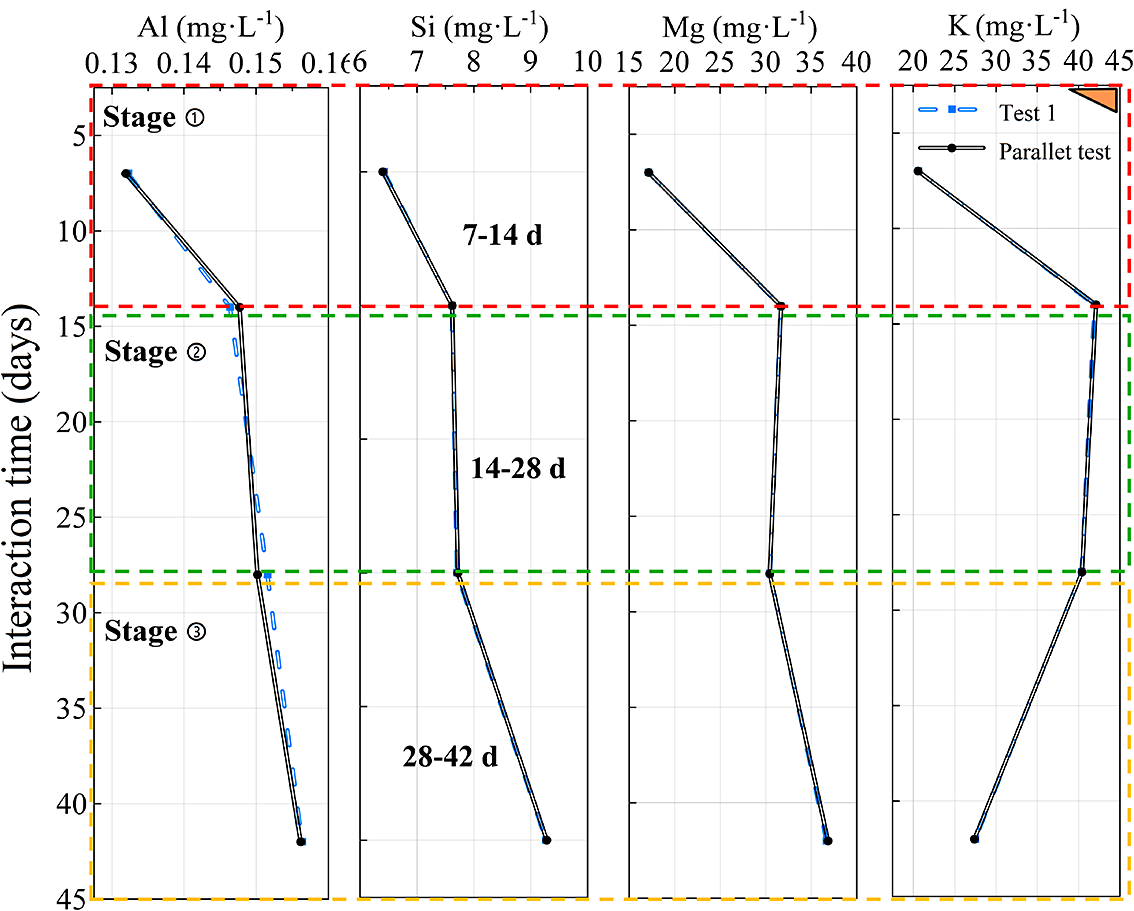
Given that Si, Al, K, and Mg constitute the primary elements in Mnt, the predominant hygroscopic mineral in expansive soils, the present study uses the leaching amounts of these elements in the supernatant as an indirect indicator (Fang et al., Reference Fang, JockChurchmanb, Hong, Chen, Liu, Yu, Han, Wang, Zhao and Furnes2017). The temporal changes in the concentrations of Si, Al, K, and Mg in the supernatant under the influence of P. mucilaginosus using ICP-OES are shown in Fig. 4.
Changes in elemental concentrations over time.

Figure 4. Long description
From left to right, the panels display concentrations of Al, Si, Mg, and K in milligrams per liter along the top x-axes. The shared y-axis on the left is labeled ‘Interaction time (days)' and ranges from 5 to 45. The y-axis is divided into three horizontal stages: Stage 1 (5–15 days, red dashed border), Stage 2 (15–30 days, green dashed border), and Stage 3 (30–45 days, yellow dashed border). In each panel, two lines are plotted: a blue dashed line for Test 1 and a solid black line for a Parallel test. Both lines follow nearly identical paths. In all panels, concentrations decrease sharply from 5 to 15 days, then decline more gradually from 15 to 45 days. The Si panel includes labels for 7–14 d, 14–28 d, and 28–42 d within the respective stages. A legend in the top right identifies the line styles for Test 1 and Parallel test.
The element-leaching process exhibited three distinct phases (Fig. 4): Stage 1 (7–14 days) was characterized by rapid leaching, during which the vigorous metabolism of P. mucilaginosus accelerated the release of metal; Stage 2 (14–28 days) represented a deceleration dissolution phase, marked by extensive ion exchange (e.g. Mg substitutes for Al in octahedral layers), resulting in minimal increases in elemental concentrations within the supernatant; Stage 3 (28–42 days) was the slow leaching phase, indicating a decrease in cation exchange capacity and implying gradual weathering of Mnt minerals. As the interaction time between microorganisms and clay minerals increased, the concentrations of Si, Al, K, and Mg in the supernatant increased compared with the initial values, with Al and Si concentrations continuing to increase with prolonged interaction.
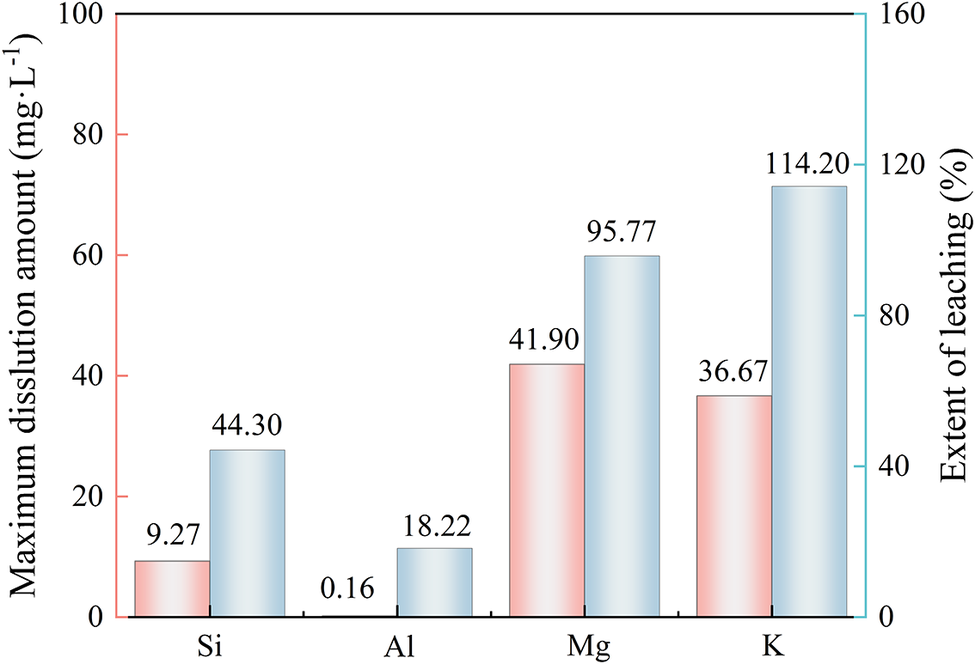
This indicated that P. mucilaginosus facilitated the release of Si and Al, thereby altering the original mineral lattice structure. The total K peaked at 14 days and decreased subsequently, with a reduction of 14.4 mg L–1 by 42 days compared with the 14-day interaction sample. This suggested that K had entered the interlayer space of the Mnt minerals, thereby reducing the element concentration in the supernatant, and indicating partial transformation of Mnt to Ilt. To quantify the influence of bacterial strains on elements in the soil samples, the extent of leaching and maximum dissolution amount of different elements in the supernatant were compared, as depicted in Fig. 5.
Maximum amount of dissolution and the extent of leaching in the supernatant.

The dissolution of Al by P. mucilaginosus was minimal (18.22%), whereas Si dissolution reached 44.3%. This indicated a more pronounced Si dissolution, suggesting that P. mucilaginosus has a greater impact on Si–O bonds in the clay mineral tetrahedral sheet than on the Al–O bonds in the octahedral sheet (Farmer, Reference Farmer1974; Afify, Reference Afify2022). Mg and K exhibited greater degrees of dissolution, 114.20% and 95.77%, respectively, attributed to the K-releasing action of P. mucilaginosus , which liberates substantial K from the soil. The influence of P. mucilaginosus on the dissolution of Si, Al, K, and Mg in expansive soil is ranked as Mg>K>Si>Al. This dissolution alters the elemental composition of the mineral structure, potentially leading to structural degradation or phase transformation and reducing the Mnt content in expansive soil.
Variation of pH value
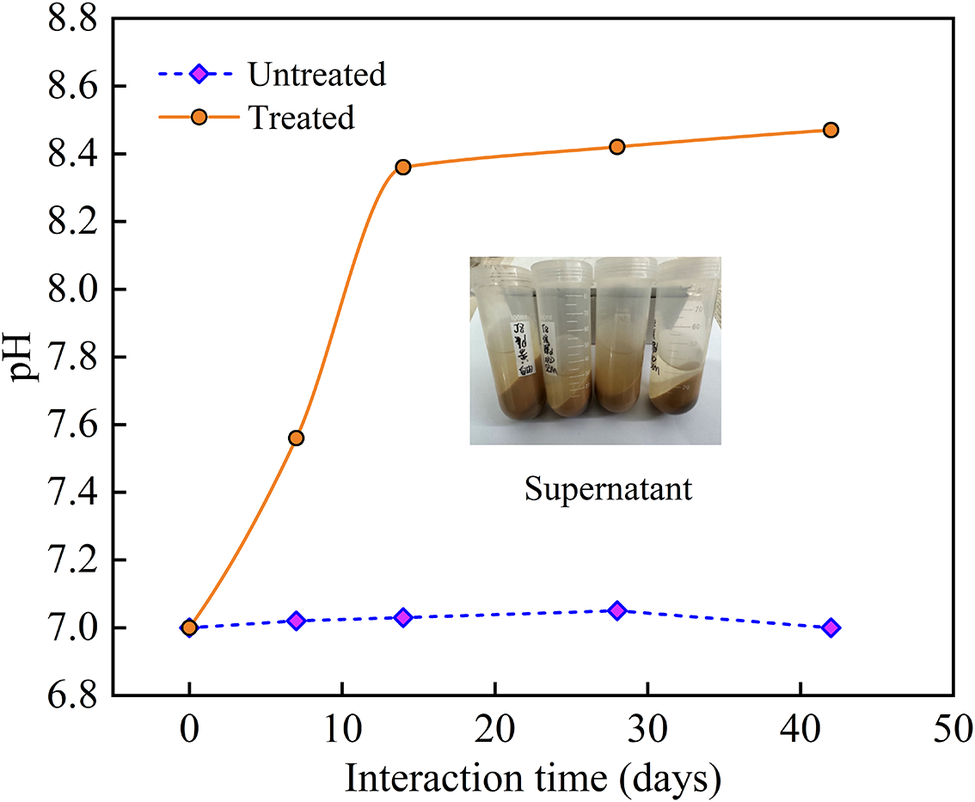
The temporal pH curve (Fig. 6) showed that the pH value of the solution system treated with P. mucilaginosus increased continuously from pH 7.0 to 8.45 but that of the control samples remained neutral.
Changes in pH value with interaction time.

Figure 6. Long description
The x axis is labeled Interaction time in days, ranging from 0 to 45. The y axis is labeled p H, ranging from 6.8 to 8.8. Two data series are plotted: Treated, shown as an orange solid line with circles, starts at p H 7.0 at day 0, rises steeply to about p H 8.4 by day 15, then levels off near p H 8.6 through day 40. Untreated, shown as a blue dashed line with diamonds, remains nearly flat around p H 7.0 throughout the time course. At the graph center is a photo of four transparent tubes containing brownish liquid, labeled as supernatant.
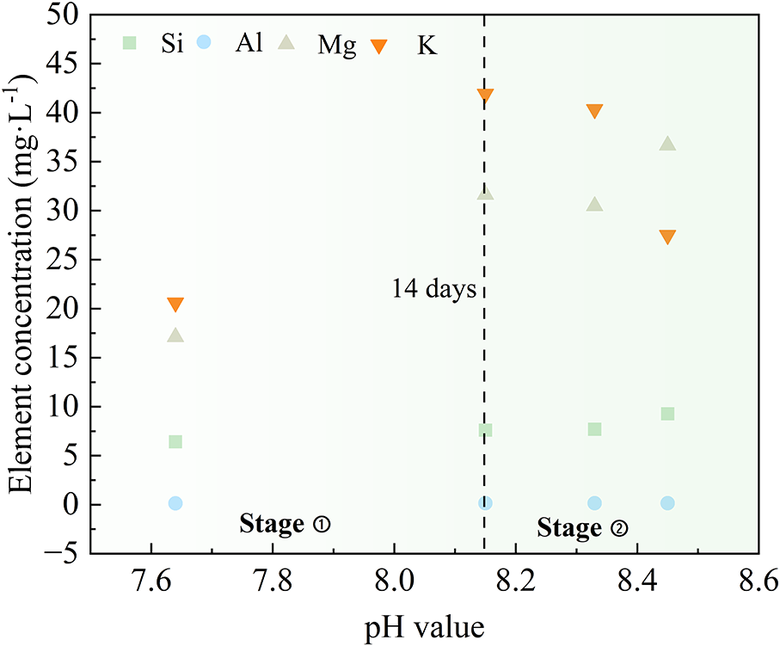
As the interaction time between P. mucilaginosus and soil increased, the organic acids produced by the bacteria and the hydrolysis of released elements (e.g. Si and Al) reduced the solution pH. However, the transformation of Mnt into Ilt consumes acid, resulting in an increase in the pH of the supernatant over time (Tian et al., Reference Tian, Wu, Sun and Qi2017). Additionally, carbonic anhydrase secreted by P. mucilaginosus generates CO2, leading to bicarbonate ion formation in the bacterial solution (Dai et al., Reference Dai, Wang, Zhao, Xu, Dang and Wang2023). The hydrolysis of bicarbonate elements dominates over ionization, yielding a weakly alkaline solution. The hydroxylation on clay-mineral surfaces enhanced the dissolution rate of these elements, promoting mineral structure changes. As shown in Fig. 7, the concentrations of Si, Al, and Mg in the supernatant increased with pH, while K concentration decreased after 14 days. The interaction between P. mucilaginosus and expansive soil can be divided into two stages.
Correlation between element concentration and pH in the supernatant.

Figure 7. Long description
The x axis is labeled pH value, ranging from 7.6 to 8.6. The y axis is labeled element concentration in milligrams per liter, ranging from minus 5 to 50. Four elements are shown: Si as green squares, Al as blue circles, Mg as gray triangles, and K as orange downward triangles. A vertical dashed line at pH 8.2 marks 14 days, dividing the plot into Stage 1 on the left and Stage 2 on the right. In Stage 1, K and Mg concentrations are higher, with K at about 20 and Mg at about 18 milligrams per liter, while Si and Al are below 10. In Stage 2, K and Mg concentrations increase, with K reaching about 40 and Mg about 35 milligrams per liter, while Si and Al remain low. Data points for Si and Al are scattered near the bottom of the plot in both stages. The legend at the top identifies each element by symbol and color.
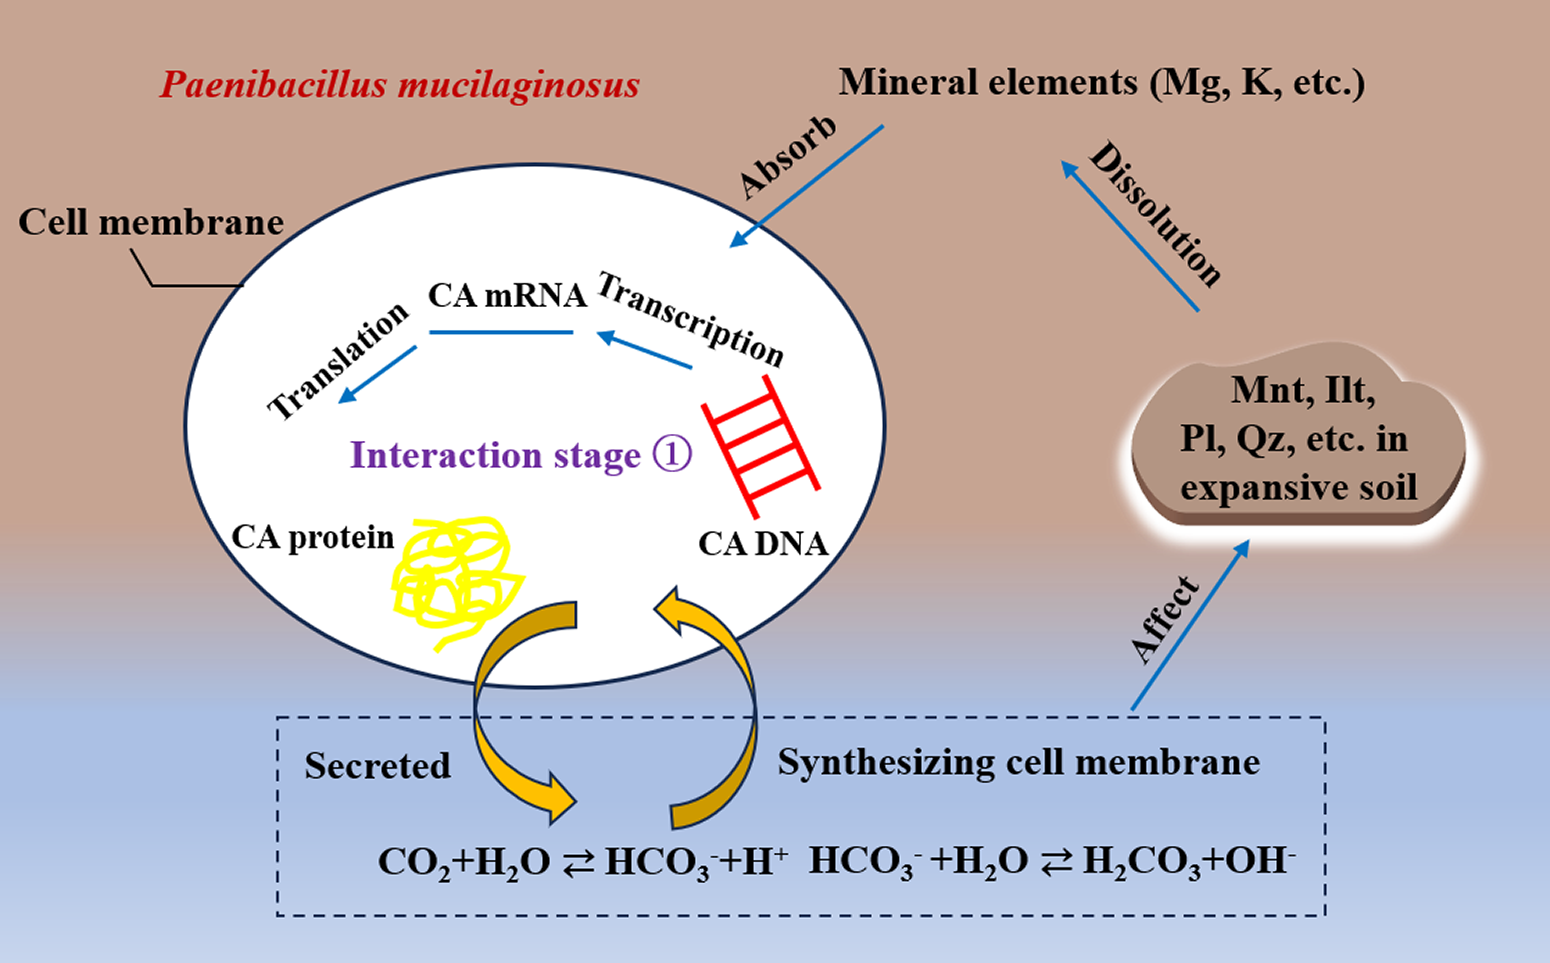
In the first stage (0–14 days), carbonic anhydrase (CA) produced by P. mucilaginosus catalyzed bicarbonate formation from CO2. Bicarbonate participated in the synthesis of the bacterial cell membrane, enhancing membrane fluidity and facilitating ion absorption, leading to the release of Mg and K from expansive soil (Fig. 8).
Schematic diagram of the interaction process between carbonic anhydrase (CA) and minerals.

Figure 8. Long description
At the center is an oval cell labeled Paenibacillus mucilaginosus, with the cell membrane marked on the left. Inside, CA D N A is shown on the right, CA m R N A at the top, and CA protein on the left. Arrows indicate transcription from CA D N A to CA m R N A, and translation from CA m R N A to CA protein. The phrase Interaction stage 1 is centrally placed. Below, two curved arrows connect the cell interior to a boxed region at the bottom, labeled Secreted and Synthesizing cell membrane. This box contains the chemical equation C O sub 2 plus H sub 2 O yields H C O sub 3 minus plus H plus; H C O sub 3 minus plus H sub 2 O yields H sub 2 C O sub 3 plus O H minus. Outside the cell, at the top right, a cloud shape lists Mnt, Ilt, Pl, Qz, etc. in expansive soil. Arrows labeled Absorb and Dissolution connect mineral elements (M g, K, etc.) to the cell and soil minerals. Another arrow labeled Affect points from the cell to the soil minerals, indicating feedback. The diagram illustrates the molecular and environmental interactions of carbonic anhydrase in soil.
As reported by Eberl et al. (Reference Eberl, Velde and McCormick1993), the transformation of 1 mol of Mnt into Ilt consumes 0.50 mol of protons (H) and 0.45 mol of K. The decline in K concentration with increasing pH after 14 days suggested that under alkaline conditions, cation concentration and exchange partially transformed Mnt in expansive soil. Specifically, the interstratified Ilt-Mnt minerals converted to Ilt, thereby reducing the original Mnt content in expansive soil. This process is depicted in Stage 2 (14–42 days) in Fig. 6.
FTIR analysis of expansive soil samples
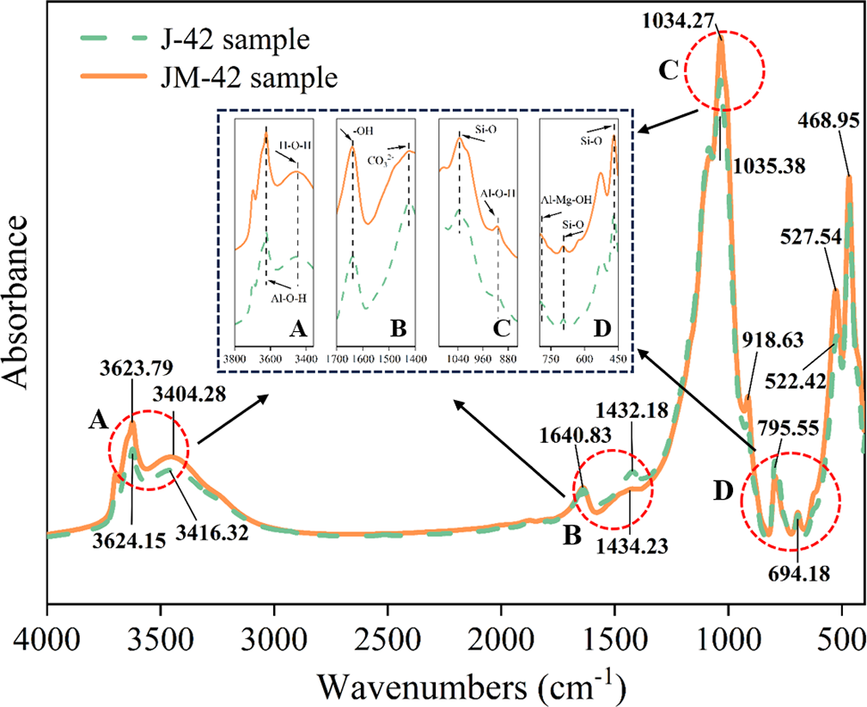
Infrared spectroscopy analysis of samples J-42 and JM-42 (Fig. 9) identified key absorption peaks. The peak near 3620 cm–1 corresponded to the stretching vibrations of Al-O-H in Mnt, while the peak at 3400 cm–1 was attributed to the stretching vibrations of H–O–H in interlayer water molecules of Mnt. In the mid-infrared region, the peak at 1037 cm–1 indicated the asymmetric stretching vibrations of Si–O–Si bonds present in Mnt, as well as minor contributions from feldspar and quartz (Zhu et al., Reference Zhu, Ding, Li, Li, Xu and Lu2019). The peak at 1635 cm–1 resulted from H–O–H bending vibrations in interlayer water molecules. The peak at 795 cm–1 signified Si–O–Si bond vibrations, while the peak at 918 cm–1 was closely related to Al–O–H bonds in Mnt (Farmer, Reference Farmer1974; Peng and Liu, Reference Peng and Liu1983; Chukanov and Chervonnyi, Reference Chukanov and Chervonnyi2016). The intensity and wavenumber position of the 918 cm–1 peak were sensitive to variations in the Mg and Al content in the octahedral layer: an increase in Mg shifted the peak to higher wavenumbers, and a decrease in Al reduced peak intensity (Peng and Liu, Reference Peng and Liu1983).
Infrared spectra of the soil samples.

Figure 9. Long description
The x axis shows wavenumbers from 4000 to 400 cm super minus 1, and the y axis is absorbance. Two lines represent J 42 (green dashed) and J M 42 (orange solid) samples. Major peaks are labeled: near 3623.79, 3624.15, 3416.32, and 3404.28 cm super minus 1 (region A); 1640.83, 1432.18, and 1434.23 cm super minus 1 (region B); 1034.27 and 1035.38 cm super minus 1 (region C); and 918.63, 795.55, 694.18, 527.54, 522.42, and 468.95 cm super minus 1 (region D). Four inset panels at the center highlight regions A to D, showing detailed spectral features and annotated functional groups: Al dash O dash H, O H, C O sub 2, Si dash O, Al dash Mg dash O H. The J M 42 sample generally shows greater absorbance and more pronounced peaks than J 42, especially in regions C and D.
Comparison of the IR spectra between the experimental group (J-42) and control group (JM-42) showed consistent absorption peaks at 1640 cm–1, 795 cm–1, 694 cm–1, and 468 cm–1, corresponding to bending vibrations of -OH in water molecules, Al-Mg-OH, and stretching vibrations of Si–O in quartz and SiO2. The peak at 1034 cm–1 (Si–O–Si stretching in tetrahedral structures) shifted to 1035 cm–1 in J-42, indicating potential disruption of Si–O bonds in Mnt tetrahedral layers by P. mucilaginosus , consistent with observed Si concentration. The hydroxyl (-OH) peak at 3623 cm−1 in JM-42 shifted to 3624 cm−1 in J-42, while the carbonate-related peak at 1434 cm−1 in JM-42 migrated to 1432 cm−1 in J-42. These shifts suggested carbonate precipitation (e.g. MgCO3, CaCO3) induced by CA from P. mucilaginosus. Peaks near 3404 cm−1 and 3623 cm−1 in J-42 exhibited decreased intensity compared with JM-42, indicating changes in interlayer cations of Mnt. The reduced intensity at 918 cm−1 in J-42, relative to JM-42, reflects decreased Al content in Mnt, corroborated by ICP-OES results showing Al concentration in the supernatant after P. mucilaginosus action.
XRD analysis of the expansive soil sample
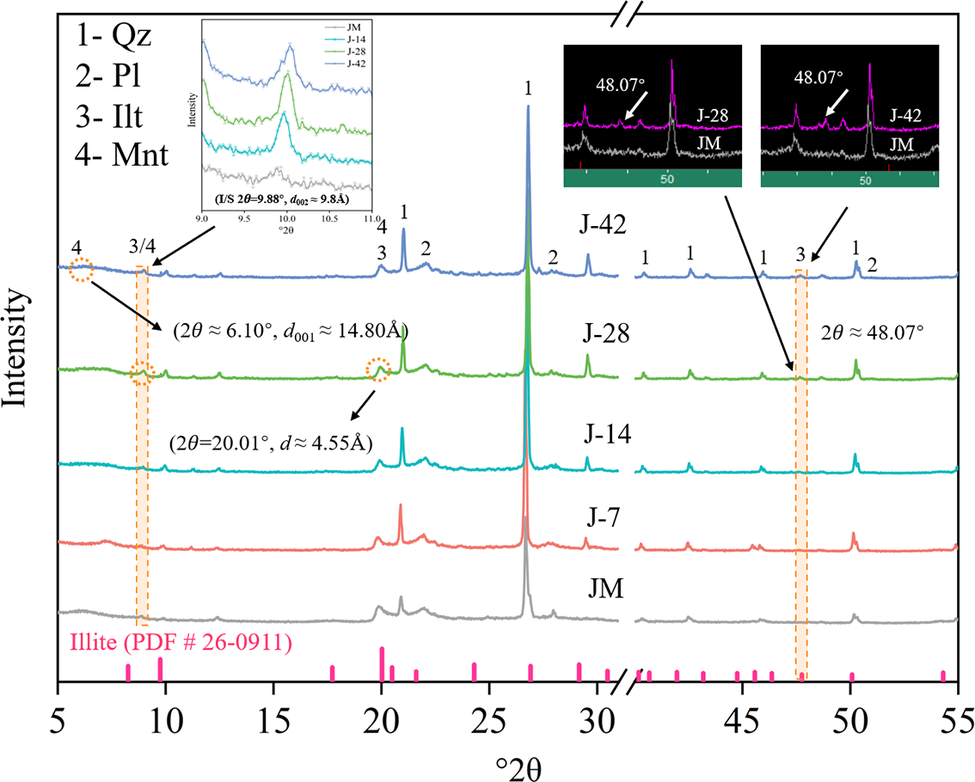
The XRD patterns of the samples in Fig. 10 revealed the changes in the phases and contents of clay minerals in the expansive soil under the action of P. mucilaginosus.
XRD patterns of the soil samples.

Figure 10. Long description
From bottom to top, five stacked line graphs labeled J M, J-7, J-14, J-28, and J-42 plot intensity versus 2 theta from 5 to 55 degrees. The x axis is labeled 2 theta and the y axis is intensity. Major peaks are marked with numbers 1 to 4, corresponding to Q z, P l, I l t, and M n t, as defined in the legend at the top left. Pink tick marks below the x axis indicate illite reference positions (P D F number 26-0911). Orange dashed lines and circles highlight key peaks at approximately 6.10 degrees (d sub 0 0 1 is approximately 14.80 angstroms), 20.01 degrees (d is approximately 4.55 angstroms), and 48.07 degrees. Arrows point from these annotations to the relevant peaks. The top left inset shows a zoomed region from 9.0 to 10.5 degrees for all samples, with intensity on the y-axis and 2 theta on the x-axis, and the equation J/S 2 theta equals 9.88 degrees, d sub 0 0 2 equals 9.8 angstroms. Two insets at the top right compare J 28 and J 42 to J M at 48.07 degrees, with arrows indicating the peak positions. The overall trend shows consistent peak positions across samples, with variations in intensity and minor shifts in some peaks.
Comparison of samples from experimental group J and control group JM indicated that the main phases in control samples were quartz, plagioclase, Ilt, and Mnt. The diffraction patterns of expansive soil samples post-microbial treatment align with those of the control samples. Relative to the standard pattern (pdf#26-0911), samples J-28 and J-42 exhibit a weak diffraction peak near 48.07°2θ, characteristic of Ilt. In contrast, samples J-7 and J-14 were in a transitional stage from Mnt to Ilt. Additionally, a new diffraction peak near 9.88°2θ (d spacing≈10 Å) were observed in samples J-14, J-28, and J-42, consistent with the typical diffraction peak position of Ilt and also close to the 002-crystal plane index of Mnt. This peak suggested the presence of Ilt/Mnt interlayer minerals, indicating a transition of Mnt to Ilt.
Effect of bacteria on the amounts of mineral components in expansive soil
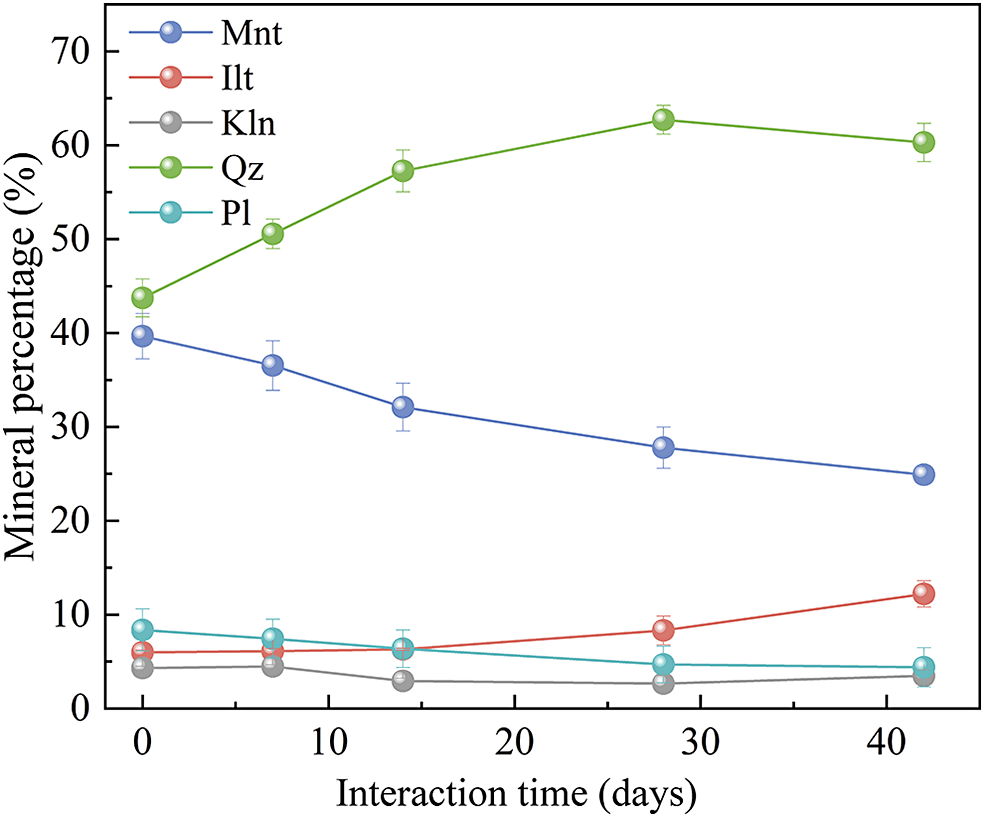
The K-value method was employed for quantitative analysis of the XRD, with mineral-content data presented in Fig. 11.
Temporal changes in mineral contents of the sample.

Figure 11. Long description
The graph plots mineral percentage on the y axis from 0 to 70 percent and interaction time in days on the x axis from 0 to 42. Five minerals are represented: Mnt (blue), Ilt (red), Kln (gray), Qz (green), and Pl (cyan). Qz starts at about 43 percent, rises to about 62 percent by day 28, then slightly decreases to 60 percent at day 42. Mnt begins at 40 percent and steadily declines to about 28 percent. Pl starts near 9 percent, decreases to about 6 percent by day 42. Kln remains nearly constant around 5 percent throughout. Ilt starts at about 4 percent and gradually increases to 10 percent by day 42. Error bars are present for each data point.
Figure 11 shows a progressive decrease in Mnt content from 39.67% to 24.88% over the 42-day experimental period. The Ilt content remained stable at 7 days but subsequently increased by 104.01% after 42 days compared with the control sample. This trend of decreasing Mnt and increasing Ilt confirmed the Mnt to Ilt transformation, corroborated by the Ilt diffraction peak at 48.07°2θ after 42 days. This was consistent with FTIR results showing shifts and reductions in absorption peaks near 3404 cm–1 and 3623 cm–1 in sample J-42, indicating changes in the interlayer cations of Mnt in expansive soil.
The temporal variation curve of mineral content indicates a continuous decline in plagioclase content, while the kaolinite content remained relatively stable, with a slight increase observed in sample J-42 compared with J-28, probably due to plagioclase weathering. Quartz content exhibited an upward trend at 28 days, attributed here to the formation of Ilt/Mnt interlayer minerals during Mnt weathering, accompanied by the generation of kaolinite (or dickite) and quartz. This reflects significant transformation of Mnt into transitional Ilt/Mnt interlayer minerals, with Ilt formation resulting from K substitution in these interlayer minerals. Comparative analysis of mineral content at various stages reveals that Mnt, Ilt, and quartz are most significantly affected by P. mucilaginosus activity.
Swelling-shrinkage analysis of expansive soil
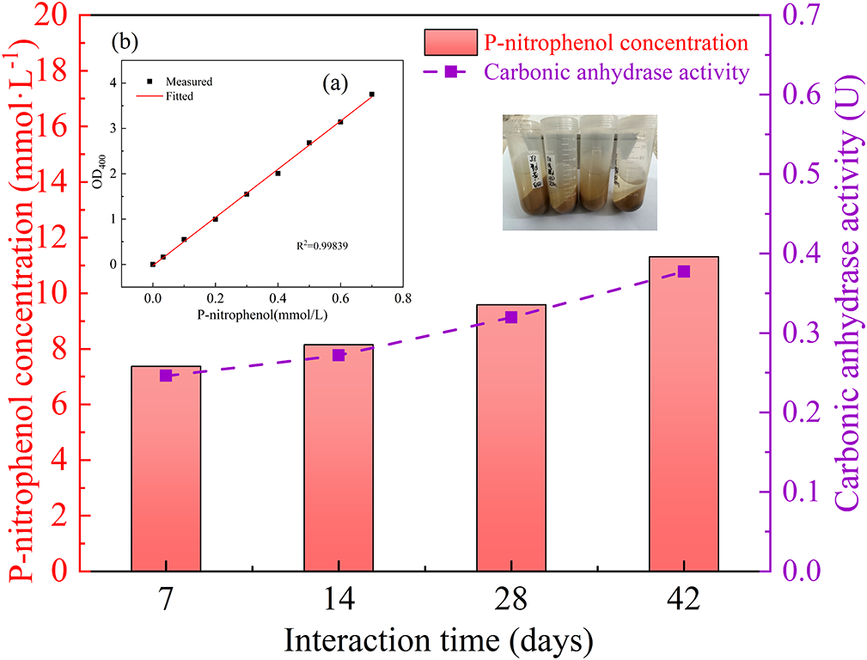
The present study evaluated systematically the swelling and shrinking rates of expansive soil samples at various stages of bacterial treatment and assessed bacterial activity based on the determination of CA activity. The standard curve plotted using p-nitrophenol solutions of known concentrations (R 2>0.99) is shown in Fig. 12a; part b of the same figure illustrates the temporal variations in p-nitrophenol concentration and CA activity after interaction periods of 7, 14, 28, and 42 days.
Temporal variations in p-nitrophenol concentration and carbonic anhydrase activity.

Figure 12. Long description
The main graph has interaction time in days (7, 14, 28, 42) on the x axis. The left yaxis, labeled in red, shows p-nitrophenol concentration from 0 to 20 millimoles per liter. The right y axis, labeled in purple, shows carbonic anhydrase activity from 0.0 to 0.7 units. Red gradient bars represent p-nitrophenol concentration, increasing from about 7 at day 7 to about 13 at day 42. A purple dashed line with square markers represents carbonic anhydrase activity, rising from about 0.28 units at day 7 to about 0.4 units at day 42. The legend at the top right identifies the red bars as p-nitrophenol concentration and the purple dashed line as carbonic anhydrase activity. At the top left, an inset labeled (a) shows a scatter plot of measured versus fitted OD 400 values for p-nitrophenol concentrations from 0 to 0.7 millimoles per liter, with a linear fit (R squared equals 0.99839). Above the inset is a photo of four labeled sample tubes containing brownish liquid.
As shown in Fig. 12b, the concentration of p-nitrophenol in the supernatant increased progressively from 7.381 mmol L−1 at 7 days to 11.318 mmol L−1 at 42 days. This trend reflected the gradual enhancement of CA activity in the supernatant, increasing from 0.246 U (U, a measurement unit for enzyme activity, 1 U=1 μmol min−1) at 7 days to 0.377 U at 42 days, representing a 53.25% increase. Although these findings do not directly confirm that P. mucilaginosus maintained high metabolic activity throughout the incubation period, they suggest indirectly the bacterium’s persistent contribution to the weathering of clay minerals in the expansive soil from day 0 to day 42.
Consequently, the promoting effect of P. mucilaginosus on the transformation of Mnt to Ilt intensified over the bacteria–soil interaction period (0, 7, 14, 28, and 42 days). This process can be described by a first-order kinetic equation, the integral form of which is:

where a represents the initial percentage of Mnt in the expansive soil; and x denotes the Mnt content transformed into Ilt after t days.
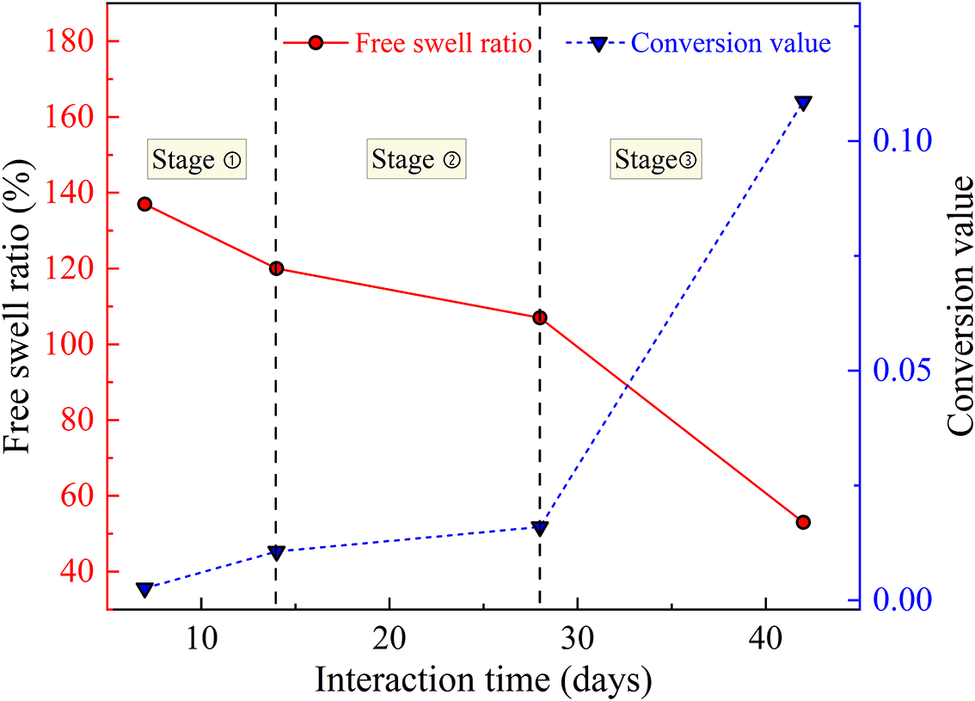
Experimental analysis indicated an initial Mnt content of 35.9% in the expansive soil sample. Figure 13 showed that during the initial microbial action stage (7–14 days), the free swelling rate decreased gradually due to cation exchange, converting Mnt into disordered Ilt-Mnt interstratified minerals. In the second stage (14–28 days), the transformation rate slowed as Ilt formed and most clay minerals existed as Ilt-Mnt interstratified minerals, resulting in a steady decline in the free swelling rate. In the final stage (28–42 days), the transformation accelerated, with substantial Mnt depletion and K entering the interlayers. The free swelling rate decreased from 171 to 53% after 42 days, representing a 60.01% reduction.
Temporal variation of free swell ratio of soil samples and conversion value of mineral.

Figure 13. Long description
The graph has two y axes: the left y axis is labeled free swell ratio in percent, ranging from 40 to 180, and the right y axis is labeled conversion value, ranging from 0.00 to 0.10. The x axis is interaction time in days, with data points at approximately 8, 18, 28, and 40 days. Three vertical dashed lines divide the graph into Stage 1, Stage 2, and Stage 3. The red solid line with circles represents free swell ratio, starting at about 140 percent at 8 days, decreasing to about 120 percent at 18 days, then to about 110 percent at 28 days, and finally to about 60 percent at 40 days. The blue dashed line with downward triangles represents conversion value, starting near 0.01 at 8 days, rising slightly to about 0.03 at 18 days, remaining nearly flat at 28 days, then sharply increasing to about 0.10 at 40 days. The two trends show an inverse relationship, with free swell ratio decreasing as conversion value increases across the three stages.
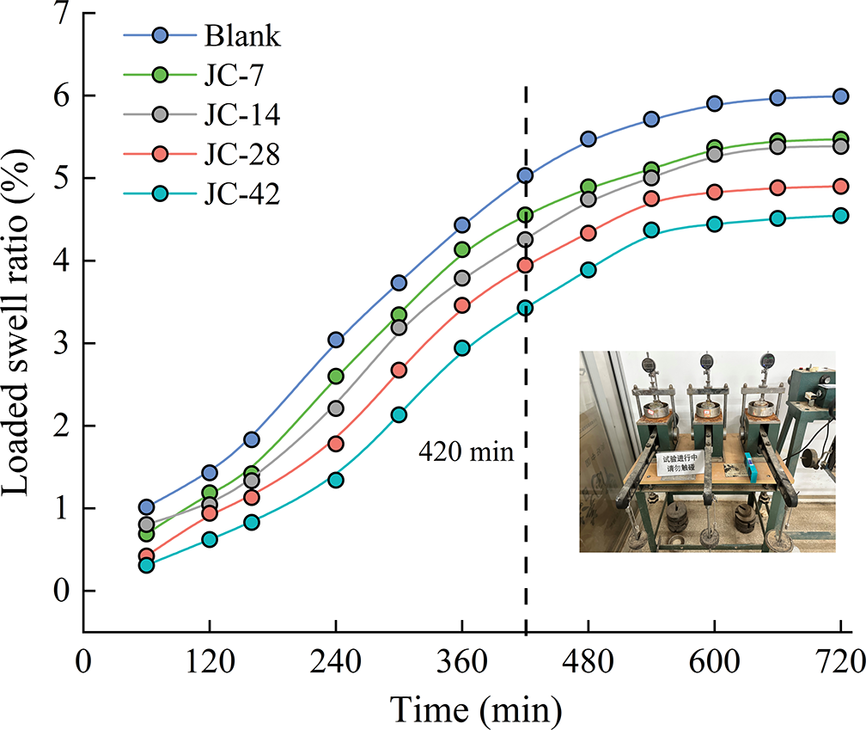
The temporal variation of the loaded swell ratio of both untreated and bacteria-treated expansive soil samples (Fig. 14) demonstrated rapid swelling within the first 420 min after stabilization and water injection. Subsequently, the loaded swelling rate increased gradually until stabilization, forming an S-shaped swelling-time curve. The loaded swelling rate decreased with increasing bacterial action time. After 42 days of interaction with P. mucilaginosus , the loaded swelling rate decreased from 5.99 to 4.55% (a 24.04% reduction). This reduction was attributed to the transformation of Mnt into Ilt by P. mucilaginosus , which decreased the Mnt content and swelling potential of the soil.
Temporal variation of the loaded swell ratio of the samples.

Figure 14. Long description
The x axis is labeled Time in minutes, ranging from 0 to 720. The y axis is labeled Loaded swell ratio in percent, ranging from 0 to 7. Five colored lines represent Blank (blue), J C-7 (green), J C-14 (gray), J C-28 (red), and J C-42 (cyan). All lines show a nonlinear increase, steepest before 420 minutes, then plateauing. At each time point, Blank is highest, followed by J C-7, J C-14, J C-28, and J C-42 lowest. At 420 minutes, a dashed vertical line marks a transition. Data at 720 minutes: Blank reaches about 6.7 percent, J C-7 about 5.5 percent, J C-14 about 5 percent, J C-28 about 4.5 percent, J C-42 about 4 percent. In the lower right, an inset photo shows three identical laboratory swelling test devices with metal frames and dials, labeled in Chinese.
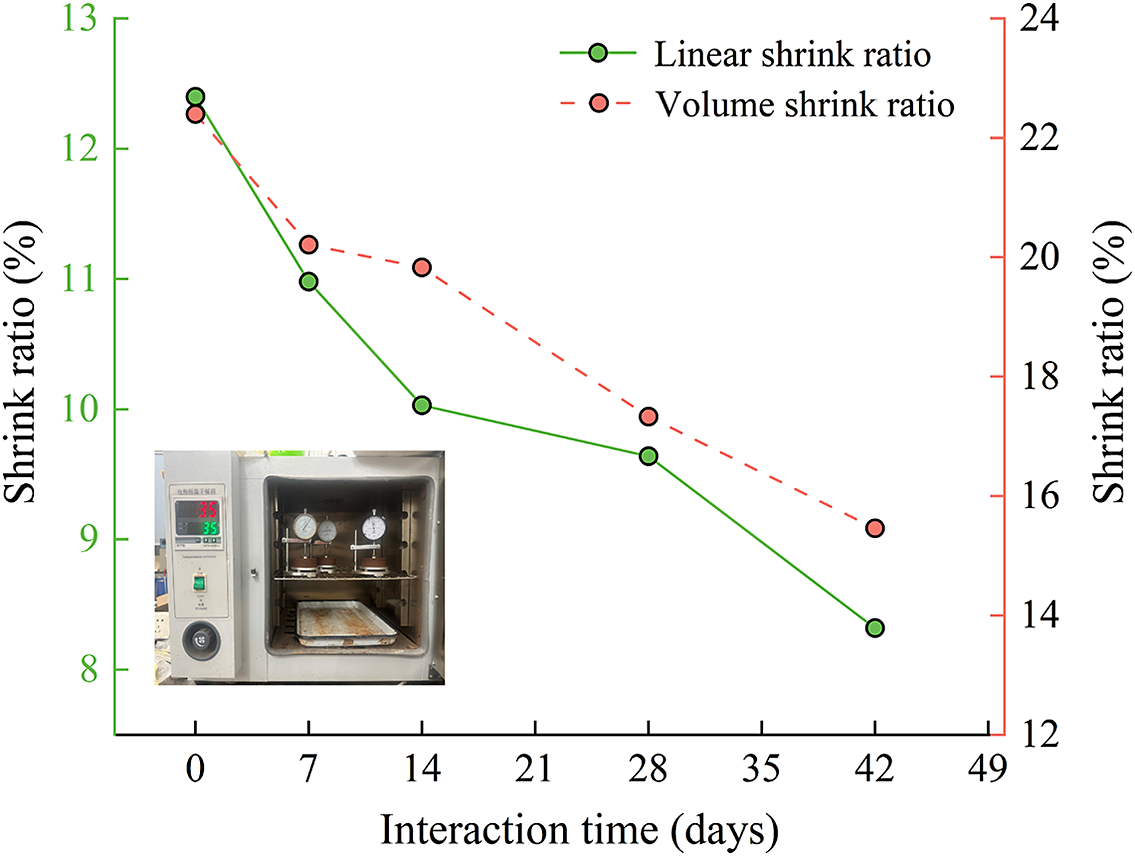
The shrinkage deformation of expansive soil was characterized by the linear shrinkage ratio and volumetric shrinkage ratio. Expansive soil samples treated with P. mucilaginosus exhibited (Fig. 15) significant reductions in shrinkage deformation. Specifically, the linear shrinkage ratio of the JC-42 sample treated for 42 days decreased by 32.90%, while the volumetric shrinkage ratio decreased by 30.98%. These reductions are attributed to the decreased amount of the hydrous Mnt in the samples, which improved the shrinkage behavior of the expansive soil.
Temporal variation of the shrink ratio of the samples.

Figure 15. Long description
The x-axis at the bottom is labeled Interation time in days, with tick marks at 0, 7, 14, 21, 28, 35, 42, and 49. The left y-axis, in green, is labeled Shrink ratio percent, ranging from 8 to 13. The right y-axis, in red, is also labeled Shrink ratio percent, ranging from 12 to 24. Two data series are plotted: the green solid line with circles represents Linear shrink ratio, starting at about 12.5 percent at day 0 and decreasing steadily to about 8.5 percent at day 42. The red dashed line with circles represents Volume shrink ratio, starting at about 12.5 percent at day 0 and decreasing to about 15.5 percent at day 42, with a less steep decline than the linear shrink ratio. Both series show a general downward trend. The legend in the upper right identifies the lines. In the lower left corner, an inset photo shows a laboratory oven with two pressure gauges and a tray inside.
Discussion
The swelling and shrinking characteristics of expansive soil are primarily attributed to the large proportion of hydrophilic Mnt minerals. Although microbial-induced calcite precipitation (MICP) can effectively control these properties (Wei et al., Reference Wei, Zhang, Xiao, Yan and Wang2023), it faces limitations such as poor calcium ion deposition control and long-term stability issues. Moreover, the calcite produced is susceptible to weathering over time. Therefore, reducing the Mnt content in expansive soil to mitigate its swelling and shrinking properties is a promising research direction.
Mnt, a layered silicate mineral, typically transforms into Ilt or collapses under high temperatures (300–500°C) and pressures (100 MPa) or through prolonged natural weathering (Eberl and Hower, Reference Eberl and Hower1976; Eberl et al., Reference Eberl, Velde and McCormick1993). However, microbial action can bypass these conditions by reducing Fe(III) to Fe(II) in Mnt, disrupting its structure and accelerating its transformation into Ilt (Kim et al., Reference Kim, Dong, Yang, Park, Elliott, Spivack and Heuer2019; Zhang et al., Reference Zhang, Kim, Dong and Sommer2007). In this study, P. mucilaginosus accelerated the structural changes and transformation of Mnt into Ilt at room temperature and 1 atmosphere pressure. This bacterium, known for its phosphate- and potassium-releasing abilities, promoted the release of K from expansive soil. K concentration initially increased and then decreased after microbial action (Fig. 4), indicating that K was released from the soil and subsequently fixed within the mineral layers. Microbial action led to a decrease in Mnt content and an increase in Ilt content (Fig. 11), confirming ion recombination and the transformation of Mnt into Ilt. The present study observed that P. mucilaginosus weathers Mnt by gradually penetrating from the surface inward, leaving evident traces of microbial activity (Fig. 5). Current research suggests that P. mucilaginosus interacts with minerals by secreting extracellular polymers and organic acids, creating an acidic environment that alters the structure of pure Mnt ore powder (Zhu et al., Reference Zhu, Li, Lu, Wang, Yang, Wang and Pan2011b). However, experimental results (Fig. 6) indicate that as microbial action time increases, the pH of the sample supernatant rises to a weakly alkaline level. This difference is attributed to the distinct growth environments when interacting with pure Mnt ore powder versus expansive soil (Xiao and Lian, Reference Xiao and Lian2015). In expansive soil, pores facilitate microbial exchange with the external environment, and carbonic anhydrase (CA) produced by P. mucilaginosus fixes atmospheric CO2, maintaining a weakly alkaline interaction environment conducive to the transformation of Mnt into Ilt (Boles and Franks, Reference Boles and Franks1979; Huang et al., Reference Huang, Longo and Pevear1993; Zhu et al., Reference Zhu, Li, Lu, Wang, Yang, Wang and Pan2011b).
Previous studies employed MICP using bacteria such as Bacillus megaterium and Bacillus pasteurii to effectively reduce the swelling and shrinking rates of expansive soil (Su et al., Reference Su, Xiao, Li, Tian, Luo, Yu and Ouyang2022). MICP enhances soil tensile strength by producing urease, which catalyzes urea hydrolysis to form carbonate ions. These ions react with calcium ions to create calcium carbonate precipitates, binding soil particles and mitigating swelling and shrinking behavior (Zhang et al., Reference Zhang, Shi, Chen, Huo and Yu2021; Baidya et al., Reference Baidya, Dahal, Pandit and Joshi2023; Sang et al., Reference Sang, Lunn, El Mountassir and Minto2023; Zeitouny et al., Reference Zeitouny, Lieske, Alimardani Lavasan, Heinz, Wichern and Wichtmann2023). In this study, P. mucilaginosus was used to improve expansive soil. The bacterium induces ion release from Mnt through ion exchange and lattice substitution, altering its structure. In addition, it releases potassium ions that enter Mnt layers, accelerating the transformation into Ilt. This reduces the amount of hydrophilic Mnt, thereby reducing the soil’s swelling and shrinking rates. The current experimental results intuitively and quantitatively reflect the influence of P. mucilaginosus on the minerals in expansive soil, thereby effectively improving the significant swelling and shrinkage properties of expansive soil. We have not yet considered other formation conditions of Ilt, which is a very important direction for future interdisciplinary research.
Conclusions
The experimental results of the present study indicate that P. mucilaginosus can facilitate the transformation of Mnt into Ilt, thereby decreasing the Mnt content in expansive soils and mitigating their swelling and shrinking tendencies. The main findings from the paper are summarized as follows:
-
(1) In expansive soil treated with P. mucilaginosus , Si, Al, K, and Mg release increased over time, with rates of Mg>K>Si>Al. K release peaked at 41.9 mg L⁻¹ at 14 days, then declined to 27.5 mg L⁻¹ at 42 days, suggesting K+ entered Mnt interlayers after 14 days of bacterial action.
-
(2) Infrared spectroscopy of expansive soil samples treated with microorganisms for 42 days showed reduced Al content in Mnt compared with controls. The Si-O in the tetrahedral layer of the Mnt structure, Al-O bonds in the octahedral structure and -OH bonds in water molecules, along with principal cations, were also affected.
-
(3) XRD analysis showed an Ilt-Mnt interstratification peak at 9.88°2θ in all treated soil samples. Weak Ilt peaks appeared at 48.07°2θ in samples treated for 28 days and 42 days. The Mnt content decreased by 37.28%, and the Ilt content increased by 104.01% compared with control samples, indicating Ilt formation from Mnt transformation.
-
(4) Analysis of expansive soil samples treated with P. mucilaginosus showed S-shaped load-induced swelling rate curves, stabilizing after 420 min. Samples treated for 42 days had a swelling-rate reduction of 24.04%, from 5.99% to 4.55%. The free swelling rate decreased from 171% to 53% over 42 days, a 60.01% drop. Linear and volumetric shrinkage rates decreased by 32.90% and 30.09%, respectively. The swelling and shrinking potential of expansive soil mixed with P. mucilaginosus was improved.
Data availability statement
The data supporting the plots in this paper and other findings of this study are available from the corresponding author upon reasonable request.
Acknowledgments
The authors are grateful to the Institute of Geotechnical Engineering, Central South University of Forestry and Technology, China.
Author contribution
Zhenyu Li: Conceptualization, Resources, Writing- Original draft, methodology. Shijie Shan: Methodology, Investigation, Formal analysis, Writing- review and editing. Kun Lin and Hang Zhu: Investigation, sample preparation, mineral characterization tests (XRD, FTIR, ICP-OES), Data curation.
Financial support
This research was funded by the Natural Science Foundation of Hunan Province, China (Project No. 2023JJ31008) and the National Science Foundation of China (Project No. 51608545).
Competing interests
The authors declare no competing interests.