Introduction
Pumpellyite-group minerals are neso-sorosilicate (Gottardi, Reference Gottardi1965) with a chemical formula of VIIW 8VIX 4VIY 8IVZ 12O56–n(OH)n (Z = 1), where W represents cations at the seven-coordinated site, such as Ca2+, K+ and Na+; X denotes divalent and trivalent cations at the octahedral site with larger site volume; Y represents trivalent cations at the octahedral sites with smaller site volume; and Z is tetrahedral Si4+ cations (Passaglia and Gottardi, Reference Passaglia and Gottardi1973). The root name of the pumpellyite-group mineral is determined based on the most dominant trivalent cation in the Y site (Passaglia and Gottardi, Reference Passaglia and Gottardi1973): pumpellyite (with AlY) (Palache and Vassar, Reference Palache and Vassar1925), julgoldite (with Fe3+Y) (Moore, Reference Moore1971), shuiskite (with CrY) (Ivanov et al., Reference Ivanov, Arkhangel'skaya, Miroshnikova and Shilova1981), okhotskite (with Mn3+Y) (Togari and Akasaka, Reference Togari and Akasaka1987) and poppiite (with VY) (Brigatti et al., Reference Brigatti, Caprill and Marchesini2006). The most dominant cation in the octahedral X site is denoted by a suffix (Passaglia and Gottardi, Reference Passaglia and Gottardi1973); the root names are used in this work for simplicity.
Pumpellyite-group minerals are characteristic in low-grade metamorphic rocks subjected to zeolite- to prehnite–pumpellyite-facies metamorphism (e.g. Coombs, Reference Coombs1953; Passaglia and Gottardi, Reference Passaglia and Gottardi1973; Liou, Reference Liou1979; Schiffman and Liou, Reference Schiffman and Liou1980; Deer et al., Reference Deer, Howie and Zussman1986; Sakakibara, Reference Sakakibara1986, Reference Sakakibara1991; Hamada et al., Reference Hamada, Seto (Sakamoto), Akasaka and Takasu2008, Reference Hamada, Akasaka, Seto and Makino2010), but also occurs in hydrothermally altered igneous rocks (e.g. Mevel, Reference Mevel1981; Evarts and Schiffman, Reference Evarts and Schiffman1983; Kano et al., Reference Kano, Satoh and Bunno1986; Akasaka et al., Reference Akasaka, Kimura, Omori, Sakakibara, Shinno and Togari1997; Nagashima et al., Reference Nagashima, Ishida and Akasaka2006), and ore deposits subjected to low-grade metamorphism or hydrothermal alteration (e.g. Palache and Vassar, Reference Palache and Vassar1925; Togari et al., Reference Togari, Akasaka, Sakakibara and Watanabe1988; Akasaka et al., Reference Akasaka, Sakakibara and Togari1988, Reference Akasaka, Kimura, Omori, Sakakibara, Shinno and Togari1997; Minakawa, Reference Minakawa1992). In addition, a new occurrence of okhotskite from metachert subjected to lawsonite-blueschist subfacies metamorphism with peak metamorphic temperatures and pressures of 200–300°C and 0.6–0.8 GPa was reported by Yabuta and Hirajima (Reference Yabuta and Hirajima2020).
Pumpellyite-group minerals commonly contain Fe2+ and/or Fe3+ cations, and julgoldite component-rich pumpellyites are rich in Fe3+ (e.g. Moore, Reference Moore1971; Passaglia and Gottardi, Reference Passaglia and Gottardi1973; Artioli and Geiger, Reference Artioli and Geiger1994; Akasaka et al., Reference Akasaka, Kimura, Omori, Sakakibara, Shinno and Togari1997; Nagashima et al., Reference Nagashima, Ishida and Akasaka2006). The iron content of pumpellyite depends mainly on that of the protoliths and of the metamorphic minerals coexisting with pumpellyite at each metamorphic condition, and the oxidation state of iron depends on the temperature, pressure, and $f_{{\rm O}_2}$ conditions of metamorphism (e.g. Coombs et al., Reference Coombs, Nakamura and Vuagnat1976; Schiffman and Liou, Reference Schiffman and Liou1983; Togari et al., Reference Togari, Akasaka, Sakakibara and Watanabe1988). Passaglia and Gottardi (Reference Passaglia and Gottardi1973) proposed a calculation scheme of the chemical formula and a nomenclature system of pumpellyite and julgoldite based on the crystal structure of pumpellyite clarified by Gottardi (Reference Gottardi1965) and Galli and Alberti (Reference Galli and Alberti1969), the published chemical composition data of pumpellyites, and crystal-chemical consideration on the intracrystalline cation distributions in pumpellyite: the smallest trivalent cation, Al3+, is preferentially assigned to the Y site, and if Al3+ cations per unit cell are insufficient to fill the Y site, the second smallest Fe3+ is put in the Y site therein. However, detailed studies on Fe-rich pumpellyite have indicated that the distribution of trivalent cations in the octahedral sites of pumpellyite is more complicated than that estimated based on the ionic radii of trivalent cations and the volumetric sizes of the XO6 and YO6 octahedra. For example, in their study of pumpellyites using the methods of an X-ray Rietveld refinement and 57Fe Mössbauer spectroscopy, Artioli and Geiger (Reference Artioli and Geiger1994) concluded selective partitioning of Fe2+ and Fe3+ cations at the X and Y sites, respectively, by assigning the two Fe3+-Mössbauer doublets to Fe3+ at the Y site, which also indicates Al3+ distribution in both the X and Y sites even if the amount of Al3+ ions is sufficient to fill the Y site; whereas, Akasaka et al. (Reference Akasaka, Kimura, Omori, Sakakibara, Shinno and Togari1997) interpreted that two Mössbauer doublets of Fe3+ with larger and smaller quadrupole splits are due to Fe3+ in the X and Y sites, respectively, which resulted in a distribution of Fe3+ on both the X and Y sites and Al3+ on the Y site only. Artioli et al. (Reference Artioli, Geiger and Dapiaggi2003) also pointed out the incorrectness of the interpretation that Fe3+ is located exclusively at the smaller Y site. A subsequent X-ray diffraction and 57Fe Mössbauer spectroscopic studies of Fe-rich pumpellyite by Nagashima et al. (Reference Nagashima, Ishida and Akasaka2006) resulted in new pumpellyite formulae in which both Fe3+ and Al3+ are distributed at the X and the Y sites. A similar distribution of trivalent transition metal ions and Al3+ on the X and Y sites is also confirmed in Cr3+-rich pumpellyite (Nagashima and Akasaka, Reference Nagashima and Akasaka2007; Nagashima et al., Reference Nagashima, Akasaka, Ikeda, Kyono and Makino2010; Hamada et al., Reference Hamada, Akasaka, Seto and Makino2010) and poppiite (Nagashima et al., Reference Nagashima, Cametti and Armbruster2018), in which Cr3+ and V3+, respectively, are distributed in the two octahedral sites with Al3+. The distribution coefficient K D of the trivalent transition metal ion, M 3+, and Al3+ between the X and Y sites, is written as K D = [(M 3+/Al3+)X/(M 3+/Al3+)Y] (Nagashima and Akasaka, Reference Nagashima and Akasaka2007; Nagashima et al., Reference Nagashima, Akasaka, Ikeda, Kyono and Makino2010; Hamada et al., Reference Hamada, Akasaka, Seto and Makino2010). Applying the distribution coefficient K D of Fe3+ and Al3+ between the X and Y sites, K D = [(Fe3+/Al3+)X/(Fe3+/Al3+)Y], derived from the site populations after Nagashima et al. (Reference Nagashima, Ishida and Akasaka2006), gives 1.12 and 1.44 (Nagashima et al., Reference Nagashima, Akasaka, Ikeda, Kyono and Makino2010), indicating stronger X-site preference of Fe3+ than Al3+. The strong preference of Fe3+ for the larger X site seems to be reasonable because the Fe3+ ion has a larger ionic radius than Al3+ (0.645 Å for VIFe3+ and 0.54 Å for VIAl3+ after Shannon, Reference Shannon1976). Moreover, the published results on the oxidation state and site distribution of Fe at the octahedral sites indicate that, although the calculation scheme of pumpellyite formula by Passaglia and Gottardi (Reference Passaglia and Gottardi1973) is correct in a global meaning, it does not derive a proper trivalent cation population in the octahedral X and Y sites. However, the calculation scheme of pumpellyite formula by Passaglia and Gottardi (Reference Passaglia and Gottardi1973) has not yet been updated to a new one.
Structural variation of pumpellyite to total Fe content in pumpellyite and to Fe distributions at the X and Y sites have also been investigated to understand the contribution of intracrystalline distribution of Fe in pumpellyite to the pumpellyite structure. As a result, the systematic changes of the structural properties, such as unit-cell parameters and the bond lengths at the X and Y sites, versus total Fe content in pumpellyite and Fe population at the X and Y sites have been proved (e.g. Allmann and Donnay, Reference Allmann and Donnay1971: Passaglia and Gottardi, Reference Passaglia and Gottardi1973; Artioli and Geiger, Reference Artioli and Geiger1994; Akasaka et al., Reference Akasaka, Kimura, Omori, Sakakibara, Shinno and Togari1997; Artioli et al., Reference Artioli, Geiger and Dapiaggi2003; Nagashima et al., Reference Nagashima, Ishida and Akasaka2006). This made it possible to use the structural properties of pumpellyite as an index to evaluate the validity of the determined intracrystalline distribution of cations.
In addition, the intracrystalline distribution of cations and crystal structure on julgoldite have also been elucidated by several studies (e.g. Moore, Reference Moore1971; Allmann and Donnay, Reference Allmann and Donnay1973; Livingstone, Reference Livingstone1976; Brastad, Reference Brastad1984; Artioli et al., Reference Artioli, Geiger and Dapiaggi2003; Nagashima et al., Reference Nagashima, Cametti and Armbruster2018; Kasatkin et al., Reference Kasatkin, Zubkova, Chukanov, Ksenofontov, Shkoda, Tishchenko, Voronin, Britvin and Pekov2021). Although the determined distributions of Fe2+, Fe3+ and Al3+ at the octahedral sites are somewhat variable from study to study, Artioli et al. (Reference Artioli, Geiger and Dapiaggi2003) and Nagashima et al. (Reference Nagashima, Cametti and Armbruster2018) showed that the changes in the unit-cell parameters of julgoldite to the Fe content are consistent with the trends in pumpellyite.
Despite the contributions of the published studies on pumpellyite-group minerals cited above, precise and accurate data on the intracrystalline distribution of cations and the structural properties of pumpellyites are further required for the formulation of the crystallochemical rule on the distribution of trivalent cations in the octahedral sites of pumpellyite and its relation to the crystal structure, and for improvement of the general calculation scheme of the pumpellyite formula to one that gives realistic results.
The Kanogawa unit in the Northern Chichibu Belt, the Hijikawa district, western Shikoku, is a source of Fe-rich pumpellyite; the geology, petrology, occurrence and chemical composition of Fe-rich pumpellyite in the Hijikawa district have been reported in detail by Sakakibara et al. (Reference Sakakibara, Oyama, Umeki, Sakakibara, Shono and Goto1998), Umeki and Sakakibara (Reference Umeki and Sakakibara1998a) and Sakakibara et al. (Reference Sakakibara, Umeki and Cartwright2007). However significant new data on the crystal-chemical properties of Fe-rich pumpellyite from the Kanogawa unit (hereafter abbreviated as Kanogawa pumpellyite) has been obtained that can verify the relationship between Fe content in pumpellyite and intracrystalline cation distribution in octahedral sites, and between Fe content and features of the pumpellyite structure. Thus, in the present study, we determined the oxidation state of Fe and the cation populations at octahedral sites in the Kanogawa pumpellyite, using electron microprobe analysis (EMPA), X-ray Rietveld refinement, and 57Fe Mössbauer spectroscopy. In this paper, we also propose a method for estimating the cation distributions at the octahedral sites and structural properties from the pumpellyite composition, based on validated systematic changes of intracrystalline cation distribution and structure versus Fe content in pumpellyite.
Study methods
Specimen
The Northern Chichibu Belt of western Shikoku, Japan, is a late Mesozoic accretionary complex adjacent to the south of the Sambagawa metamorphic belt (e.g. Kashima, Reference Kashima1969; Hashimoto and Kashima, Reference Hashimoto and Kashima1970; Matsuoka et al., Reference Matsuoka, Yamakita, Sakakibara and Hisada1998; Sakakibara et al., Reference Sakakibara, Umeki and Cartwright2007) (Fig. 1). In the Hijikawa district, Ozu City, Ehime Prefecture, Japan, the low-grade metamorphic rocks of the Northern Chichibu Belt are divided into Kanogawa and Hijikawa units. The former has been subjected to prehnite–pumpellyite-facies metamorphism and consists mainly of green rocks of pillow lava, dolerite and hyaloclastite, which are accompanied by chert, pebbly shale, alternating sandstone and shale, and their broken facies. The latter is composed of basic semischist, pelitic semischist, psammitic semischist, and chert that have undergone pumpellyite–actinolite-facies metamorphism (Sakakibara et al. Reference Sakakibara, Oyama, Umeki, Sakakibara, Shono and Goto1998; Umeki and Sakakibara Reference Umeki and Sakakibara1998a, Reference Umeki and Sakakibara1998b; Sakakibara et al., Reference Sakakibara, Umeki and Cartwright2007). Fe-rich green pumpellyite occurs in the green rocks of the Kanogawa unit and in the basic semischist of the eastern part of the Hijikata unit (Umeki and Sakakibara, Reference Umeki and Sakakibara1998a).
Sample locality map for the green rocks of Kanogawa unit, the Northern Chichibu Belt of western Shikoku, Japan, containing Fe-rich pumpellyites. The cross-mark indicates the sample point of the CLW and CHG green rocks from which the Fe-rich pumpellyites studied were separated. Inset: location of the study area and Chichibu belt in Shikoku, Japan (Umeki and Sakakibara, Reference Umeki and Sakakibara1998b).

The rocks studied were obtained from an outcrop along the Kawabe River in the Uemats area belonging to the Kanogawa unit (Fig. 1). Thin sections of the rock samples were prepared for petrographic observation and chemical analysis of constituent minerals using an electron microprobe. On the basis of the occurrence and chemical composition of pumpellyite, two rock hand specimens with dark reddish-green and green colour, labelled as CLW and CHG, respectively, were selected for the preparation of pumpellyite samples used for X-ray diffraction and Mössbauer spectroscopic studies. The CLW rock sample has an intersertal texture in which clinopyroxene, hematite and hornblende fill the interstices between plagioclase phenocrysts, and contains the veinlets consisting of metamorphic minerals, such as pumpellyite + quartz, pumpellyite + chlorite + quartz + calcite, and pumpellyite + quartz + calcite. Pumpellyite occurs as needle-like crystals < 0.2 mm in length and 0.01 mm in width, showing green to pale green pleochroism, and forms a comb structure in pumpellyite–quartz veinlets (Fig. 2a) or radial aggregates. In the pumpellyite + chlorite + quartz + calcite veinlets, pumpellyite is associated closely with chlorite (Fig. 2b). The occurrences and texture of pumpellyite and associated metamorphic minerals of the CGH green rock are similar to those of the CLW green rock. Pumpellyite forms veinlets with quartz and calcite (Fig. 2c) and occurs as a replacement phase of primary minerals or as radial aggregates of fine needles.
Microscopic photographs of pumpellyite and associated minerals in the CLW specimen (a and b) and CLG (c) (parallel-polarised light). Pmp, pumpellyite; Chl, chlorite; Cc, calcite; Qtz, quartz.

Pumpellyite samples were separated from the CLW and CHG green rock specimens by the following procedures: ~2 mm thick chips of the pumpellyite-rich part of the rock specimens were treated with dilute hydrochloric acid for the decomposition of calcite; the pumpellyites in the chips were scraped off with a marking needle and were further selected under a binocular microscope. However, as shown in the ‘Results’ section, the pumpellyite sample separated from the CLW green rock for the X-ray diffraction analyses contained small amounts of quartz and hornblende, and that of the Mössbauer spectroscopic analysis minor chlorite. In contrast, the pumpellyite sample separated from the CHG green rock was too small in quantity for conventional powder X-ray diffraction measurement and Mössbauer spectral analysis. Thus, powder X-ray diffraction data of pumpellyite in the CHG green rock were obtained from a fragment of the pumpellyite aggregate using a Gandolfi camera (Gandolfi, Reference Gandolfi1967) and imaging plate system (Nakamuta, Reference Nakamuta1993, Reference Nakamuta1999) and a Mössbauer spectroscopic measurement was not performed. Hereafter, the pumpellyite samples separated from the CLW and CHG rock samples are designated as CLW and CHG pumpellyites, respectively.
Chemical analysis of pumpellyite
A JEOL JXA-8800M electron microprobe analyser equipped with a wavelength-dispersive X-ray spectrometer and with LiF, PET and TAP monochromator crystals was used for the chemical analysis of pumpellyite in thin sections at the operating conditions of an accelerating voltage of 15 kV, with a beam current of 2.00⋅10–8 Å and beam diameter of 1 μm. The standards used were: natural wollastonite for Si and Ca; synthetic TiO2 for Ti; synthetic MgAl2O4 spinel for Al and Mg; synthetic Cr2O3 for Cr; synthetic Ca3V2O8 for V; synthetic hematite for Fe; synthetic MnO for Mn; synthetic NiO for Ni; and natural anorthoclase for Na and K.
Four natural minerals (clinopyroxene, kaersutite, pyrope and uvarovite) with known compositions were used as working standards to monitor the precision and accuracy of the analyses. The ZAF method was used for data correction for all elements.
57Fe Mössbauer spectroscopic analysis
The 57Fe Mössbauer spectrum of the CLW pumpellyite was measured at room temperature, using 370 MBq 57Co in Pd as a source. The data were obtained using a constant acceleration spectrometer fitted with a 1,024-channel analyser. The isomer shift (I.S.) was referenced to a standard metallic iron foil, which was also used to calibrate Doppler velocity. A Lorentzian fit was applied to the spectrum using the least-squares method, with line width and intensities of the component peaks of a doublet constrained to be equal. The QBMOSS program of Akasaka and Shinno (Reference Akasaka and Shinno1992) was used for computer analysis. The quality of the fit was judged using the χ2 and the standard deviations of the Mössbauer parameters. The doublets are assigned based on the I.S. and quadrupole splitting (Q.S.), and the Fe2+:Fe3+ ratio is derived by the area ratio of the Fe2+ and Fe3+ doublets, using the equation [n(Fe2+)/n(Fe3+)] = C × [A(Fe2+)/A(Fe3+)], where n, A and C are the number of cations, area ratio of the doublet, and constant, respectively. Empirically, the C constant is close to 1 (e.g. Bancroft, Reference Bancroft1973), and, thus, is set to 1.0.
Powder X-ray diffraction measurement and Rietveld refinement
The CLW pumpellyite, ground to a size of ~10 μm using an agate mortar and pestle under alcohol, was mounted in a sample holder made of silicon, with a cavity measuring 10 × 10 × 0.25 mm. Step-scan powder diffraction data were collected using a RIGAKU RINT automated powder X-ray diffractometer using a Bragg-Brentano goniometer equipped with 1° divergence and anti-scatter slits, a 0.15 mm receiving slit and a curved graphite diffracted-beam monochromator. The normal-focus Cu X-ray tube was operated at 40 kV and 25 mA. Profiles were taken between 5° and 120°2θ with a step interval of 0.02°2θ, using step counting times that accumulated around five thousand counts for the strongest peak.
A separated fragment of the CHG pumpellyite, 0.1 × 0.1 × 0.05 mm in size, was mounted on a glass fibre of ~3 μm in diameter for X-ray diffraction measurements using a 114 mm diameter Gandolfi camera at Kyushu University Museum (Nakamuta, Reference Nakamuta1993, Reference Nakamuta1999). A rotating anode X-ray generator with a Cr-anode 0.2 × 2 mm fine-filament and a V-filter was operated at X-ray tube voltage and current of 41 kV and 38 mA, respectively, for CrKα-radiation. The sample mounted on the glass fibre was rotated during the X-ray diffraction measurements. The X-ray powder diffraction patterns were recorded two-dimensionally on an imaging plate 35 mm wide and 350 mm long, and the intensity data on the imaging plate were read with a 50 × 50 μm pixel size using a Fuji-film BAS-2500 IP scanner. Finally, the X-ray diffraction intensity data over a 2θ range of 0 to 180° were obtained with a step interval of 0.0251°.
The crystal structure of the pumpellyites were refined using the RIETAN-FP program of Izumi and Momma (Reference Izumi and Momma2007). Peaks were defined using the split Pearson VII function in the RIETAN-FP program. An asymmetric parameter is built into this profile function. Nonlinear least-squares calculation using the Marquardt method was followed by the conjugate direction method to check convergence at local minima (Izumi, Reference Izumi and Young1993). Preferred orientation was corrected using the March–Dollase function (Dollase, Reference Dollase1986).
The powder X-ray diffraction data of the CLW pumpellyite sample indicated that the separated sample consists of not only pumpellyite but also small amounts of quartz and hornblende. Thus, in the Rietveld refinement of pumpellyite using the powder X-ray diffraction data of the CLW pumpellyite sample, quartz and hornblende were added to improve R-factors. Structural parameters of julgoldite, quartz and hornblende by Allmann and Donnay (Reference Allmann and Donnay1973), Kihara (Reference Kihara1990) and Phillips et al. (Reference Phillips, Draheim, Popp, Clowe and Pinkerton1989), respectively, were used as the initial parameters of the three phases. In contrast, the CHG pumpellyite sample consisted solely of pumpellyite. In the structural refinements, Ca was fixed at the W site, Mg at the X site, and Si at the Z site on the basis of the published results of single-crystal and Rietveld structural refinements of pumpellyite-group minerals. Site occupancies of Al and Fe in the X and Y sites were refined using the following constraints: Al(X) = 1.0 − Mg(X) − Fe(X), Fe(Y) = [total Fe apfu − 4×Fe(X)]/8, and Al(Y) = 1.0 − Fe(Y) where apfu = atoms per formula unit.
When structural parameters are refined using the powder X-ray diffraction data, it is possible to refine both the isotropic atomic displacement parameters and site occupancies simultaneously if the purity of the measured sample and the measured powder X-ray diffraction data are of high quality (e.g. Nagashima et al., Reference Nagashima, Ishida and Akasaka2006; Nagashima and Akasaka, Reference Nagashima and Akasaka2007; Akasaka et al., Reference Akasaka, Takasu, Handa, Nagashima, Hamada and Ejima2019). However, if the quality of the measured powder X-ray diffraction data is not high enough for the simultaneous refinement of both structural parameters, and if the determination of site occupancy is the main objective, individual atomic displacement parameters are fixed routinely to reasonable values determined for similar compounds (Post and Bish, Reference Post, Bish, Bish and Post1989). As the atomic structural parameters, especially atomic displacement parameters, by Rietveld refinement are, in general, less accurately determined than by comparable single-crystal studies (Post and Bish, Reference Post, Bish, Bish and Post1989), the single-crystal data are commonly used to fix the atomic displacement parameters for the Rietveld refinement of the site occupancy (Post and Bish, Reference Post, Bish, Bish and Post1989). As the atomic displacement parameters of julgoldite determined by Allmann and Donnay (Reference Allmann and Donnay1973) (0.75 Å2 at the X site; 0.55 Å2 at the Y site) using a single-crystal X-ray diffraction method are almost the same as those reported by Nagashima et al. (Reference Nagashima, Cametti and Armbruster2018) (0.789(8) Å2 at the X site; 0.621(5) Å2 at the Y site), the former study's isotropic atomic displacement parameters were employed as the initial values in the preliminary Rietveld refinements of the CLW and CGH pumpellyites. Finally, the isotropic atomic displacement parameters (B) of the CLW pumpellyite were refined using the constraints B(W2) = B(W1); B(Y) = B(X); and B(O2) to B(O11) = B(O1), whereas those of the CHG pumpellyite were fixed to those of julgoldite determined by Allmann and Donnay (Reference Allmann and Donnay1973).
The validity of the refined site occupancies was evaluated by the bond-valence-sum rule (Brown and Shannon, Reference Brown and Shannon1973) which examines a consistency between the refined site occupancies and the bond lengths determined from the refined atomic positions.
From the structural refinement results of the CLW and CHG pumpellyites, the mean <X–O> and <Y–O> distances and the site distortion parameters, i.e. the quadratic elongation <λ>, bond angle variance σθ(oct)2 (Robinson et al., Reference Robinson, Gibbs and Ribbe1971) and bond-length distortion index DI (Baur, Reference Baur1974), of the XO6 and YO6 octahedra were calculated using the VESTA program by Momma and Izumi (Reference Momma and Izumi2011). This software uses external programs to calculate the values, where $< \!\lambda _{{\rm oct}}\! > \; = \mathop \sum \limits_{i = 1}^6 ( {l_i/l_0} ) ^2/6\;$ [li is the length of the line in the strained state; l o is the centre-to-vertex distance for an octahedron with Oh symmetry whose volume is equal to that of the strained octahedron with bond lengths li]; $\rm\sigma _{\rm \theta }( {{\rm oct}} ) ^2 = \mathop \sum \limits_{i = 1}^{12} ( {{\rm \theta }_i-90^\circ } ) ^2/11$
 [where θi is the O–M–O angle]; and ${\rm DI}( {{\rm oct}} ) = {1\over 6} \mathop \sum \limits_{i = 1}^{6} \vert R_i/R_{{\rm av}}\vert$
 [where Ri is each bond length, R av is average distance for an octahedron].
The crystallographic information files have been deposited with the Principal Editor of Mineralogical Magazine and are available as Supplementary material (see below).
Results
Chemical composition of pumpellyite
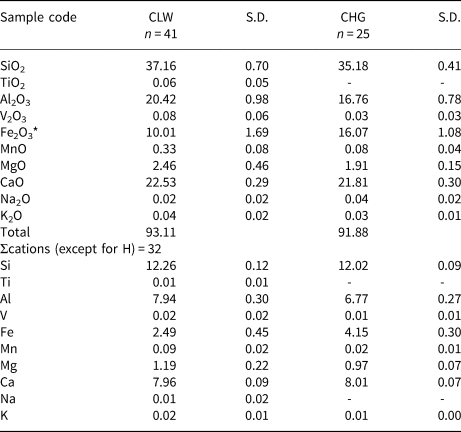
Average chemical compositions of the CLW and CHG pumpellyites are given in Table 1, with n = 41 and 25, respectively, where n is the number of analytical data points. The CLW and CHG pumpellyites contain 10.01±1.69 and 16.07±1.08 wt.% total Fe2O3 on average, respectively. The empirical formulae of the CLW and CHG pumpellyites calculated from the average compositions following the calculation scheme of Passaglia and Gottardi (Reference Passaglia and Gottardi1973) are:
Average chemical compositions of the CLW and CHG pumpellyites. (n = number of data).

* Total Fe as Fe2O3.
S.D. – standard deviation
[Ca7.96K0.02Na0.01]Σ7.99[Mg1.19Fe2+,3+2.46Mn0.09]Σ3.74[Al7.94Fe3+0.03V0.02Ti0.01]Σ8.00Si12.26O56–n(OH)n and [Ca8.01K0.01]Σ8.02[Mg0.97Fe2+,3+2.93Mn0.02]Σ3.92[Al6.77Fe3+1.22V0.01]Σ8.00Si12.02O56–n(OH)n, respectively, where cations are calculated as total cations except for H to be 32 per O56–n(OH)n.
Rietveld refinement
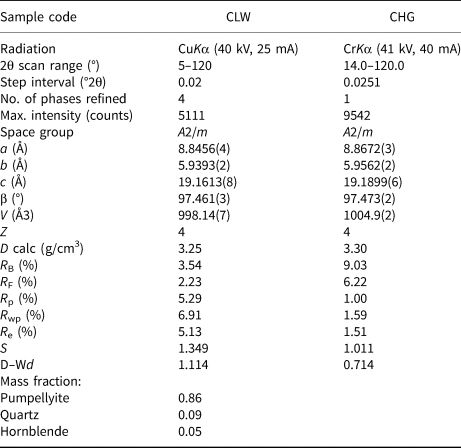
Details of X-ray diffraction data collection, Rietveld refinement, R-factors, goodness-of-fit (S = R wp/R e), and the Durbin-Watson d statistic are listed in Table 2. Errors are shown by estimated standard deviations of 1σ (esd). The refined powder X-ray diffraction patterns (Fig. 3) indicate that residual impurities of 8.6 mass % of quartz and 5.4 mass % of hornblende are present in the CLW pumpellyite sample and that the CHG pumpellyite sample consists of a single phase of pumpellyite. The refined unit-cell parameters are: a = 8.8456(4), b = 5.9393(2), c = 19.1613(8) Å, and β = 97.461(3)°, resulting in a cell volume of V = 998.14(7) Å3, for the CLW pumpellyite; and a = 8.8672(3), b = 5.9562(2), c = 19.1899(6) Å, and β = 97.473(2)°, with V = 1004.9(2) Å3, for the CHG pumpellyite, where the space group is A2/m.
Data collection and details of structure refinement*.

* Number within parentheses represent; the standard deviation (1σ) and refer to the last digit; R B = R-Bragg factor; R F = R structure factor; R p = R-pattern; R wp = R-weighted pattern; R e = R-expected; S (= R wp/R e) = Goodness of fit (Young, Reference Young and Young1993); D–Wd = Durbin-Watson d-statistic (Hill and Flack, Reference Hill and Flack1987).
Observed and calculated powder X-ray diffraction patterns for the CLW (a) and CHG (b) pumpellyites. The CLW pumpellyite was refined with pumpellyite, quartz and hornblende, and the CHG pumpellyite with the single phase, pumpellyite. The crosses are the observed data, the solid line is the calculated pattern, and the vertical bars mark all possible Bragg reflections by CuKα and CrKα diffraction for CLW (a) and CHG (b), respectively. In the plot of CLW (a), the vertical bars of the top, middle, and bottom correspond to the Bragg reflections of pumpellyite, quartz and hornblende, respectively. The difference between the observed and calculated patterns is shown at the bottom.

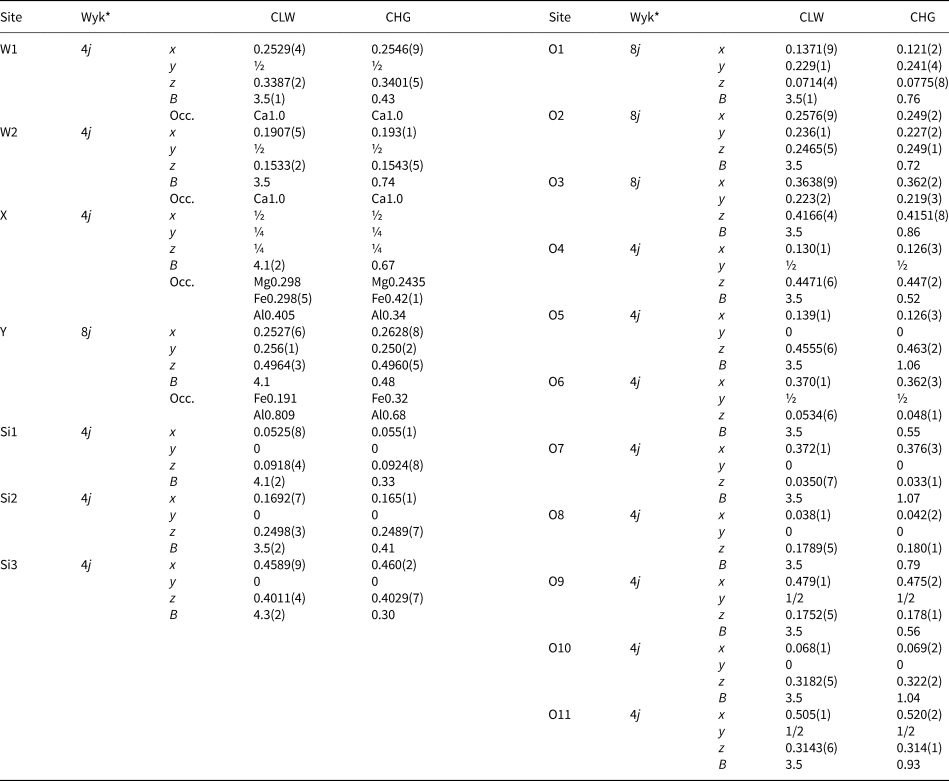
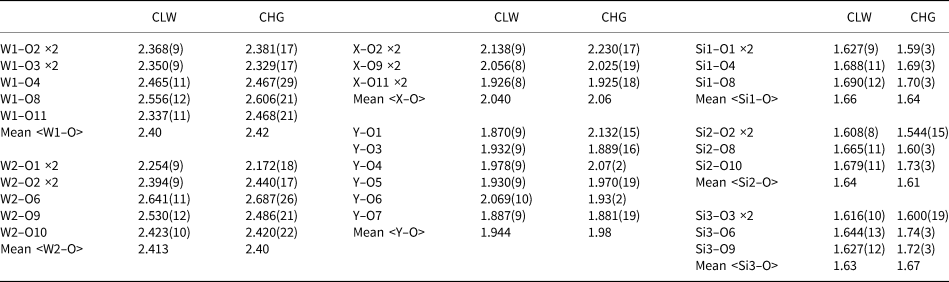
Refined atomic positions and site occupancies are shown in Table 3. The selected bond lengths are given in Table 4. The resulting site occupancies in the X and Y sites of the CLW pumpellyite are Mg0.298Fe0.298(5)Al0.405 and Fe0.191Al0.809, respectively, and those of the CHG are Mg0.2435Fe0.42(1)Al0.34 and Fe0.32Al0.68, respectively. The Fe contents calculated from the refined site occupancies are 2.72 apfu for the CLW pumpellyite, and 4.24 apfu for the CHG pumpellyite. As the Fe contents derived from the X-ray diffraction data include minor transition elements such as Mn, V and Ti that have similar atomic scattering factors to Fe, the Fe contents of CLW and CHG pumpellyites obtained from the X-ray diffraction data, of 2.72 and 4.24 apfu, respectively, are compared with the EMPA data for CLW and CHG pumpellyite, of 2.61 apfu (= 2.49Fe + 0.09Mn + 0.02V + 0.01Ti) and 4.18 apfu (= 4.15Fe + 0.02Mn + 0.01V), respectively. Thus, the Fe contents, including minor transitional metals other than Fe, obtained from the X-ray diffraction data are reasonably consistent with the EMPA data. The results for evaluation of validity of the refined site occupancies using the bond-valence-sum rule are shown and discussed in the ‘Discussion’ section below.
Site occupancies (Occ.), atomic coordinates (x, y, z) and isotropic atomic displacement parameters (B in Å2) * of the CLW and CHG pumpellyites.

Notes: On the basis of the chemical composition data, the site occupancies of Ca at the W1 and W2 sites and of Si at the Si1, Si2 and Si3 sites were fixed to 1.0, and that of Mg at the X site was fixed to the chemical composition value. The site occupancies of Al and Fe in the X and Y sites were refined using the following constraints: Al(X) = 1.0 – Mg(X) – Fe(X); Fe(Y) = [total Fe apfu – 4×Fe(X)]/8; and Al(Y) = 1.0 – Fe(Y). Estimated standard deviations are in parentheses (1σ). The isotropic atomic displacement parameters of the CLW pumpellyite were refined using the constraints B(W2) = B(W1); B(Y) = B(X); and B(O2) to B(O11) = B(O1), whereas those of the CHG pumpellyite were fixed to those of julgoldite determined by Allmann and Donnay (Reference Allmann and Donnay1973).
* Wyk is Wyckoff site notation.
Selected bond lengths (Å).

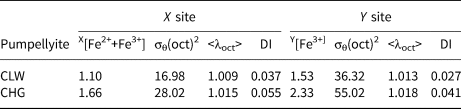
The quadratic elongation <λ>, bond angle variance σθ2, and bond-length distortion index DI of the XO6 and YO6 octahedra of the CLW and CHG pumpellyites are given in Table 5 with four significant digits based on the accuracy of the bond lengths (Table 4).
Bond angle variance σθ(oct)2 (degree2), quadratic elongation <λoct>, and bond-length distortion index DI* of XO6 octahedra versus Fe2++Fe3+ in the X site and those of YO6 octahedra versus Fe3+ in the Y site.

* Bond angle variance and quadratic elongation are defined by Robinson et al. (Reference Robinson, Gibbs and Ribbe1971), and bond-length distortion index by Baur (Reference Baur1974).The definitions are given in the text.
57Fe Mössbauer spectroscopic analysis
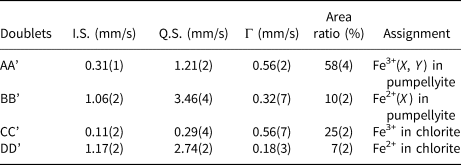
The 57Fe Mössbauer spectrum of the CLW pumpellyite sample is shown in Fig. 4 and the hyperfine parameters are listed in Table 6. The spectrum is composed of four doublets. On the basis of the reported 57Fe Mössbauer hyperfine parameters on Fe of pumpellyite, i.e. I.S. = 0.29−0.38 mm/s and Q.S. = 1.06−1.12 mm/s for Fe3+ in the X site, I.S. = 0.35−0.37 mm/s and Q.S. = 1.9−2.1 mm/s for Fe3+ in the Y site (Akasaka et al., Reference Akasaka, Kimura, Omori, Sakakibara, Shinno and Togari1997; Artioli et al., Reference Artioli, Geiger and Dapiaggi2003; Nagashima et al., Reference Nagashima, Ishida and Akasaka2006), and I.S. = 1.09−1.14 mm/s and Q.S. = 3.20−3.39 mm/s for Fe2+ in the X site (Artioli and Geiger, Reference Artioli and Geiger1994; Akasaka et al., Reference Akasaka, Kimura, Omori, Sakakibara, Shinno and Togari1997; Artioli et al., Reference Artioli, Geiger and Dapiaggi2003; Nagashima et al., Reference Nagashima, Ishida and Akasaka2006), the doublet AA’ (I.S. = 0.31(1) mm/s and Q.S. = 1.21(2) mm/s) is assigned to Fe3+ at the octahedral sites. However, its broad peak width, Γ = 0.56(2) mm/sec, indicates that the doublet AA’ consists of overlapped doublets by Fe3+ at the X and Y sites. In most of the published Mössbauer spectroscopic studies on pumpellyite and julgoldite, the doublets due to Fe3+ at the X and Y sites have been resolved individually (e.g. Akasaka et al., Reference Akasaka, Kimura, Omori, Sakakibara, Shinno and Togari1997; Artioli et al., Reference Artioli, Geiger and Dapiaggi2003; Nagashima et al., Reference Nagashima, Ishida and Akasaka2006). However, the fitting of each doublet due to Fe3+ at the X and Y sites was not successful because of the strong overlap of the doublet CC’ by Fe3+ of chlorite that remained in the separated sample. The doublet BB’ with I.S. = 1.06(2) mm/s and Q.S. = 3.46(4) mm/s is assigned to Fe2+ at the X site. On the basis of the Mössbauer hyperfine parameter data of chlorite from De Grave et al. (Reference De Grave, Vandenbruwaene and Van Bockstael1987), i.e. I.S. = 0.23(5) and Q.S. = 0.70(3) mm/s for Fe3+; and I.S. = 1.14(3)−1.16(3) and Q.S. = 2.38(5)−2.67(5) mm/s for Fe2+, we assigned the doublets CC’ with I.S. = 0.11(2) and Q.S. = 0.29(4) mm/s, and DD’ with I.S. = 1.17(2) and Q.S. = 2.74(2) mm/s to Fe3+ and Fe2+ in chlorite, respectively.
57Fe Mössbauer spectrum of the CLW pumpellyite and the fitted data. Mössbauer hyperfine parameters and the assignments are shown in Table 6.

57Fe Mössbauer hyperfine parameters of the doublets in 57Fe Mössbauer spectrum of the CLW pumpellyite sample*.

* Estimated standard deviations are in parentheses (1σ). I.S. = isomer shift relative to metallic absorber (mm/s), Q.S. = quadrupole splitting (mm/s), Γ = full width at half height (mm/s).
The [Fe2+(X)]:[Fe3+(X, Y)] ratio in the CLW pumpellyite, determined from the area ratio of the doublets AA’ and BB’, is 15:85 in percent.
Discussion
Cation distribution in the X and Y sites of the CLW and CGH pumpellyites
By combining the refined site occupancies in the X and Y sites, Mg0.298Fe0.298(5)Al0.405 and Fe0.191Al0.809, respectively (Table 3), and the Ca, K, Na, Mn, V and Ti contents in the average chemical composition (Table 1), the empirical formula of the CLW pumpellyite is derived as follows: (Ca7.96K0.02Na0.01)Σ7.99(Mg1.19Mn0.09Fe1.10Al1.62)Σ4.00(Al6.47Fe1.50V0.02Ti0.01)Σ8.00Si12.26O56–n(OH)n. As the Fe2+:Fe3+ ratio of the CLW pumpellyite is Fe2+:Fe3+=15:85 in atomic percent, the structural formula is finally established as follows: (Ca7.96K0.02Na0.01)Σ7.99(Mg1.19Mn2+0.09Fe2+0.39Fe3+0.71Al1.62)Σ4.00(Al6.47Fe3+1.50V0.02 Ti0.01)Σ8.00Si12.26O43.33(OH)12.67.
In addition, the refined site occupancy of the CHG pumpellyite, X[Mg0.2435Fe0.42(1)Al0.34]Y[Fe0.32Al0.68] (Table 3), and the EMPA data of the CHG pumpellyite (Table 1) result in the empirical formula of (Ca8.01K0.01)Σ8.02(Mg0.97Mn2+0.02Fe1.66Al1.36)Σ4.01(Al5.44Fe2.55V0.01)Σ8.00Si12.02O56–n(OH)n. Although the Fe2+:Fe3+ ratio in the CHG pumpellyite was not determined in the present study, we assume that the oxidation state of Fe in the CHG pumpellyite is almost the same as that of the CLW pumpellyite, because the green rock samples of the CLW and CHG pumpellyites are from the same outcrop and their mineral assemblages and the occurrence of metamorphic minerals are similar to each other. By applying the Fe2+:Fe3+ ratio of the CLW pumpellyite (i.e. Fe2+:Fe3+ = 15:85) to the CHG pumpellyite, the empirical formula of the CHG pumpellyite becomes (Ca8.01K0.01)Σ8.02(Mg0.97Mn2+0.02Fe2+0.63Fe3+1.03Al1.36)Σ4.01(Al5.44Fe3+2.55V0.01)Σ8.00Si12.02O42.69(OH)13.31.
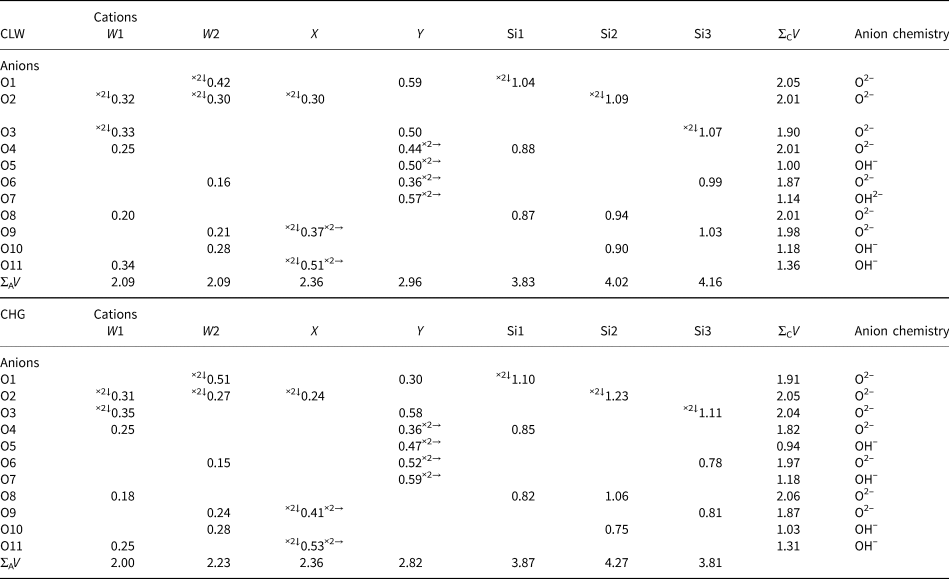
The consistency between the determined site populations and the structural characteristics can be examined using the bond-valence-sum rule (Brown and Shannon, Reference Brown and Shannon1973): $V_i = {\rm \;}\mathop \sum \nolimits_j {\rm exp}[ {( {l_0-l_{ij}} ) /0.37} ]$ , where V i is the valence or oxidation state of cation i, l 0 is the bond-valence parameter (Brown and Altermatt Reference Brown and Altermatt1985; Brese and O'Keeffe Reference Brese and O'Keeffe1991) and l ij is the bond length between cation i and anion j (Table 7). The bond-valence sums of the W1, W2, Y and tetrahedral Si1, Si2 and Si3 sites of the CLW pumpellyite are close to the expected values, and that of the X site, 2.36 in valence units, is consistent with the presence of both divalent and trivalent cations in this site. Thus, the resulting bond-valence sums of the cation sites imply that the determined site populations for the CLW pumpellyite are reasonable. On the other hand, the bond-valence sums of the CHG pumpellyite deviate somewhat from the expected value: the valence sums of the W2, Y, Si1, Si2 and Si3 sites are 2.23, 2.82, 3.87, 4.27 and 3.81 in valence units, respectively, versus the expected values of 2, 3, 4, 4 and 4 vu, respectively. A reason could be attributed to the somewhat low X-ray diffraction intensity data due to a very small quantity of the CHG sample. However, the deviation of the bond-valence sums of the cation sites from the expected values is not serious, and, as a whole, the chemical and structural data of the CHG pumpellyite are regarded to have an adequate quality to supply useful information on the Fe2+ and Fe3+ distributions in the X and Y sites and their effects on the structure. The sums of O5, O7 and O10 are close to 1.0 which is the expected value for a hydroxyl group, implying the existence of (OH)– at these oxygen positions, as has been clarified repeatedly by the structural analyses of the pumpellyite structure (e.g. Allmann and Donnay, Reference Allmann and Donnay1971, Reference Allmann and Donnay1973; Yoshiasa and Matsumoto, Reference Yoshiasa and Matsumoto1985, Nagashima et al., Reference Nagashima, Ishida and Akasaka2006). The valence sums for O11 of the CLW and CGH pumpellyites, 1.36 and 1.31, respectively, are rather larger than the expected value for a hydroxyl group as well as the published data (e.g. Allmann and Donnay, Reference Allmann and Donnay1971, Reference Allmann and Donnay1973; Yoshiasa and Matsumoto, Reference Yoshiasa and Matsumoto1985, Nagashima et al., Reference Nagashima, Ishida and Akasaka2006). Such deviation of the O11 valence sum from the expected value for a hydroxyl group has been explained by charge equalisation between O(10)2– and O(10)H– and O(11)2– and O(11)H– (Allmann and Donnay, Reference Allmann and Donnay1971) and by reduction of the number of hydrogen atoms at the X site by a possible substitution of [M3+(X) + O2−(O11)] for [M2+(X) + H+(H11) + O2−(O11)] (Yoshiasa and Matsumoto, Reference Yoshiasa and Matsumoto1985). Both interpretations seem to be adequate for understanding the valence sums of O11 of the CLW and CHG pumpellyites.
Bond valences (Vi) in valence unit and cationic and anionic bond valence sums (ΣCV and ΣAV, respectively) of the CLW and CHG pumpellyites.

Superscripts left and right of the bond valences indicate number of bonds per cation and anion, respectively.
To conclude, the self-consistency between the determined site populations and the measured bond lengths of the CLW and CHG pumpellyites is proved using the bond-valence-sum rule. The established structural formulae indicate that the proper name of the CLW and CHG pumpellyites is pumpellyite-(Al). Hereafter, the numbers of cations at the X and Y sites shown in the given structural formula are referred to as the site populations at the X and Y sites in the CLW and CHG pumpellyites.
Change of cation populations in the X and Y sites with increasing total Fe in pumpellyite
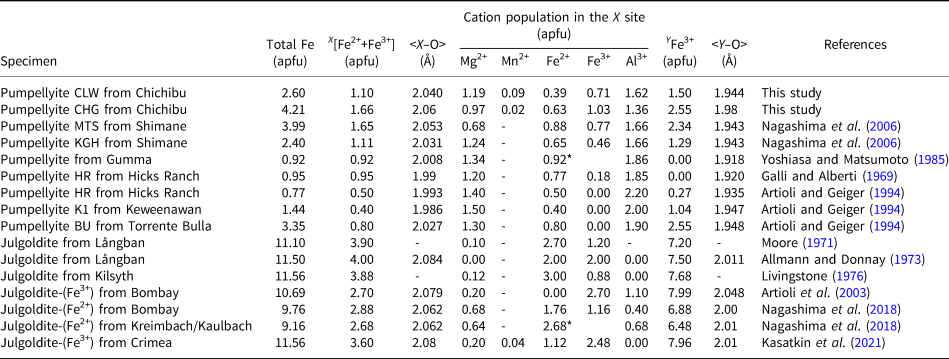
The constructed structural formulae of the CLW and CHG pumpellyites indicate the nonselective distribution of Fe3+ and Al in the X and Y sites, as well as the results of the published studies for Fe-rich pumpellyites cited already. Systematic variation of the Fe distribution in the X and Y sites can be elucidated from the results of the present study and the published data listed in Table 8, where the data for julgoldites are also shown for comparison.
Site population data and bong lengths for pumpellyite–julgoldite-series minerals, from this study and literature.

* Total Fe as Fe2+.
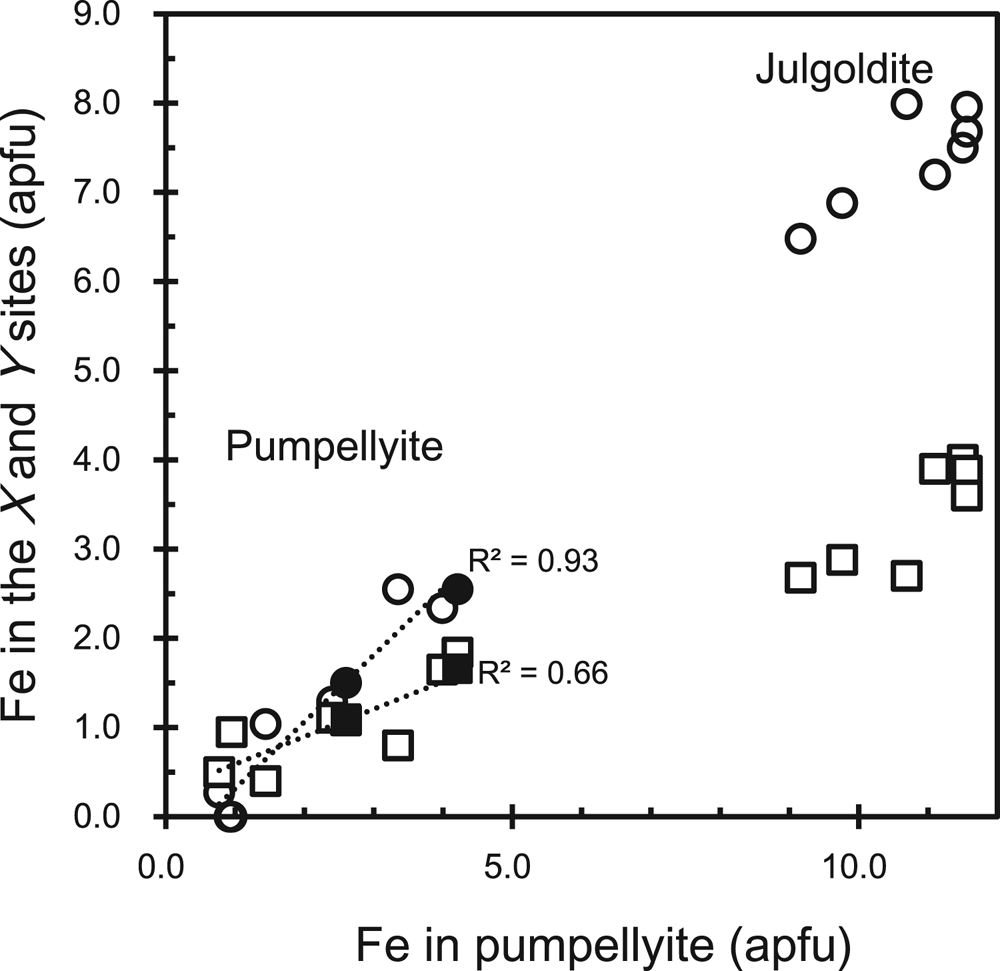
The data show that Fe in the X and Y sites, XFe and YFe, respectively, increase linearly versus the total Fe content (Fig. 5) as shown by the following regression equations:


Fe content (apfu) in the X and Y sites versus total Fe (apfu) in pumpellyite and julgoldite. Closed circle: Fe3+ in the Y site of the CLW and CHG pumpellyites in this study; open circle: Fe3+ in the Y site of pumpellyite and julgoldite listed in Table 8; closed square: total Fe in the X site of the CLW and CHG pumpellyites in this study; open square: total Fe in the X site of pumpellyite and julgoldite listed in Table 8. To avoid complexity, each data source other than this study is not distinguished. The dotted lines are regression lines of equations (1) with R 2 = 0.66 and (2) with R 2 = 0.93, shown in the document.

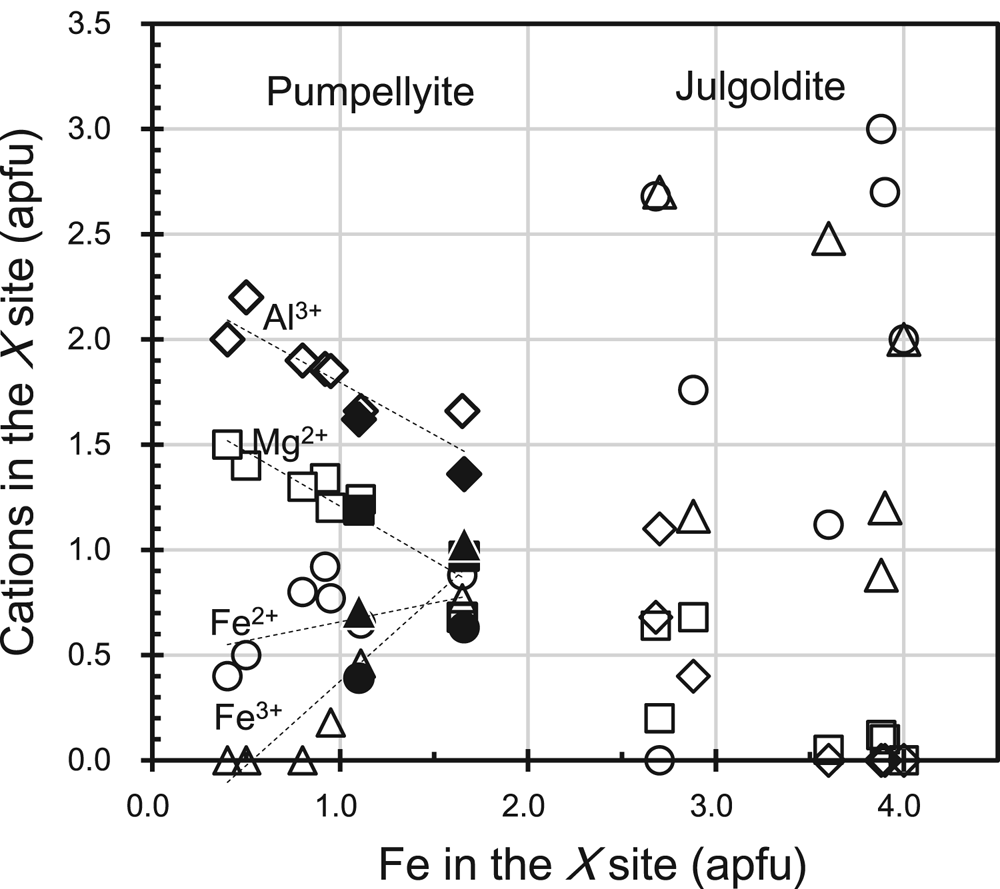
The XFe and YFe correspond to Fe2+ + Fe3+ in the X site and Fe3+ in the Y site, respectively. In the Y site, Fe3+ substitutes for Al3+ or is incorporated instead of Al3+, as has been repeatedly confirmed to date (e.g. Artioli and Geiger, Reference Artioli and Geiger1994; Akasaka et al., Reference Akasaka, Kimura, Omori, Sakakibara, Shinno and Togari1997; Nagashima et al., Reference Nagashima, Ishida and Akasaka2006). On the contrary, the increase of Fe at the X site is related to the decrease of Mg2+ and Al3+ (Fig. 6):


Mg2+, Fe2+, Fe3+ and Al3+ contents versus total Fe in the X site. Square: Mg2+, circle: Fe2+, triangle: Fe3+, diamond: Al3+. Closed marks are of CLW and CHG pumpellyites with XFe = 1.10 and 1.66 apfu, respectively, and open marks of the published pumpellyites and julgoldites. Data sources are listed in Table 8. Dashed lines are regression lines of XMg2+, XAl3+, XFe3+ and XFe2+, represented by equations 3–6, respectively, in the document.

The decreasing rates of Mg and Al with the increase of Fe at the X site are almost the same (equations 3 and 4). The higher rate of increase of Fe3+, 0.8018XFe3+ (apfu) per XFe, and the lower rate of increase of Fe2+, 0.1800XFe2+ per XFe, with increasing total Fe on the X site indicates that Fe3+ compensates for not only the decrease of Al but also the decrease of Mg, and that the contribution of the substitution Mg2+ + Al3+ ↔ Fe2+ + Fe3+ is rather limited. This result implies that the increase of Fe3+ over Fe2+ at the X site is a characteristic crystallochemical feature of Fe-rich pumpellyites in low-grade metamorphic rocks with zeolite to prehnite–pumpellyite facies or hydrothermally altered igneous rocks under high oxygen-fugacity conditions. At temperatures of zeolite-facies metamorphism where epidote cannot coexist with pumpellyite, Fe3+ concentrates in pumpellyite, whereas aluminous pumpellyites occurring in metamorphic rocks of the higher grade pumpellyite–actinolite facies are low in Fe3+ and high in Fe2+ contents (e.g. Coombs et al., Reference Coombs, Nakamura and Vuagnat1976), because of Fe3+ concentration in epidote coexisting with pumpellyite (Schiffman and Liou, Reference Schiffman and Liou1983). Thus, the increase in Fe3+ at the X site over Fe2+ in Fe-rich pumpellyite, including the CLW and CHG pumpellyites, can be attributed to the high Fe3+ content in the bulk composition of the host rocks and non-coexistence of pumpellyite with epidote.
The preference of the trivalent transition metal cation (M 3+) versus Al3+ in the X and Y sites is evaluated using the distribution coefficient K D = (M 3+/Al3+)X/(M 3+/Al3+)Y (Nagashima and Akasaka, Reference Nagashima and Akasaka2007; Nagashima et al., Reference Nagashima, Akasaka, Ikeda, Kyono and Makino2010; Hamada et al., Reference Hamada, Akasaka, Seto and Makino2010), and, thus, the distribution coefficient K D = (Fe3+/Al3+)X/(Fe3+/Al3+)Y for the distribution of Fe3+ and Al3+ in the X and Y sites can be applied to Fe-rich pumpellyites. The K D values of the CLW and CGH pumpellyites calculated using the determined site populations (Table 8) are 1.62 and 1.90, respectively, indicating a stronger preference for Fe3+ than Al3+ in the X site. Our results are consistent with the K D values of 1.44 and 1.12 for Fe-rich pumpellyites with 2.40 and 3.99 apfu total Fe, respectively, reported by Nagashima et al. (Reference Nagashima, Ishida and Akasaka2006).
As Nagashima et al. (Reference Nagashima, Akasaka, Ikeda, Kyono and Makino2010) pointed out, Cr3+ ions with a smaller ionic radius than Fe3+ prefer the X site with a larger octahedral volume than the Y site, which is also proved by K D values, defined as (Cr/Al)X/(Cr/Al)Y, of 3.56 and 4.39 after Nagashima and Akasaka (Reference Nagashima and Akasaka2007) and of 1.66–4.54 by Hamada et al. (Reference Hamada, Akasaka, Seto and Makino2010). The reason for different K D values of Fe3+ and Cr3+ compared to Al3+ has not been explained previously. Hamada et al. (Reference Hamada, Akasaka, Seto and Makino2010) noted that the K D values of Cr3+ versus Al tend to increase with increasing Cr content in pumpellyite, however the possible dependence of the K D values of Fe3+ versus Al on the Fe content in pumpellyite has not been described previously.
Dependence of structural properties on Fe content at the X and Y sites
As shown by the studies cited above, the influence of total Fe in the pumpellyite and Fe population at the X and Y sites on the pumpellyite structure has been well described using the bond lengths at the octahedral sites and the unit-cell parameters.
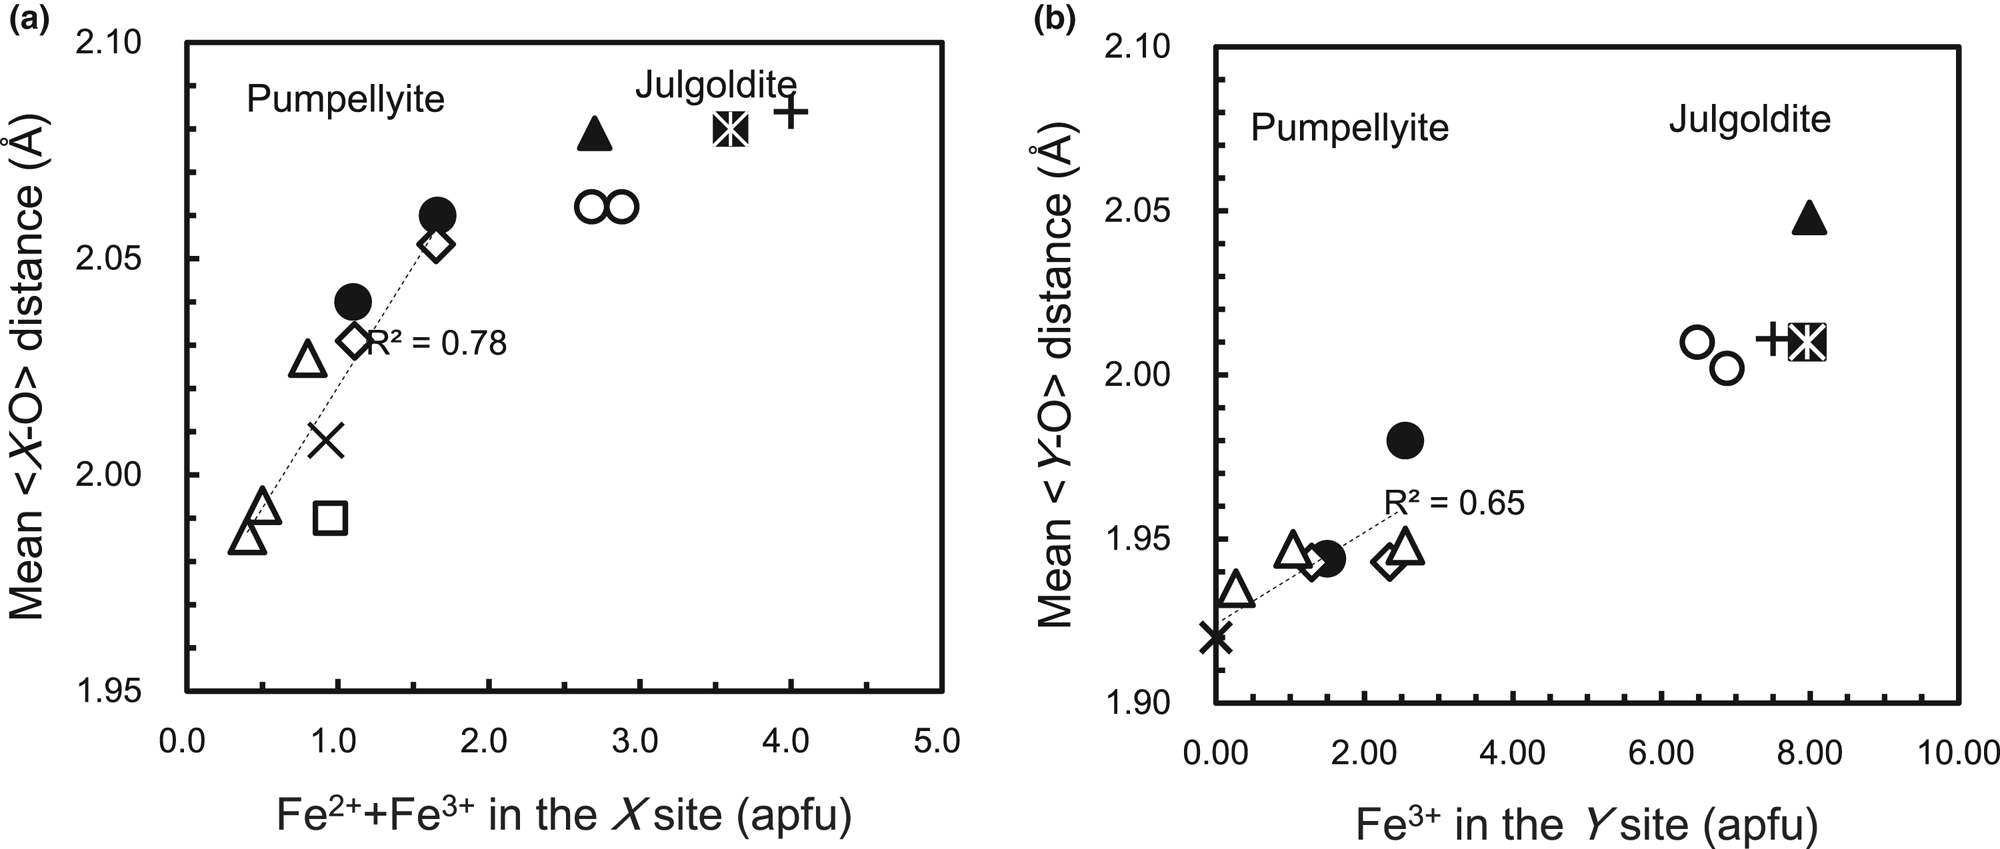
The mean <Y–O> distances of the CLW and CHG pumpellyites together with other Fe-bearing pumpellyites (Table 8) show an increase of the mean <Y−O> distance versus Fe3+ in the Y site (Fig. 7b):

(a) Variation of mean <X–O> distance with X[Fe2++Fe3+] and (b) mean <Y–O> distance with YFe3+ of pumpellyite and julgoldite listed in Table 8. Closed circle: CLW and CGH pumpellyites in this study; open diamond: Nagashima et al. (Reference Nagashima, Ishida and Akasaka2006); multiplication sign: Yoshiasa and Matsumoto (Reference Yoshiasa and Matsumoto1985); open square: Galli and Alberti (Reference Galli and Alberti1969); open triangle: Artioli and Geiger (Reference Artioli and Geiger1994); plus sign: Allmann and Donnay (Reference Allmann and Donnay1973); closed triangle: Artioli et al. (Reference Artioli, Geiger and Dapiaggi2003); open circle: Nagashima et al. Reference Nagashima, Cametti and Armbruster2018); closed star: Kasatkin et al. (Reference Kasatkin, Zubkova, Chukanov, Ksenofontov, Shkoda, Tishchenko, Voronin, Britvin and Pekov2021). Dashed lines in (a) and (b) are regression lines represented by equations 8 and 7, respectively, in the document.

The linear variation of the mean <Y−O> distance versus Fe3+ in the Y site has been shown previously by Nagashima et al. (Reference Nagashima, Ishida and Akasaka2006) in which, instead of Fe3+ content in the Y site, the average ionic radius at the Y site is employed. In addition, the mean <X‒O> distances of the CLW and CHG pumpellyites and published Fe-bearing pumpellyites (Table 8) show that the mean <X‒O> distance increases with increasing total Fe content at the X site (Fig. 7a):

The mean <X−O> distance per X[Fe2+ + Fe3+] apfu [0.056 Å] is larger than that of the mean <Y−O> distance per YFe3+ [0.0128 Å], which suggests that the simultaneous substitutions of Fe2+ for Mg2+ and of Fe3+ for Al3+ significantly affect the increase of the mean <X−O> distance.
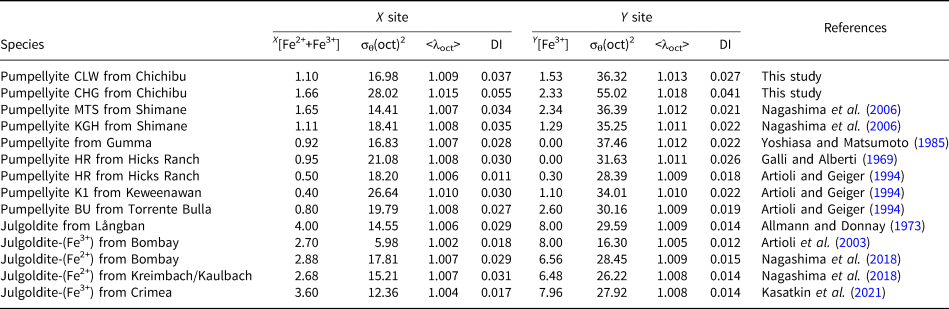
The changes in the mean <X−O> and <Y−O> distances versus Fe content in the X and Y sites correspond to the volumetric change of the XO6 and YO6 octahedra, and result in the change in distortion of XO6 and YO6 octahedra. The YO6 octahedra are geometrically more distorted than the centrosymmetric XO6 octahedra (Galli and Alberti, Reference Galli and Alberti1969; Yoshiasa and Matsumoto, Reference Yoshiasa and Matsumoto1985). Artioli and Geiger (Reference Artioli and Geiger1994) and Akasaka et al. (Reference Akasaka, Kimura, Omori, Sakakibara, Shinno and Togari1997) confirmed stronger Y-site distortion than the X site by applying the quadratic elongation <λoct> and bond-angle variance σθ(oct)2: X[<λoct>] < Y[<λoct>] and X[σθ(oct)2] < Y[σθ(oct)2] (Table 9; Fig. 8). However, the combined X-ray diffraction and 57Fe Mössbauer spectroscopic studies by Artioli et al. (Reference Artioli, Geiger and Dapiaggi2003) and Nagashima et al. (Reference Nagashima, Ishida and Akasaka2006) showed that Q.S. values of the Mössbauer doublets assigned to Fe3+ at the X site are larger than those of the doublets by Fe3+ at the Y site, which implies the stronger distortion of the XO6 octahedra than the YO6 octahedra. In addition, Nagashima et al. (Reference Nagashima, Ishida and Akasaka2006) found that, in contrast to the site distortion represented by the quadratic elongation <λoct>, the bond-length distortion index DI(oct) of the XO6 octahedra is larger than that of the YO6 octahedra (Table 9; Fig. 8), and, thus, the DI(oct) is consistent with the site distortion of the XO6 octahedra identified from the Mössbauer spectroscopic analysis. As shown in Table 9 and Fig. 8, the σθ(oct)2, <λoct> and DI(oct) for the Fe content in the Y site of the CLW pumpellyite are all in harmony with those reported for pumpellyites, and tend to decrease with increasing Fe content in the Y site. The σθ(oct)2, <λoct> and DI(oct) at the X site of the CLW pumpellyite are also similar to those of the published pumpellyites. Although a dependence of X[<λoct>] on Fe content in the X site is not observed, X[σθ(oct)2] and X[DI(oct)] show a weak decrease and an increase versus Fe content in the X site, respectively. Whereas the σθ(oct)2, <λoct> and DI(oct) at the X and Y sites in the CHG pumpellyite are significantly larger than those of the CLW and published pumpellyites. Its reason may be attributed to rather poor X-ray diffraction intensity data obtained from a small quantity of the CHG sample, as mentioned in the discussion for the valence sums of the CGH pumpellyite (Table 7). Despite this problem, the relationships X[<λoct>] <Y[<λoct>], X[σθ(oct)2] <Y[σθ(oct)2], and X[DI]> Y[DI] and the contradictory relationship for site distortion between <λoct> and DI are also the case in the CGH pumpellyite (Table 9; Fig. 8), and, thus, are consistent with those of the CLW pumpellyite and the reported Fe-bearing pumpellyites. As concluded by Nagashima et al. (Reference Nagashima, Ishida and Akasaka2006), the bond-length distortion index, DI(oct), of pumpellyite agrees with the distortion of the octahedral sites inferred by Mössbauer spectroscopy.
Changes in quadratic elongation <λoct>, bond angle variance σθ(oct)2, and bond length distortion index DI(oct) at the X site versus Fe2+ + Fe3+ (apfu) in the X site (a) and at the Y site (b) versus Fe3+ (apfu) in the Y site of pumpellyites and julgoldites listed in Table 9. Closed circle: CLW and CGH pumpellyites in this study with XFe = 1.10 and 1.66 apfu, respectively; open diamond: Nagashima et al. (Reference Nagashima, Ishida and Akasaka2006); multiplication sign: Yoshiasa and Matsumoto (Reference Yoshiasa and Matsumoto1985); open square: Galli and Alberti (Reference Galli and Alberti1969); open triangle: Artioli and Geiger (Reference Artioli and Geiger1994); plus sign: Allmann and Donnay (Reference Allmann and Donnay1973); closed triangle: Artioli et al. (Reference Artioli, Geiger and Dapiaggi2003); open circle: Nagashima et al. (Reference Nagashima, Cametti and Armbruster2018); closed star: Kasatkin et al. (Reference Kasatkin, Zubkova, Chukanov, Ksenofontov, Shkoda, Tishchenko, Voronin, Britvin and Pekov2021).

X-site distortion versus Fe2++Fe3+ in the X-site and Y-site distortion versus Fe3+ in the Y site in pumpellyite and julgoldite.*

* Notes: σθ(oct)2 and <λoct> are angular and bond-length distortion indices by Robinson et al. (Reference Robinson, Gibbs and Ribbe1971), respectively; DI is distortion index by Baur (Reference Baur1974).
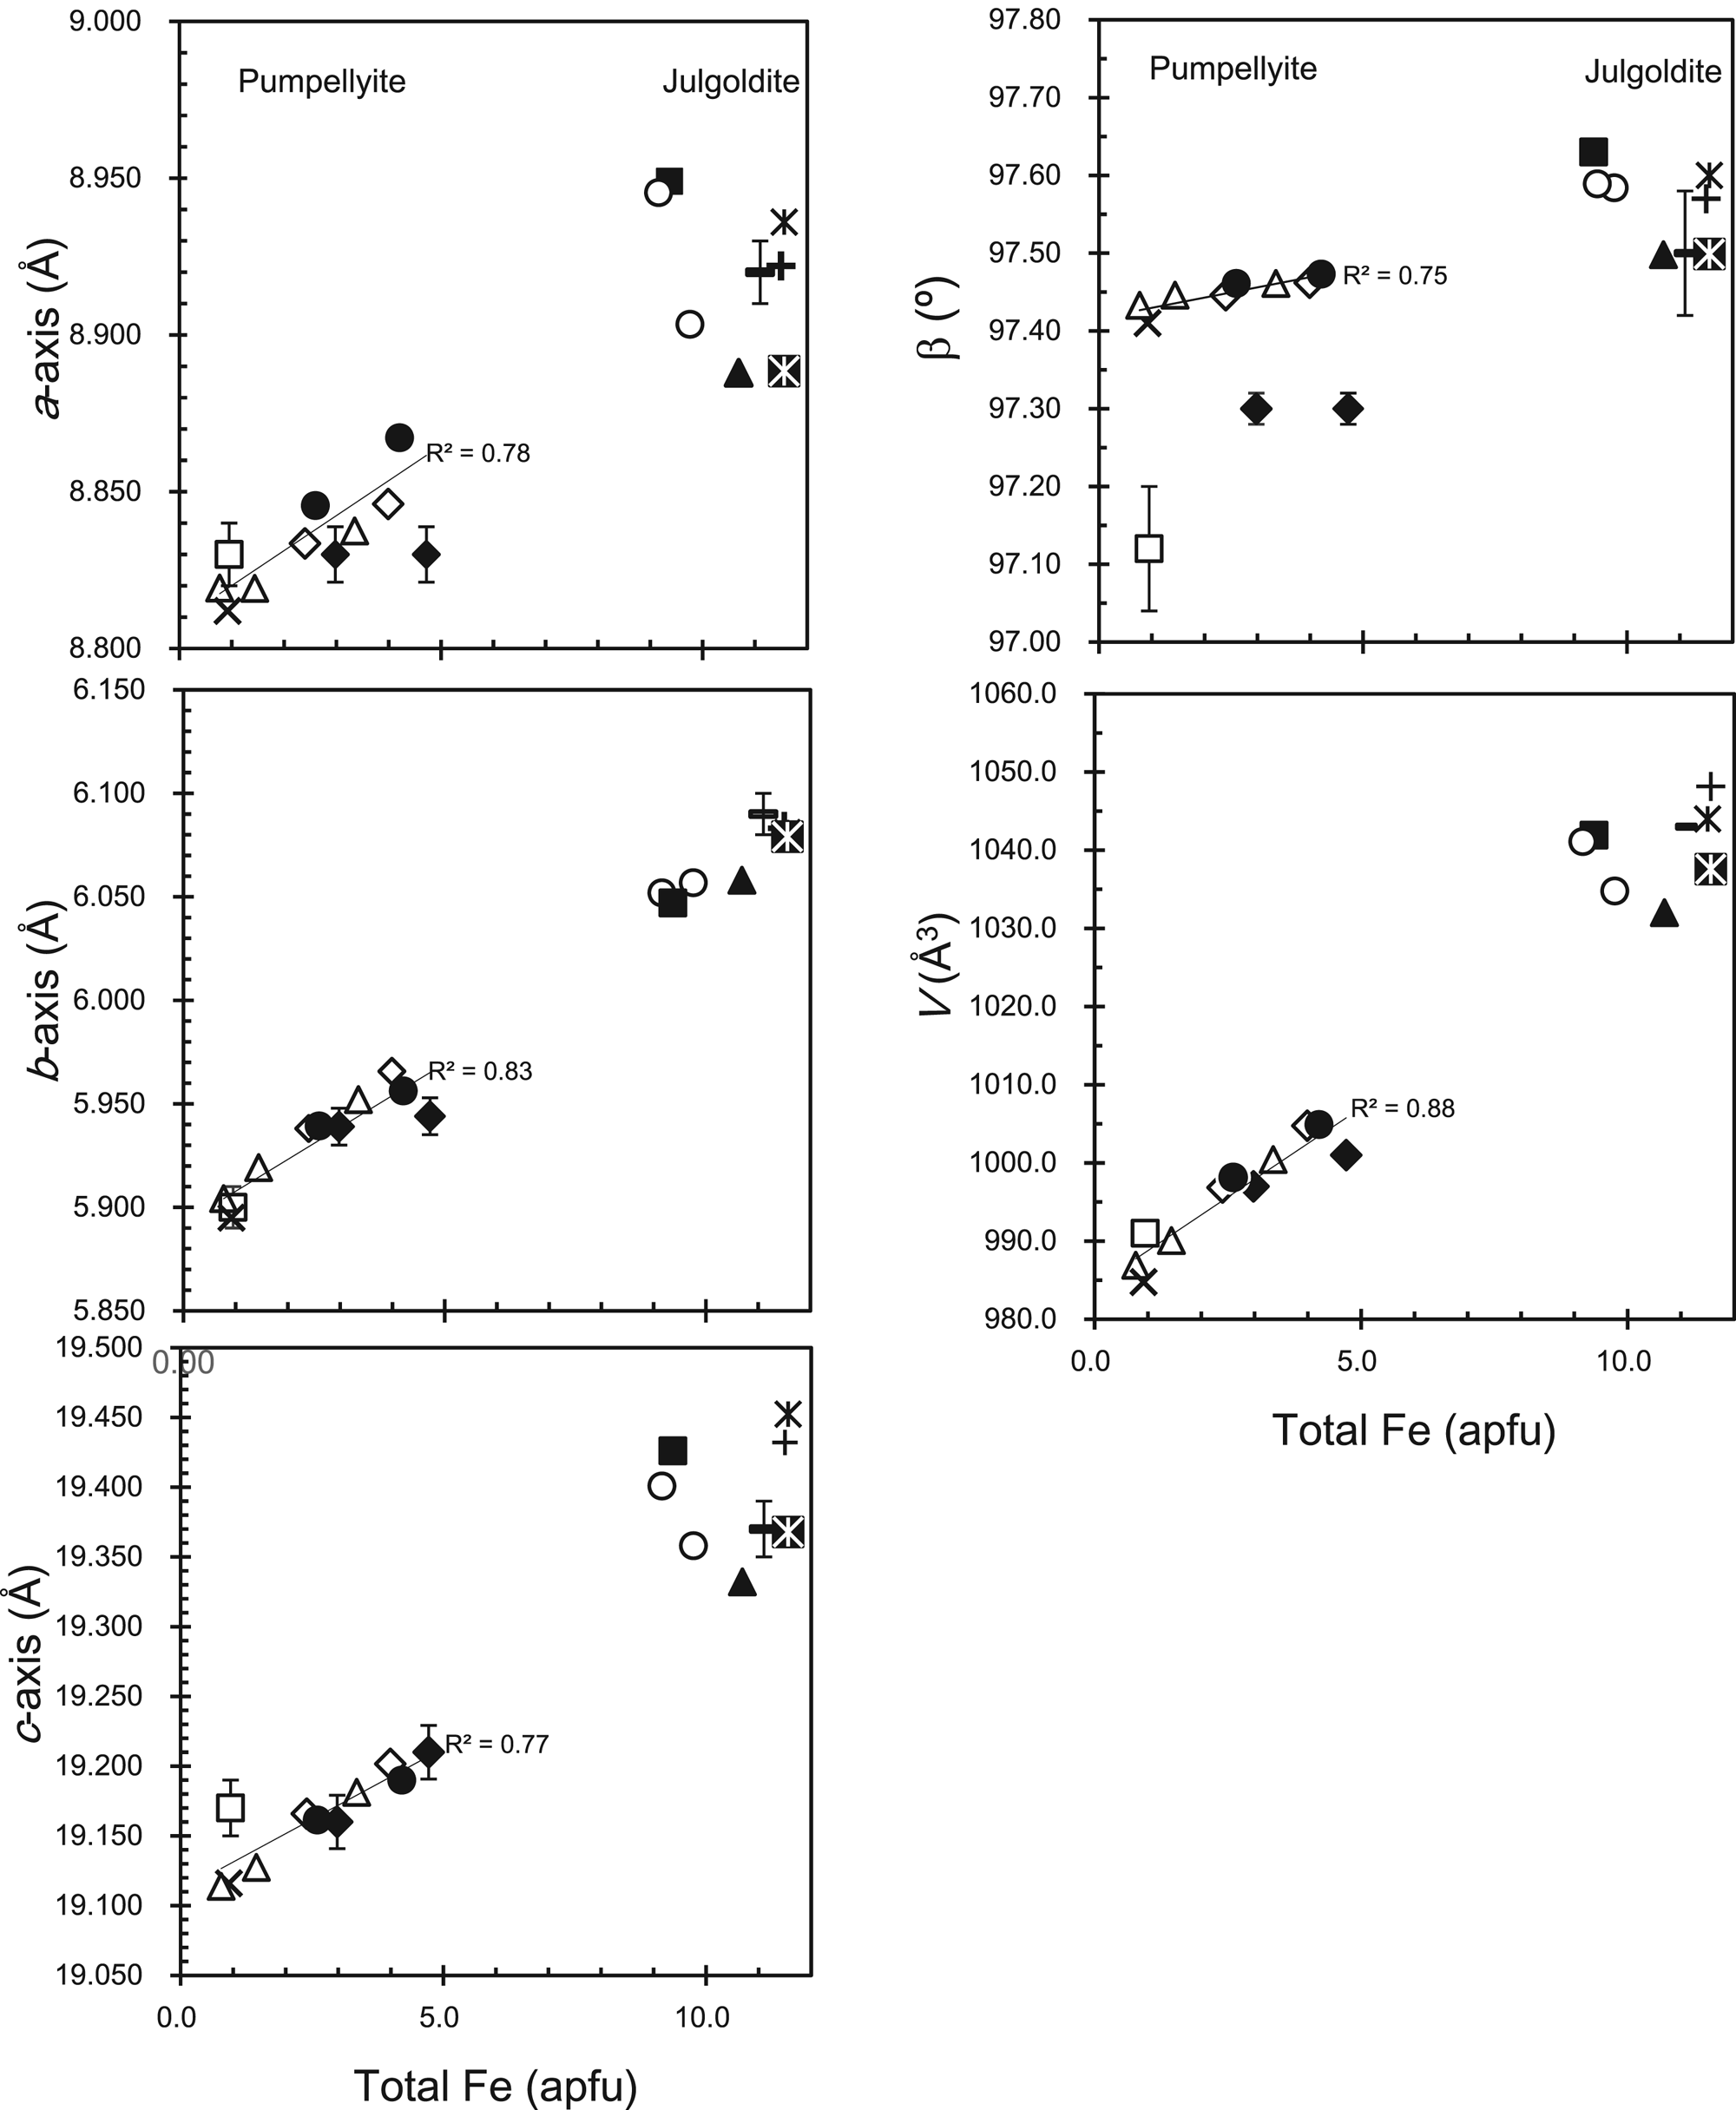
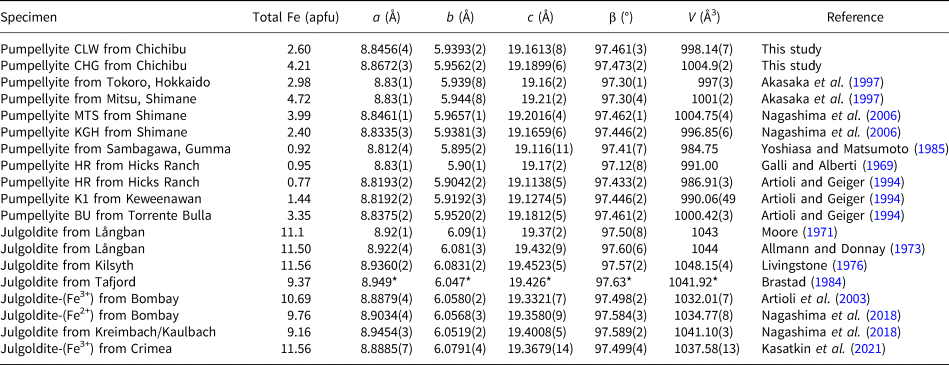
The a-, b-, and c-dimensions and cell volumes of the CLW and CGH pumpellyites are consistent with those of published pumpellyites (Table 10 and Fig. 9). The β angles of the CLW and CHG pumpellyites are also in harmony with those of the published pumpellyites, except for the data for the Hicks Ranch pumpellyite by Galli and Alberti (Reference Galli and Alberti1969) and of Tokoro and Mitsu pumpellyites by Akasaka et al. (Reference Akasaka, Kimura, Omori, Sakakibara, Shinno and Togari1997). However, according to the new unit-cell parameters of the Hicks Ranch and Mitsu pumpellyites obtained using the X-ray Rietveld refinement by Artioli and Geiger (Reference Artioli and Geiger1994) and Nagashima et al. (Reference Nagashima, Ishida and Akasaka2006), respectively, the β angles of the Hicks Ranch and the Mitsu pumpellyites are 97.433(2)° and 97.462(1)°, respectively, and agree with the values of the CLW and CHG pumpellyites and other published pumpellyites (Table 10; Fig. 9).
Variation of unit-cell parameters and cell volume versus total Fe (apfu) in pumpellyite and julgoldite listed in Table 10. Closed circle: CLW and CGH pumpellyites in this study with total Fe of 2.60 and 4.21 apfu, respectively; closed diamond: Akasaka et al. (Reference Akasaka, Kimura, Omori, Sakakibara, Shinno and Togari1997); open diamond: Nagashima et al. (Reference Nagashima, Ishida and Akasaka2006); multiplication sign: Yoshiasa and Matsumoto (Reference Yoshiasa and Matsumoto1985); open square: Galli and Alberti (Reference Galli and Alberti1969); open triangle: Artioli and Geiger (Reference Artioli and Geiger1994); horizontal bar with error bar: Moore (Reference Moore1971); plus sign: Allmann and Donnay (Reference Allmann and Donnay1973); star: Livingstone (Reference Livingstone1976); closed square: Brastad (Reference Brastad1984); closed triangle: Artioli et al. (Reference Artioli, Geiger and Dapiaggi2003); open circle: Nagashima et al. (Reference Nagashima, Cametti and Armbruster2018); closed star: Kasatkin et al. (Reference Kasatkin, Zubkova, Chukanov, Ksenofontov, Shkoda, Tishchenko, Voronin, Britvin and Pekov2021). Regression lines of unit-cell parameters and cell volume for pumpellyite are represented by equations 9–13 in the document.

Unit-cell parameters and cell volumes of pumpellyite and julgoldite in this study and published literature.

* Errors are not shown in Brastad (Reference Brastad1984).
The regression lines of the unit-cell parameters and the cell volume versus total Fe (Fig. 9) in the present study and published data listed in Table 10 are:


Therefore, the chemical composition and structure results for the CLW and CHG pumpellyites support the proposed interpretation that the change in the size of the XO6 and YO6 octahedra caused by the continuous and simultaneous change of (Fe2+ + Fe3+) content in the X site and of Fe3+ in the Y site result in the systematic change in structure.
Implication
Empirical estimation of Fe2+ and Fe3+ contents and cation distributions in the octahedral sites from total Fe contents
Additional precise and accurate data on the intracrystalline distribution of cations and the structural properties of pumpellyite are required for understanding the crystallochemical rule on the distribution of trivalent cations in the octahedral sites of pumpellyite. However, equations 1 and 2, representing the regression lines for the Fe contents at the X and Y sites versus the total Fe content in pumpellyite, and equations 3–6 for the number of cations at the X site versus the total Fe content at the X site, can be used to give an empirical estimation of a structural formula from only EMPA data. Firstly, the Fe contents at the X and Y sites (XFe and YFe, respectively) are estimated using equations 1 and 2; secondly, the Mg, Al3+, Fe3+, and Fe2+ contents in the X site are estimated by applying XFe to equations 3–6. For example, by applying total Fe content, 2.49 apfu, in the CLW pumpellyite to equations 1 and 2, XFe = 1.05 and YFe = 1.43 apfu are calculated; then from XFe = 1.05 apfu and equations 3–6, XMg = 1.18, XAl3+ = 1.77, XFe3+ = 0.42, XFe2+ = 0.67 apfu are calculated. Finally, the estimated site population at the X and Y sites is written as X[Mg1.18Fe2+0.67Fe3+0.42Al1.77]Σ4.04Y [Fe3+1.43Al6.57]Σ8.00 (apfu). Similarly, the site population at the X and Y sites of the CHG pumpellyite with 4.15 apfu total Fe content (EMPA data in Table 1) is estimated as X[Mg0.92Fe2+0.76Fe3+0.83Al1.52]Σ4.03Y [Fe3+2.67Al5.33]Σ8.00.
Alternatively, the Fe3+ and Al3+ distribution in the X and Y sites can be also estimated by applying K D, defined as (Fe3+/Al3+)X/(Fe3+/Al3+)Y. Although the K D values in the present study and published ones are somewhat variable, 1.12–1.90, by using the average K D value, K D = 1.52, the Fe3+ and Al3+ populations in the X and Y sites are calculated to be X[Fe3+0.63Al3+1.70]Y[Fe3+1.58Al3+6.42] and X[Fe3+1.00Al3+1.39]Y[Fe3+2.58Al3+5.42] (apfu) for the CLW and CHG pumpellyites, respectively.
The experimentally determined site populations of the CLW and CHG pumpellyites are X[Mg1.19Mn2+0.09Fe2+0.39Fe3+0.71Al1.62]Y[Fe3+1.50Al6.50] and X[Mg0.97Mn2+0.02Fe2+0.63Fe3+1.03Al1.36]Y[Fe3+2.55Al5.45] in apfu, respectively (Table 8), which is close to the estimated Fe3+ and Al3+ contents at the X and Y sites, from applying equations 1–6 and K D values, above. Therefore, if determination of the intracrystalline distribution of Fe in Fe-rich pumpellyite is not possible because of analytical difficulties, the Fe2+ and Fe3+ contents and a structural formula, can be derived using the above methods, and help to contribute to understanding its crystallochemical feature.
Empirical estimation of mean <X–O> and <Y–O> distances and unit-cell parameters from Fe contents
Even when X-ray diffraction data of Fe-rich pumpellyite are not available, the site populations at the X and Y sites estimated from total Fe content enable us to predict the mean <X–O> and <Y–O> distances using equations 7 and 8. In the case of CLW pumpellyite with a total Fe content of 2.49 apfu, the mean <X–O> and <Y–O> distances are calculated to be mean <X–O> = 2.023 Å and mean <Y–O> = 1.944 Å, which are very consistent with those determined: 2.040 Å and 1.944 Å, respectively. Furthermore, the estimated mean <X–O> and <Y–O> distances of the CGH pumpellyite with total Fe of 4.15 apfu, mean <X–O> = 2.052 Å and mean <Y–O> = 1.961 Å, are similar to the determined values, <X–O> = 2.060 Å and mean <Y–O> = 1.980 Å (Table 4).
Equations 9–13 enable the estimation of unit-cell parameters from total Fe contents in pumpellyite. Calculated unit-cell parameters of the CLW and CGH pumpellyites are a = 8.837, b = 5.931, c = 19.162 Å and β = 97.45°, resulting in cell volume V = 995.6 Å3, and a = 8.855, b = 5.956, c = 19.196 Å and β = 97.47°, with V = 1003.2 Å3, respectively, and close to those determined, listed in Table 2.
The unit-cell parameters and mean bond lengths estimated for a pumpellyite for which no structural data are available provide clues about the structural features of the pumpellyite and provide motivation for a future complete analysis of the crystal structure.
Common and unique features of cation distribution in Fe-rich pumpellyite and julgoldite
As shown in Fig. 9, the change in unit-cell parameters and lattice volume with Fe content in pumpellyite is linearly related to that in julgoldite, which illustrates the commonality of structural changes with Fe content in pumpellyite and julgoldite. The change of the mean <Y–O> distance versus Fe3+ content in the Y site also shows a common structural feature in pumpellyite and julgoldite: the mean <Y–O> distances of julgoldites are on the extension of the regression line of the mean <Y–O> distance versus Fe3+ in the Y site of pumpellyite (Fig. 7b). However, as shown in Fig. 7a, the variation trend of the mean <X–O> distance versus (Fe2++Fe3+) of the X site in pumpellyite does not lead linearly to that of julgoldite, because the increasing rate of the mean <X–O> distance in julgoldite, 0.0126 Å/ X[Fe2++Fe3+] apfu, is significantly smaller than 0.056 Å/ X[Fe2++Fe3+] apfu of pumpellyite (equation 8), and rather close to the gradient of the mean <Y–O> distance of pumpellyite and julgoldite, 0.014 Å/ Y[Fe3+] (equation 7). As the increase of the mean <X–O> distance in pumpellyite is due to the increase of both Fe2+ and Fe3+ in the X site, and the mean <Y–O> distance increases with the substitution of Fe3+ for Al3+, the increasing rate of the mean <X–O> distance versus X[Fe2++Fe3+] of julgoldite suggests an increase of Fe3+ in the X site. On this basis, almost half of the X sites in julgoldite are filled initially with Fe2+, and the subsequent increase in Fe3+ in julgoldite leads to an increase in Fe3+ at the X sites. As shown in Table 8 and Fig. 6, Mg and Al in julgoldite decrease along the XMg – X[Fe2++Fe3+] and XAl – X[Fe2++Fe3+] trends of pumpellyite, respectively, and become almost nil in julgoldites with X[Fe2++Fe3+] > 3. However, in contrast to the systematic variation of Fe2+ and Fe3+ in the X site of pumpellyites, the reported Fe2+ and Fe3+ contents in the X site of julgoldites are significantly variable (Table 8; Fig. 6). Thus, the above interpretation on the different variation trend of the mean <X–O> distance versus X[Fe2++Fe3+] between pumpellyite and julgoldite is not certain at present, and further data on Fe2+ and Fe3+ contents and their site populations are required.
Conclusions
Intracrystalline distribution of cations and structural properties of two Fe-rich pumpellyites with average total Fe2O3 contents of 10.01(169) and 16.07(108) wt.%, separated from green rocks, subjected to prehnite–pumpellyite-facies metamorphism, of the Kanogawa unit, the northern Chichibu belt, western Shikoku, have been clarified. The determined structural formula of the former is W(Ca7.96Na0.01K0.02)Σ7.99X(Mg1.19Mn2+0.09Fe2+0.39Fe3+0.71Al1.62)Σ4.00Y(Al6.47Fe3+1.50V0.02Ti0.01)Σ8.00Si12.26O43.33(OH)12.67, and that of the latter W(Ca8.01K0.01)Σ8.02X(Mg0.97 Mn2+0.02Fe2+0.63Fe3+1.03Al1.36)Σ4.01Y(Al5.44Fe3+2.55V0.01)Σ8.00Si12.02O42.69(OH)13.31, and, thus, the former and the latter are identified as pumpellyite-(Al). The distribution coefficients of Fe3+ versus Al3+ between the X and Y sites are K D = 1.62 and 1.90 for the former and latter, respectively, implying a stronger preference for Fe3+ in the X site than Al3+. The results of the present study and published studies for Fe-rich pumpellyites indicate that Mg2+ and Al3+ in the X site decrease linearly (equations 3 and 4) and [Fe2+ + Fe3+] increase instead (equation 1), but the increase of Fe3+ is more significant than Fe2+ (equations 5 and 6), whereas, in the Y site, Fe3+ increases linearly versus total Fe in pumpellyite (equation 2). The average interatomic distances at the X and Y sites correlate well with the [Fe2+ + Fe3+] in the X site (equation 8) and Fe3+ in the Y site (equation 7), respectively, and the unit-cell parameters and cell volume change linearly versus total Fe in pumpellyite (equations 9–13). Those relationships are applicable for the estimation of cation contents, including Fe2+ and Fe3+, in the X and Y sites and of the structural features, such as mean bond lengths at the octahedral sites and the unit-cell parameters, from total Fe content in pumpellyite. In addition, the systematic variation of cation population and structural features for Fe content in pumpellyite helps to evaluate the relationship between Fe content and cation distribution and structural properties in julgoldite.
Acknowledgements
This paper is based on a master thesis study by Y. Goishi (Imaizumi) when she was a student at the Department of Geoscience, Graduate School of Science and Engineering, Shimane University. Y. Goishi (Imaizumi) and M. Akasaka thank Drs. Maki Hamada (present affiliation: Kanazawa University) and Terumi Ejima (present affiliation: Shinshu University) for their help with field investigation and collecting samples, and Dr. Mariko Nagashima of Yamaguchi University for her helpful discussion and advice for the investigation of Fe-rich pumpellyite and X-ray Rietveld refinement. Thanks to the late Dr. Fujio Izumi of the National Institute for Materials Science and Dr. Koichi Momma of the National Museum of Nature and Science for their permission to use the RIETAN-FP and VESTA programs. This paper is dedicated to the late Dr. Kenji Togari (Professor of Hokkaido University), the late Dr. Teruo Watanabe (Professor of Hokkaido University), the late Dr. Kenzo Yagi (Professor emeritus of Hokkaido University and Tohoku University), the late Dr. Kosuke Onuma (Professor emeritus of Tohoku University), and the late Dr. Jiro Ishii (Professor of Tokai University), who had guided and supported M.A. for many years.
Supplementary material
The supplementary material for this article can be found at https://doi.org/10.1180/mgm.2023.80.
Competing interests
The authors declare none.