Introduction
In the 1980s and 1990s, many workers were affected by rising competitiveness as organizations strove to increase their effectiveness. This was often implemented by means of reorganization, restructuring, outsourcing, mergers and acquisitions. As a general rule, these changes involved redundancies and increased numbers of short-term contracts, prompting job insecurity among those remaining in employment (European Agency for Safety and Health at Work, 2007). Paradoxically, in the later 1990s and early 2000s, there was a desire among some workers to change jobs every 2–3 years, as this was seen as a route to advancement.
In the UK, the unemployment rate for the 3 months to March 2009 was 7.1%, up 0.8 over the previous quarter and up 1.8 over the year. The number of unemployed people increased by 244 000 over the quarter and by 592 000 over the year, to reach 2.22 million. These changes represent the largest quarterly increases in the unemployment level and rate since 1981 (National Statistics, 2009).
In 2009, as the worldwide recession takes hold, a detailed analysis of the relationship between job insecurity and mental health takes on additional salience in the context of rising unemployment and huge personal debt.
A considerable number of studies have investigated the relationship between job insecurity and mental health. A meta-analysis of 37 surveys carried out in the years 1980–1999, covering approximately 15 000 respondents, showed that job insecurity was highly associated with poorer mental health (Sverke et al. Reference Sverke, Hellgren and Näswall2002). A later review of the relationship between psychological work stressors (including job insecurity) and mental ill health, based on a meta-analysis of longitudinal studies from 1994–2005 (Stansfeld & Candy, Reference Stansfeld and Candy2006), found that high job insecurity was one of several job stressors that predicted common mental disorders. However, the relationship was different for men and women. A similarly focused review by Bonde (Reference Bonde2008), of 63 000 employees from 16 studies, concluded that the perception of adverse psychosocial conditions in the workplace is related to an increased risk of depressive symptoms or major depressive episode. The most important aspect of job insecurity associated with worsening mental health is the fear of not working (Hellgren et al. Reference Hellgren, Sverke and Isaksson1999), in contrast to, for example, the loss of a regular income or friendship of work colleagues.
Is the relationship between job insecurity and poor mental health affected by individual socio-economic circumstances? Simmons & Swanberg (Reference Simmons and Swanberg2008) showed that, for poor employees in the USA, job insecurity remained the only significant correlate of depressive symptoms after controlling for other demographic and work environment characteristics. For more affluent employees, high psychological demands and low supervisor and co-worker support were associated with depressive symptoms.
This aim of this paper is to examine the relationship between job insecurity and depression among workers and to investigate whether this is mediated by their socio-economic circumstances controlling for age and sex.
Method
Sampling procedures
This analysis is based on a stratified multi-stage random probability sample selected for the third national survey of psychiatric morbidity among adults in England carried out in 2007 (McManus et al. Reference McManus, Meltzer, Brugha, Bebbington and Jenkins2009).
In the first phase of sampling, postcode sectors (on average 2550 households) were stratified on the basis of a measure of socio-economic status within a regional breakdown. (Postal sectors comprise numerous postcodes. Hence, the postal sector AB1 2 is potentially composed of postcodes AB1 2AA to AB1 2ZZ.)
Initially, postcode sectors, representing the primary sampling units, were stratified by Strategic Health Authorities (SHAs). All the primary sampling units within each SHA were then further stratified on the basis of the proportion of persons in non-manual classes and sorted by the proportion of households without a car based on 2001 census data. Then postal sectors were sampled from each stratum with a probability proportional to size (where size is measured by the number of delivery points). In this way, a total of 519 postal sectors were selected in England.
In the second stage of sampling, 28 delivery points were randomly selected within each of the selected postal sectors. This yielded a total sample of 14 532 delivery points. Interviewers visited these addresses to identify private households with at least one person aged ⩾16 years. In total, 9% (1318) of the selected addresses were found not to contain private households and were excluded from the survey sample. Within the potentially eligible sample of 12 694 addresses, one person was randomly selected in each household where contact was made to take part in the survey. The residents of 57% of all eligible households agreed to take part in an interview: 7461 people.
Although national surveys do have the advantage of producing data on large representative samples there is growing concern about falling response rates (de Leeuw & de Heer, Reference de Leeuw and de Heer2002). The weighting procedures described below show that great care was taken in trying to reduce potential biases caused by non-response.
Interviewers and interviewing procedures
Experienced interviewers from the National Centre for Social Research were selected to work on the survey, many of whom had worked previously on health-related surveys. Interviewers were fully briefed on the administration of the survey. Topics covered on the 1-day survey-specific training included introducing the survey, the questionnaire content, confidentiality and how to handle respondent distress. The fieldwork took place over the course of 1 year.
Weighting procedures
Weighted survey data were analysed using SPSS version 16.0 (SPSS Inc., USA). Data were weighted to take account of non-response in order that the results were representative of the household population aged ⩾16 years in England. Weighting occurred in three steps. First, sample weights were applied to take account of the different probabilities of selecting respondents in different sized households. Second, in order to reduce household non-response bias, a household level weight was calculated from a logistic regression model using interviewer observation and area-level variables (collected from census 2001 data) available for responding and non-responding households. The model showed that the propensity for a household to respond was lower in the West Midlands, East of England, London, South East and the South West (relative to the North East), higher for households with no physical barriers to entry to the property and higher in areas with a relatively high percentage of households being owner-occupied. The non-response weight for each household was calculated as the inverse of the probability of response estimated from the model, multiplied by the household's selection weight.
Finally, weights were applied using the techniques of calibration weighting based on age, sex and region to weight the data up to represent the structure of the national population, to take account of differential non-response between regions and age-by-sex groups. The population control totals used were the Office for National Statistics 2006 mid-year household population estimates. Young men have the worse response rates to surveys and hence have bigger weights than other groups.
Instruments
Depression
Depression was identified from the module on common mental disorders (CMD) in the national survey, which included the revised Clinical Interview Schedule (CIS-R; Lewis & Pelosi, Reference Lewis and Pelosi1990).
Six categories of CMD – generalized anxiety disorder, depression, obsessive-compulsive disorder, phobia, panic disorder and mixed anxiety and depressive disorder – were generated in two stages. First, respondents' responses to the CIS-R were used to produce specific ICD-10 diagnoses of neurotic disorders, e.g. mild depressive episode without somatic symptoms or specific, isolated phobias. This was done by applying the WHO diagnostic criteria for research (WHO, 1993). Second, the range of ICD-10 diagnoses were grouped together to produce the six categories used in the calculation of prevalence. For the purposes of the current analysis we combined the categories of depressive episode and mixed anxiety-depression into an overall category of depression.
Job insecurity
Questions on work-related stress (based on items taken from Siegfrist's Effort – Reward Imbalance model) were included as a module in the questionnaire for the national survey of psychiatric morbidity (Siegrist, Reference Siegrist1996). The item relating to job insecurity was: ‘My job security is poor’. Respondents were asked to rate the extent to which they agreed or disagreed on this item on a 4-point Likert scale. A binary variable was created, which combined the ‘agree’ and ‘slightly agree’ codes and the ‘disagree’ and ‘slightly disagree’ codes.
Debt
Survey respondents were asked: ‘Have there been times in the past year when you were seriously behind in paying within the time allowed for any of these items?’ The list included rent, gas, electricity, water, goods bought on hire purchase, mortgage repayments, council tax, credit card payments, mail order payments, telephone, other loans, TV licence, road tax, social fund loan, child support or maintenance. Being behind in any of these payments was regarded as having a debt.
Socio-economic classification
From 2001, the National Statistics Socio-economic Classification (NS-SEC) has been used for all official statistics and surveys in Great Britain, replacing Social Class based on Occupation (formerly Registrar General's Social Class) and Socio-economic Groups. The NS-SEC is an occupationally based classification but has rules to provide coverage of the whole adult population. The NS-SEC is created from: (a) occupation coded to the unit groups of the Standard Occupational Classification 2000; (b) details of employment status (whether an employer, self-employed or employee; whether a supervisor, manager, etc.).
The five-class version of self-coded NS-SEC has the following classes:
Class 1: Managerial and professional occupations.
Class 2: Intermediate occupations.
Class 3: Small employers and own account workers.
Class 4: Lower supervisory and technical occupations.
Class 5: Semi-routine and routine occupations.
Results
Job insecurity
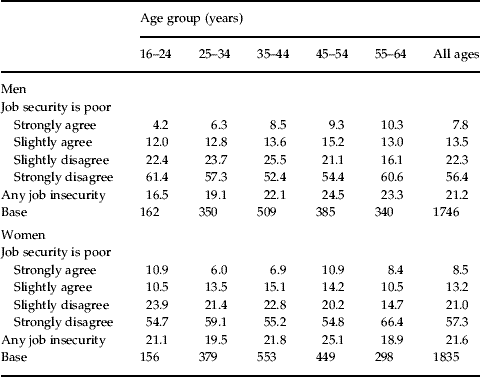
In 2007, just over one-fifth (21.4%) of workers in England, aged 16–64 years, reported feeling at least some degree of job insecurity, the proportions being similar in male and female workers. However, among male workers, job insecurity increased with age, rising from 16.5% of 16- to 24-year-olds to 24.5% of 45- to 54-year-olds (χ2=9.68, degrees of freedom=4, p<0.05), whereas there was no discernible pattern for women (see Table 1).
Feelings of job insecurity by age and sex among workers

Values given are percentages.
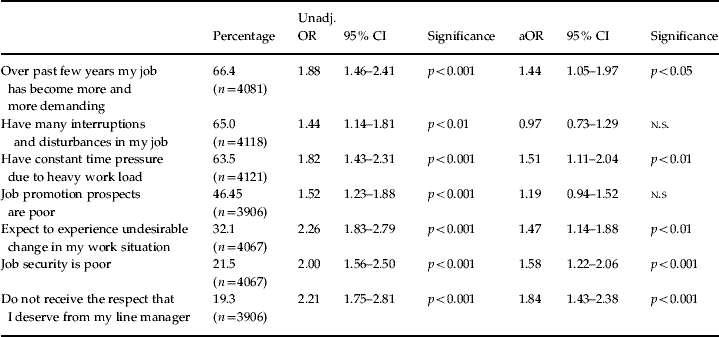
A greater percentage of workers expressed concern with job features other than job insecurity. About two-thirds of workers agreed that over the past years their jobs had become more demanding (66.4%), there were many interruptions or disturbances in their job (65.0%) or they were under constant time pressure from a heavy work load (63.5%).
Job insecurity and depression
However, in terms of a significant association with depression [measured by unadjusted odds ratios (OR)], the three job characteristics with an OR ⩾2 were: ‘I expect to experience undesirable change in work situation’ [OR 2.26, 95% confidence interval (CI) 1.83–2.79, p<0.001); ‘I do not receive the respect that I deserve from my line manager’ (OR 2.21, 95% CI 1.43–2.28, p<0.001) and ‘my job security is poor’ (OR 2.00, 95% CI 1.56–2.50, p<0.001).
Analysing all job characteristics together, the likelihood of depression in those agreeing that their job security was poor remained significant (OR 1.58, 95% CI 1.22–2.06, p<0.001) (Table 2).
Rating of job characteristics by workers and their association with depression

Unadj. OR, unadjusted odds ratio; aOR, adjusted odds ratio; CI, confidence interval; n.s., non-significant.
Job insecurity, debt, socio-economic circumstances and depression
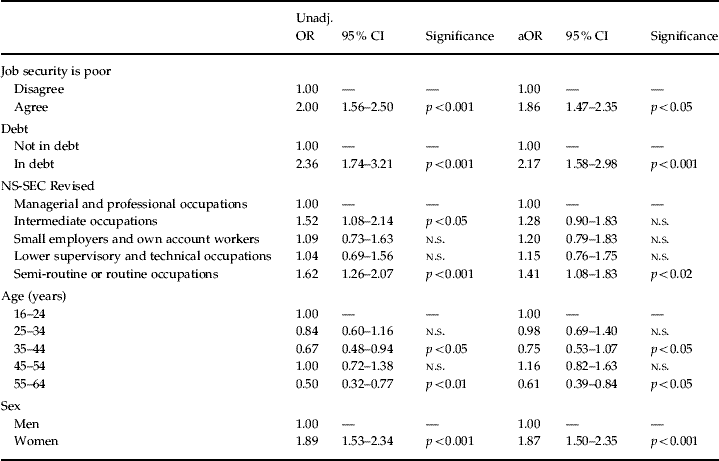
To examine the relationship between job insecurity and depression in a financial context, two measures were used (debt and a socio-economic classification based on several facets of occupation) to avoid the difficulties involved in using gross household income. The latter tends to have the highest level of missing data in UK surveys. After controlling for age and sex, job insecurity (OR 1.86, 95% CI 1.47–2.35, p<0.001), being in debt (OR 2.17, 95% CI 1.58–2.98, p<0.001) and working in semi-routine or routine occupations (OR 1.41, 95% CI 1.08–1.83, p<0.02) were independently associated with an increased likelihood of depression.
Although the sample size of those with both job insecurity and in debt was relatively small, women were about twice as likely as men to be assessed as having depression: 34.8% (n=46) compared with 15% (n=40) (Table 3).
Job security, debt, National Statistics Socio-economic Classification (NS-SEC) and biographic correlates of depression

Unadj. OR, unadjusted odds ratio; aOR, adjusted odds ratio; CI, confidence interval; n.s., non-significant.
Discussion
The lack of a clear difference in the proportions of working men and women with feelings of job insecurity and between workers of different ages should be seen against the background of the rather unclear and equivocal findings from previous research (European Agency for Safety and Health at Work (2007). Statistics compiled by Organization for Economic Cooperation and Development (1997) suggest that in most European countries job insecurity decreases with age yet in Finland, The Netherlands and the UK it increases. These variations are quite likely to be the result of differences in the context and circumstances of employment in different jurisdictions.
Although job insecurity was one of the less frequently reported work stressors, in contrast to the demands of the job, being under increasing time pressure and being moved from one task to another, it was one of the three factors most strongly associated with feelings of depression, along with the expectation of experiencing undesirable changes at work. This may be explained by the distinction in the possibility of control at the micro and macro levels. Workers can ask for their workload to be reduced or request training to cope with carrying out multiple tasks. Thus, to some extent, they have a degree of influence over what they do. However, the organizational level, relating to restructuring and redundancies within a rapidly changing economic climate, is likely to be seen as beyond their realm of influence. These data are cross-sectional and the possibility of reverse causality should be remembered: job insecurity may be more frequently reported by people rendered pessimistic by a mood disorder (Ferrie et al. Reference Ferrie, Shipley, Newman, Stansfeld and Marmot2005).
There is a plethora of survey data showing that unemployed people are more likely to be depressed than those at work (Meltzer et al. Reference Meltzer, Gill, Petticrew and Hinds1995). However, our results emphasize that even among the employed there are stresses that may be depressogenic. Our sample of employed people were in receipt of a salary, of whatever amount. We found that job security and debt were independent correlates of depression. Thus, in terms of mental health consequences, there is a distinction between those in debt and not in debt.
An impact of social class (NS-SEC) on depression in this employed sample only emerges by comparing the top (managerial positions) and bottom (semi-routine and routine occupations) categories of the fivefold NS-SEC. This disparity reinforces the wider view that insecurity, irrespective of cause, and the associated risks of depression represent a substantial and inequitably distributed public health problem (LaMontagne et al. Reference LaMontagne, Keegel, Vallance, Ostry and Wolfe2008).
Job insecurity, being in debt and working at the bottom of the occupation hierarchy are all independently associated with depression. Apart from treating the depression, changing the employment milieu that generates the feelings of job insecurity may help. When the current economic situation of an organization is perceived as poor, job insecurity is high (Mauno & Kinnunen, Reference Mauno and Kinnunen2002). Future reorganization plans contribute to the rise in job insecurity (Ashford et al. Reference Ashford, Lee and Bobko1989) as do non-permanent job contracts (Mauno & Kinnunen, Reference Mauno and Kinnunen2002). Major organizational changes may be necessary but they should be linked with statements about job security. The distress of not knowing what is going to happen to one's job may be more a cause of depression than coming to terms with actual redundancy (Ferrie et al. Reference Ferrie, Shipley, Marmot, Stansfeld and Davey Smith1998).
Conclusion
Unsurprisingly, job insecurity has a strong association with feelings of depression. However, this relationship still exists after controlling for biographic characteristics (age and sex), economic factors (personal debt) and work characteristics (type of work and level of responsibility). Despite the organizational changes needed to cope with a recession, employers should also take note of the additional distress experienced by workers at a time of great uncertainty, particularly those in less skilled jobs and in financial straits.
Declaration of interest
None.