Introduction
The economic value of a pork carcase is determined by the market value of each of its primal cuts. One important part of the pork carcase is the belly, which is used for manufacturing bacon rashers in a number of markets. In addition, the belly can be sold in strips for use in stir-fry type meals or be used for barbecuing. Independent of how the belly is used in each specific market, a low fat content and a good meaty streak are desirable.
Genetic improvement for reduced fatness level of the carcase has been very successful due to the high genetic variability in this trait. Selection of pigs has mainly focussed on subcutaneous backfat depth. While this selection strategy has reduced overall fatness of the carcase, the size of fat depots relative to each other may have been altered. For example, Kouba et al. (Reference Kouba, Bonneau and Noblet1999) found that genetically lean pigs had a higher proportion of intermuscular fat in comparison to genetically fat pigs. It follows that considering specific carcase measurements, like fat percentage of the belly, may facilitate improved selection for carcase composition of individual primal cuts. This requires knowledge of genetic parameters for traits describing carcase composition more closely. It was the aim of this study to estimate genetic parameters for characteristics describing belly composition and to analyse genetic relationships between belly characteristics and performance, ultrasound and meat quality traits.
Material and methods
Belly traits
Data on belly traits were available for 2403 pigs recorded between August 2001 and April 2003 at QAF Meat Industries. Pigs came from three purebred terminal sire lines with 1108 (line A), 492 (line B) and 803 (line C) belly records in individual lines. The majority of animals were entire males (2026 pigs). Twenty-four hours after slaughter, bellies were separated from the loin between the dorsal end of the m. serratus ventralis to the middle of the m. latissimus dorsi. Bellies were then placed on a rig consisting of a plane elevated 30° to the horizontal to obtain an image of the anterior surface. Belly traits were derived from analysis of images of the anterior side of the belly. Images were recorded using a digital camera with quality settings of 1800 × 1600 pixels. The prediction equation used to calculate fat percentage of the belly (FATPC) included the combined area of the rib bones and rib muscles (RBMA), the intermuscular fat area (IMFA) and the subcutaneous fat area (SFA) as well as the carcase backfat depth at the P2 site (P2). Image analysis was performed using the program ImageProPlus™ v. 4.1. The equation developed by Shaw and Rosetto (Reference Shaw and Rosetto2003) was used to predict the fat percentage of the belly from digital image data of the belly and the P2 carcase backfat:

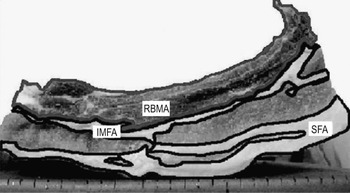
The m. cutaneous trunci was not included in the subcutaneous fat area. The intermuscular fat area was measured between the rib muscles and the m. pectoralis profundi and m. latissimus dorsi. For an illustration of these muscles, see porcine mycology (http://porcine.unl.edu; section NN). In addition, an example image outlining the area measurements used for digital analysis is shown in Figure 1. The study by Shaw and Rosetto (Reference Shaw and Rosetto2003) was conducted at QAF Meat Industries using crossbred female and male slaughter pigs.
Definition of area measurements on anterior side of the belly used to predict fat percentage of the belly (modified from Shaw and Rosetto, Reference Shaw and Rosetto2003). RBMA: area of rib bone and muscle; IMFA: intermuscular fat area; SFA: subcutaneous fat area.

Performance, carcase and meat quality traits
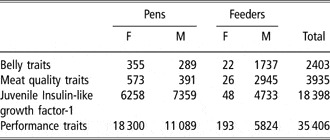
Data on growth, ultrasound and meat quality traits recorded from January 2001 until July 2003 were available for pigs with belly traits as well as their contemporaries. The number of pigs recorded for each trait group is shown in Table 1 for different performance test environments. Performance traits were available for 12 116 (line A), 13 454 (line B) and 9836 (line C) pigs in individual lines. The majority of pigs with belly data also had feed intake data (1311 pigs) and juvenile insulin-like growth factor-I data (IGF-I; 1862 pigs) available. Data for juvenile IGF-I were recorded shortly after weaning, between 20 and 35 days of age. Feed intake data were recorded over a seven-week test period in a group-housed environment using electronic feeders. The test was age-dependent with pigs starting at 126 (standard deviation, s.d. 3.1) days. The average live weight of pigs was 70 kg at the start of the feed intake test (range: 55 to 85 kg) and pigs finished the test at 107 (s.d.: 11.0) kg live weight. Pigs were fed semi-restrictively (90% of expected ad libitum intake) and the level of restriction was based on their live weight at the start of the test, as outlined by McSweeny (2002). The traits recorded included growth rate until test (ADG1), growth rate during test (ADG2), lifetime growth rate of pigs recorded for feed intake (ADG3F), average daily feed intake (FI) and feed conversion ratio (FCR). In addition, lifetime growth rate of conventionally penned pigs (ADG3P), backfat measured at the P2 site (LF1), between the third and fourth last ribs (LF2) and above the tail (LF3), as well as loin muscle depth recorded between the third and fourth last ribs (LMD) were available. Backfat and loin muscle depth measurements were recorded with realtime ultrasound on the live animal at the end of the test. Pigs not tested for feed intake were raised in the standard commercial pen environment at QAF Meat Industries and finished test at 93 (s.d. 12.9) kg live weight. The colour (L-value of the Minolta chromameter) and pH of m. longissimus dorsi were taken 24 h post mortem. Outliers that differed from the mean by more than four standard deviations were identified for each trait and excluded from analyses, affecting 0.2% to 3.8% of records for individual traits.
Number of female (F) and male (M) pigs recorded for each trait group in both performance test environments (Pens/Feeders)

Pedigree
The pedigree included 5014 pigs from four generations and 1832 parents had performance records themselves. Pigs with performance records were from 512 sires, 3244 dams and 6544 litters. The subset of animals that had belly data recorded came from 198 sires and 1076 dams.
Model
The following mixed linear animal model was used for the analyses of q traits with a single record per trait.

where y represents the vector of observations, b is the vector of fixed effects, a is the vector of random additive genetic effects of animals, c is the vector of common litter effects and e is the vector of residual effects. The terms X, Z and W are incidence matrices relating records to fixed, animal and common litter effects, respectively. All vectors are ordered according to traits within animals. The (co)variance structure of random effects can be described as V(a) = G = A⊗G0, where G0 is the q by q matrix of genetic covariances between traits and A is the numerator relationship matrix among animals, V(c) = C = I⊗C0, where C0 is the q by q matrix of common litter effects covariances between traits and I is the identity matrix, V(e) = R = Σ+Ri where Ri is the residual covariance matrix among traits recorded for animal i. If the ith animal has all q traits recorded, Ri equals R0, the q × q residual covariance among traits otherwise R0 is obtained by deleting rows and columns pertaining to traits not recorded on the ith animal. The symbols ‘Σ+’ and ‘⊗‘ denote the direct sum of matrices and the Kronecker product. All remaining covariances were assumed to be zero.
The Statistical Analysis Systems Institute (SAS) procedure GLM (SAS, 1999) was used to derive the fixed effect model for each trait. Genetic parameters were estimated in univariate and bivariate analyses using ASReml (Gilmour et al., 1999). It was not possible to obtain genetic parameters for belly characteristics in one multivariate analysis, since the number of traits exceeded the number of recorded traits. A number of multivariate analyses were performed involving either growth rate or backfat as an additional trait to investigate a possible effect of selection on genetic parameters. Estimates from these multitrait analyses corresponded well to genetic parameters presented. The fixed effects for belly traits included date of slaughter, line (RBMA, IMFA and P2 only), sex, along with the linear covariates of age of the animal at slaughter (FATPC, SFA and P2 only) and live weight. Live weight was also fitted as a quadratic covariable for the combined area of the rib bone and muscles.
The contemporary group fitted for juvenile IGF-I consisted of the assay batch within date of bleeding. In addition, sex of the animal, line and parity of the sow were further fixed effects fitted together with the linear covariable of age at bleeding. The contemporary group for performance traits recorded on the live animal was based on the week of recording, the testing system (conventional pens with ad libitum feeding v. electronic feeders with semi-restricted feeding) and the sex of the animal (entire males v. females). Further fixed effects were line (except LF3) and parity of the sow (except FI and FCR). The weight of the animal at the end of the test was fitted as a linear covariable for backfat measurements and as a linear and quadratic covariable for loin muscle depth.
Day of slaughter, line, parity of the sow and live weight at end of test (linear covariable) were significant effects for colour and pH recorded 24 h after slaughter. Testing system was fitted as a further fixed effect for colour.
Results
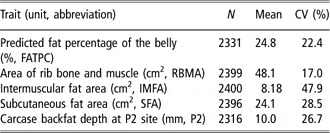
The average predicted fat percentage of the belly was 24.8% (Table 2) with a standard deviation of 5.55%. The coefficients of variation (CV) ranged from 22 to 28% for the fat percentage of the belly and the two fat subcutaneous fat measures (SFA, P2). The bone and rib muscle area had a lower CV (17%). In contrast, the intermuscular fat area was highly variable (CV: 48%). The fixed effect model explained 40 to 52% of the observed variation in belly traits.
Number of records (N), means and coefficients of variation (CV) for belly traits and carcase backfat

Heritability estimates
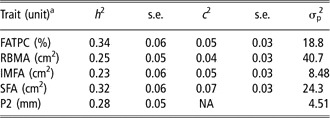
Heritability estimates (h 2) for belly traits varied from 0.23 for intermuscular fat area to 0.34 for predicted fat percentage of the belly (Table 3). Estimates of common litter effects (c 2) were low for belly traits, ranging from 0.04 to 0.07. Common litter effect was not fitted in bi-variate analyses involving carcase backfat recorded at the P2 site, since the estimate was low 0.03 (±0.03) and some correlations between litter effects were larger than one. However, omitting litter effect did not affect genetic parameters for this trait significantly.
Heritability (h 2) and common litter effect (c 2) estimates with standard errors (s.e.) and phenotypic variance (σp2) for belly traits and carcase backfat

aFor trait abbreviations see Table 2.
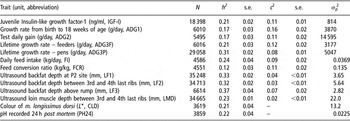
Juvenile IGF-I had heritability and common litter effect estimates of 0.21 and 0.11 (Table 4). Heritability estimates for growth rate traits recorded in pigs tested with electronic feeders (range: 0.17 to 0.21) were lower than lifetime growth rate of pigs housed in conventional pens (0.31). Moderate heritability estimate for daily feed intake (0.24) suggests that not all pigs were restricted in their feed intake capacity. The heritability for feed conversion ratio was low (0.12) with a common litter effect of 0.11.
Number of records (N), heritability (h 2) and common litter effect (c 2) estimates with standard errors (s.e.) and phenotypic variance (σp2) for performance, ultrasound and meat quality traits

Ultrasound backfat and loin muscle depth measurements had moderate heritability estimates and low estimates of common litter effect. Both meat quality measurements had moderate estimates of heritability of 0.21 for colour and 0.22 for pH recorded 24 h after slaughter, which had a very low variance, thus limiting genetic progress possible in this trait. Heritability estimates were consistent across univariate and bivariate analyses.
Genetic correlations
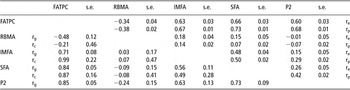
All three individual fat measurements that were part of the prediction equation of fat percentage of the belly had genetic correlations with the predicted fat percentage of the belly (range: 0.71 to 0.85; Table 5) that differed from unity given their standard errors (range: 0.05 to 0.08). The genetic association between predicted fat percentage of the belly and the combined area of rib bone and rib muscles was of a lower magnitude (genetic correlation, rg: −0.48). Combined area of rib bone and rib muscles had no significant genetic correlations with the two individual fat measurements recorded on the belly or carcase P2 backfat. These individual fat measurements were genetically different traits (range: 0.56 to 0.73) given their standard errors (±0.09 to 0.13).
Genetic (rg) and common litter effect correlations (rc; both below diagonal) along with environmental (re) and phenotypic correlations (rp; both above diagonal) between belly traitsFootnote a

a For trait abbreviations see Table 2.
The multivariate regression coefficients of the four independent belly characteristics and observed variation in each trait were used to derive expected correlations between fat percentage of the belly and each individual belly characteristic. The phenotypic correlation between fat percentage of the belly and combined area of rib bone and rib muscles was similar to the expected correlation. However, phenotypic correlations between fat percentage of the belly and each independent fat measure were higher than the corresponding expected correlation. The two individual fat measurements of the belly and carcase P2 were positively correlated, which reduced multivariate regression coefficients for these variables in comparison to bivariate analyses.
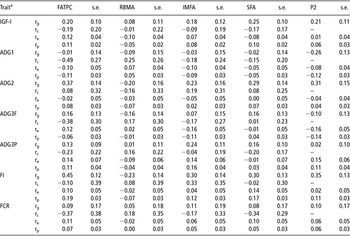
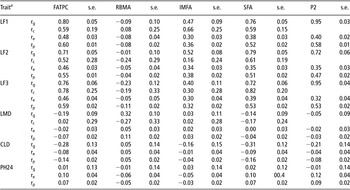
A higher fat percentage of the belly was genetically related to higher juvenile IGF-I concentration (rg: 0.20), higher growth rate during test (rg: 0.37) and higher feed intake (rg: 0.45) but had no significant genetic associations with growth rate before test, lifetime growth rate and feed conversion ratio (Table 6). Bone and muscle area had no significant genetic correlations with these performance traits and had only a significant genetic correlation of 0.32 (±0.10) with ultrasonic loin muscle depth (Table 7). Genetic correlations between belly and carcase fat measurements (IMFA, SFA and P2) and performance traits were generally positive, ranging from 0.07 to 0.35. Carcase backfat had negative genetic correlations with growth rate until 18 weeks (−0.26 ± 0.13) and lifetime growth rate of pigs tested in electronic feeders (−0.10 ± 0.13).

All three ultrasound backfat measurements recorded on the live animal were genetically different traits to fat percentage of the belly (range: 0.71 to 0.80; Table 7) given their standard errors (±0.05 to 0.06). Loin muscle depth had a low negative genetic correlation with fat percentage of the belly (rg: −0.19 ± 0.09) and no significant genetic relationship with other belly fat measurements or carcase P2 backfat.

Genetic correlations between intermuscular fat area and ultrasound backfat measurements ranged from 0.40 to 0.52. In comparison, subcutaneous fat measurements taken on the carcase (SFA and P2) had larger genetic correlations with backfat measurements recorded with ultrasound on the live animal (range: 0.72 to 0.95).
Belly fat traits and carcase backfat at the P2 site had negative genetic correlations with meat colour (range: −0.31 to −0.16). In contrast, genetic relationships between these traits and pH recorded 24 h after slaughter were not significant.
Discussion
Heritability and litter effect estimates
Only a limited number of studies were found presenting genetic parameters for belly traits. Heritability estimates for belly traits obtained in this study were not significantly different from the estimates of 0.27 and 0.31 for lean meat content of the belly, recorded in two independent populations of fattening pigs (Tholen et al., Reference Tholen, Brandt, Henne, Stork and Schellander2001). However, in the study by Tholen et al. (Reference Tholen, Brandt, Henne, Stork and Schellander2001) heritability estimates differed substantially between station-tested Pietrain pigs and maternal lines. Estimates of heritabilities for lean meat content of the belly were 0.10 for Pietrain compared to 0.40 for the maternal line, based on the model that included the Malignent Hyperthermic Syndrome genotype as a fixed effect. It was observed in the current study that it was more difficult to take quality images of bellies from lean carcases. Lean bellies had a softer anterior surface, which distorted area measurements and may have contributed to measurement errors. The intermuscular fat area was most affected by this distortion. Therefore, pictures were only taken from well-chilled carcases, which reduced distortion somewhat.
Most belly measurements analysed in this study described the fat rather than lean content of the belly. Only the combined area of rib bone and rib muscles included specific information about the lean meat content of the belly. However, area measurements of the main muscles of the belly (m. pectoralis profundi and m. latissimus dorsi) may be better predictors of the lean meat content of the belly and may have higher heritabilities than the belly traits analysed in this study. For example, Baulain and Henne (Reference Baulain and Henne1999) found larger differences between sires for lean meat content of the belly in comparison to differences for backfat depth. In addition, heritability estimates were larger in boneless primal cuts in comparison to the carcase cuts, which had not been deboned in the studies by Hermesch et al. (Reference Hermesch, Luxford and Graser2000) and Newcom et al. (Reference Newcom, Baas, Mabry and Goodwin2002).
The heritability of 0.21 for juvenile IGF-I with a common litter effect of 0.11 is in agreement with previous estimates from Australian populations, as summarised by Bunter et al. (Reference Bunter, Hermesch, Luxford, Graser and Crump2005). Heritabilities for growth rate during test, feed intake and feed conversion ratio were slightly higher in this study in comparison to previous studies that were also based on data recorded under restricted feeding (see Hermesch, Reference Hermesch2004 for a review). Higher heritability estimates for real-time ultrasound backfat measurements in comparison to carcase backfat agree with results by Hermesch et al. (Reference Hermesch, Luxford and Graser2000).
Estimates of litter effects for belly characteristics ranged from 0.04 to 0.07. Although the magnitude of estimates was similar to other ultrasound measurements, litter effects for belly characteristics were not significantly different from zero since fewer records were available. Litter effects were included in the analysis of belly traits to avoid an overestimation of the additive genetic variance. Further analyses showed that estimates of genetic correlations did not differ significantly between models including and omitting litter effects for belly traits.
Genetic correlations
The magnitude of genetic correlations between intermuscular fat area and subcutaneous fat measurements recorded both on the carcase and on live pig support the concept that intermuscular fat area is genetically a different trait than subcutaneous fat, as previously suggested by Kouba et al. (Reference Kouba, Bonneau and Noblet1999). Subcutaneous fat accounted for 60% to 70% of body fat while intermuscular fat accounted for 20% to 35% of body fat. Genetically lean pigs had a higher proportion of intermuscular fat in total fat than genetically fat lines of pigs. This is the result of the selection of pigs against subcutaneous fat only and selection for leanness has been less successful for reducing intermuscular fat (Kouba et al., Reference Kouba, Bonneau and Noblet1999). These results were confirmed by Kolstad (Reference Kolstad2001) who used computer tomography to study different fat depots in three pig genotypes over the growth trajectory from 10 to 105 kg live weight. Selection for reduced subcutaneous fat depth at slaughter seemed to have changed the shape of the growth curve of fat depots. At weaning, modern leaner breeds did not differ in total fat content from fatter unimproved genotypes. However, differences in fat content were highly significant at 105 kg live weight, with differences being largest for the subcutaneous fat content, which has been the focus of selection emphasis.
Genetic correlations between fat percentage of the belly and other fat measurements ranged from 0.71 to 0.85 in this study. Genetic parameters for these traits could not be found in the literature. In comparison, genetic correlations between lean meat content of the belly and the weight of other carcase cuts varied from 0.84 to 0.99 in the study by Tholen et al. (Reference Tholen, Brandt, Henne, Stork and Schellander2001) with the majority of estimates being above 0.95.
A higher fat percentage of the belly was genetically associated with higher feed intake and higher growth rate. Positive genetic correlations between backfat and feed intake are well established for ad libitum and semi ad libitum feeding regimes (i.e. Clutter and Brascamp, Reference Clutter and Brascamp1998; Hermesch, Reference Hermesch2004). Under restricted feeding, genetic correlations between backfat and daily feed intake are generally lower, and negative between backfat and growth rate compared to estimates under ad libitum feeding. The positive genetic correlations between these traits in the current study indicate that the level of restriction was not severe enough to change genetic correlations markedly. In comparison, genetic correlations between lean meat percentage of the belly and days until slaughter or growth rate varied substantially from −0.62 to 0.30 between populations in the study by Tholen et al. (Reference Tholen, Brandt, Henne, Stork and Schellander2001). However, the reported range for standard errors of estimates in their study was large (range: 0.02 to 0.90) and standard errors were not presented for individual genetic correlations.
Belly traits describing fat levels had low positive genetic correlations with juvenile IGF-I. This would be expected because downward selection for juvenile IGF-I as described by Bunter et al. (Reference Bunter, Hermesch, Luxford, Graser and Crump2005) will lead to a reduction in fat content of the carcase.
Measuring fat percentage of the belly
Overall, genetic relationships between belly traits and other carcase measurements showed that genetic improvement of certain fat and muscle characteristics requires specific measurements of these traits rather than composite measurements. Genetic improvement of any trait is enhanced if it is possible to measure the trait of interest on a large number of animals, preferably on live animals before selection. The method presented predicted the fat percentage of the belly from video image analyses of a cut surface of the anterior end of the belly, taken in a commercial abattoir. The methodology is similar to the procedure described by Sönnichsen et al. (Reference Sönnichsen, Dobrowolski, Höreth and Branscheid2002) who stated that the performance of video image analysis was maintained under practical slaughter house conditions. However, this measurement technique requires the cut anterior end of the belly to be visible. A comparison of methods to predict composition of pig bellies showed that lean meat content of the belly was underestimated by 6.9% to 9.5% using digital imaging technology and by 3.5% to 4.7% for the AutoFOM system (Tholen et al., Reference Tholen, Baulain, Henning and Schellander2003). The larger bias of the digital imaging approach was due to the specific position (13/14th rib) and definition (8-cm-wide belly cross-section) of the digital image of the belly according to the authors. In contrast, coefficients of determinations were higher for digital imaging (0.54 to 0.69) in comparison to AutoFOM (0.42 to 0.47). The coefficient of determination was 0.76 for the prediction equation developed by Shaw and Rosetto (Reference Shaw and Rosetto2003), which was not validated in the current study.
Tholen et al. (Reference Tholen, Brandt, Henne, Stork and Schellander2001) showed that carcase measurements, taken with the fully automated classification system AutoFOM were heritable and recommended using these characteristics for the selection. This measurement technique has the distinct advantage that it is non-invasive, and can be fully automated. Seifert et al. (Reference Seifert, Zimmermann, Seifert and Kumpfert2002) showed that ultrasonic measurements taken on the carcase were capable of determining belly composition and indicated that ultrasound measurements might also be useful to estimate belly composition on live animals.
Conclusions
Predicted fat percentage of the belly and individual belly traits used in the prediction equation were moderately heritable and had coefficients of variation similar to other carcase traits. Therefore, these traits can be improved through selection. Intermuscular fat area was genetically a different trait than subcutaneous fat measurements. In addition, the combined area of bone and rib muscles had no genetic relationship with fat measurements, juvenile IGF-I and other performance traits. Only loin muscle depth recorded on the live animal had a moderate positive genetic correlation with the combined area of bone and rib muscles. Selection for loin muscle depth will therefore aid selection for increased lean meat content of the belly. However, genetic improvement of individual fat and muscle characteristics requires specific measurements. Belly traits were derived from image analysis of the anterior side of the belly, which is a trait not routinely available on the slaughter line. Practical breeding programs require measurements that can be routinely recorded on the slaughter line or, even better, on the live animal using ultrasound technology.
Acknowledgement
This study was funded by Australian Pork Limited under project 1637. The technical assistance of John O’Shea, Helen Grigg and Tania Shaw at QAF Meat Industries is gratefully acknowledged. I also wish to thank Kim Bunter for constructive suggestions on the manuscript.