Implications
Selection for muscling in the beef industry is desirable to increase beef yield from a carcass. This study has shown that selection for muscling has altered the rate of adipose catabolism when the animal is exposed to adrenaline or stress, which may partially explain why more muscular animals are leaner. Selection for greater muscling has also reduced the stress responsiveness of the muscle, improving the storage of glycogen. Selection for muscling could therefore decrease pre-slaughter glycogenolysis, increase glycogen content at slaughter and reduce the incidence of dark, firm and dry meat, which costs the global beef industry billions of dollars per annum.
Introduction
Improvement in retail beef yield increases the efficiency and profitability of the beef industry. Producers in Australia have been successfully using a range of selection methods to improve retail beef yield, including BREEDPLAN estimated breeding values for eye muscle area and meat yield percentage, gene markers for the non-functional myostatin gene (O'Rourke et al., Reference O'Rourke, Dennis, Healy, McKiernan, Greenwood, Cafe, Perry, Walker, Marsh, Parnell and Arthur2009) and visual muscling selection techniques. There is good evidence that these selection techniques have increased muscling, reduced fat proportions in the carcass (Perry et al., Reference Perry, Yeates and McKiernan1993b; O'Rourke et al., Reference O'Rourke, Dennis, Healy, McKiernan, Greenwood, Cafe, Perry, Walker, Marsh, Parnell and Arthur2009) and reduced slow-oxidative muscle characteristics (Sudre et al., Reference Sudre, Cassar-Malek, Listrat, Ueda, Leroux, Jurie, Auffray, Renand, Martin and Hocquette2005), however there has been minimal research to show the impact of this selection on carbohydrate metabolism in the muscle and lipid metabolism in adipose tissue.
Muscle fibre type proportions heavily influence muscle metabolism. Selection for muscling increases the amount of muscle hypertrophy and the proportion of fast-glycolytic type IIX myofibres, while inversely reducing the proportion of type I slow-oxidative myofibres (Wegner et al., Reference Wegner, Albrecht, Fiedler, Teuscher, Papstein and Ender2000). This shift in muscle fibre type proportion changes the metabolic capacity of the muscle to become more glycolytic and/or less oxidative (Fiems et al., Reference Fiems, Van Hoof, Uytterhaegen, Boucque and Demeyer1995). This was further illustrated in work by Bernard et al. (Reference Bernard, Cassar-Malek, Renand and Hocquette2009) which showed that two-thirds of the genes involved in glycolysis were upregulated in Charolais bulls selected for high muscle growth potential. The enzymatic capacity of muscle fibres is also different, with type IIX myofibres having higher glycogen phosphorylase activity and lower glycogen synthase and hexokinase activity (Briand et al., Reference Briand, Talmant, Briand, Monin and Durand1981; Saltin and Gollnick, Reference Saltin and Gollnick1983; Greenwood et al., Reference Greenwood, Gardner and Hegarty2006a). Thus, cattle selected for muscling have increased glycolytic and glycogenolytic capacity (Fiems et al., Reference Fiems, Van Hoof, Uytterhaegen, Boucque and Demeyer1995; Wegner et al., Reference Wegner, Albrecht, Fiedler, Teuscher, Papstein and Ender2000), increasing the potential for stress (adrenaline)-induced glycogen depletion, coupled with lower capacity for glycogen re-synthesis (Gardner et al., Reference Gardner, Kennedy, Milton and Pethick1999). Ultimately, this could lead to reduced muscle glycogen storage as previously shown in double muscled cattle (Monin, Reference Monin1981a and Reference Monin1981b). This may be cause for concern given that muscle glycogen levels below 0.6 mg/g at slaughter (Ferguson et al., Reference Ferguson, Bruce, Thompson, Egan, Perry and Shorthose2001) will result in a high ultimate pH (>5.7), and dark, firm and dry meat. Thus, selection for muscling is likely to increase the adrenaline responsiveness of the muscle tissue, leading to reduced muscle glycogen at slaughter and an increased incidence of dark, firm and dry meat.
At present, the mechanisms that control adipose deposition in high-muscled beef cattle are poorly understood. A better understanding of these mechanisms is needed to ensure that meat quality, namely tenderness, juiciness and flavour are not deteriorated due to selection for greater muscling as observed in the pork industry over recent decades (Wood and Warris, Reference Wood and Warris1992). Selection for more muscular cattle decreases subcutaneous fat deposition (Perry et al., Reference Perry, Yeates and McKiernan1993b), which is possibly caused by a difference in the rate or quantity of adipose catabolism due to the stress hormone adrenaline. Work in obese humans has demonstrated a reduced response to adrenaline in adipose tissue (Jocken and Blaak, Reference Jocken and Blaak2008), which reduces lipolysis and potentiates obesity. The reverse effect may apply in more muscular, lean animals. An alternative theory is that more muscular cattle may also be leaner due to higher circulating growth hormone (GH) concentrations. Sejrsen et al. (Reference Sejrsen, Huber and Tucker1983) and Johnsson and Hart (Reference Johnsson and Hart1985) demonstrated that a decrease in serum GH was associated with increased body fat in grain-fed heifers, while protein accretion was higher in animals with increased concentrations of GH (Eisemann et al., Reference Eisemann, Hammond, Bauman, Reynolds, McCutcheon, Tyrrell and Haaland1986). GH treatment also causes an increased lipolytic response to adrenaline in growing pigs and lactating cattle (McCutcheon and Bauman, Reference McCutcheon and Bauman1986; Novakofski et al., Reference Novakofski, Brenner, Easter, McLaren, Jones, Ingle and Bechtel1988; Sechen et al., Reference Sechen, Dunshea and Bauman1990). Pethick and Dunshae (Reference Pethick and Dunshae1996) suggest that increased sensitivity or responsiveness to endogenous adrenaline during GH treatment is the likely cause of the elevated plasma non-esterified fatty acid (NEFA) response. Thus, leaner cattle may be more adrenaline responsive in contrast to obese humans and/or more muscular, leaner cattle may have higher circulating GH levels, subsequently increasing the adipose tissue responsiveness to endogenous adrenaline, causing greater turnover of adipose tissue.
The synthesis or mobilisation of glucose through hepatic glycogenolysis and gluconeogenesis and renal gluconeogenesis is an important component of the response to adrenaline, but we are aware of no evidence to suggest that selection for muscling or leanness will have any effect on these key metabolic pathways in ruminants. However, owing to the importance of gluconeogenesis for ruminants, the effect of selection for muscling on liver responsiveness to adrenaline is of interest.
This study evaluated the effect of selection for muscling within Angus cattle on the responsiveness of the muscle, adipose tissue and liver to exogenous adrenaline by measuring the changes in the concentration of lactate, NEFA and glucose. We hypothesise that selection for muscling will increase the response of muscle and adipose tissue to adrenaline, which will decrease muscle glycogen storage and adiposity. In addition, we hypothesise that selection for greater muscling will not alter the response of the liver to adrenaline.
Material and methods
In this experiment, we measured the plasma concentrations of glucose, lactate and NEFA in response to varying levels of adrenaline challenge in 24 Angus steers of known muscle genotype. Muscle samples were taken from the semimembranosus (SM), semitendinosus (ST) and longissimus thoracis et lumborum (LTL) to analyse muscle glycogen and lactate concentration. Sixteen basal plasma samples were also analysed for GH concentration.
Animals
Data were collected on 24 Angus steers which were selected from the New South Wales Department of Primary Industries Angus herd which had been diverged for high and low muscling since 1990 (McKiernan, Reference McKiernan2001). They were diverged using a subjective live animal muscle score based on the thickness and convexity of the body relative to the skeletal size of the animal, adjusted for subcutaneous fat (Elliot et al., Reference Elliot, Gahan and Sundstrom1987; McKiernan, Reference McKiernan1990). A 15-point scale was used, from A+ to E−, where A score animals are heavily muscled European type breeds and E score cattle are poorly muscled or dairy type. For ease of statistical analysis, these scores equate to a score of 15 to 1. From this herd, 10 low-muscled homozygous wild-type (Low), 11 high-muscled homozygous wild-type (High) and three high-muscled steers that were heterozygous for the 821 del11 myostatin mutation (HighHet) were selected. They were the progeny of four sires, each sire having multiple progeny within the same muscling genotype, and one sire having progeny in the High and HighHet muscling genotypes. These 24 steers were assessed for visual muscle score by the same assessor at weaning (∼8 months of age), ∼18 months of age and before slaughter at ∼2 years of age. The average muscle scores of the High and HighHet muscling genotypes were 10.06 and 10.33, which equates to a B−, while the Low genotype had an average score of 4.52 or a D on a 15-point scale of E− to A+. Perry et al. (Reference Perry, McKiernan and Yeates1993a) showed that the correlation between assessors and linear muscle measurements of the same animal over time ranged from 0.9 to 0.92.
During the experiment, the steers were fed an ad libitum quantity of a grain-based, commercially available cattle maintenance pellet (Milne Feeds, EasyBeef Pellet, Perth, Western Australia) and supplemented with low-quality oaten hay as roughage. The pelleted ration contained 9 MJ/kg dry matter of metabolisable energy and 106 g/kg (10.6%) crude protein on a dry matter basis.
Experiments were approved and monitored by the animal ethics committee at Murdoch University (Perth, Australia) with Permit number: R2053/07.
Muscle glycogen sampling and analysis
Muscle glycogen and lactate concentration were analysed from muscle biopsies taken from the SM, ST and LTL, after 14, 90 and 150 days, on the ad libitum grain-based pelleted ration and at slaughter for a total of four samples from each muscle site. The first sample (day 14) was taken when the steers were around 18 months of age. As previously established (Totland and Kryvi, Reference Totland and Kryvi1991; Pethick et al., Reference Pethick, Rowe and Tudor1995), the ST, SM and LTL are well suited for the study of glycogen metabolism as the ST consists predominantly of type IIX myofibres with high glycolytic potential and low rates of glycogen resynthesis, while the SM and LTL have a high proportion of type I and IIa myofibres and low susceptibility to stress-induced glycogen depletion (Monin, Reference Monin1981b).
The muscle samples were taken with a purpose-built, 12 V motorised biopsy drill (Murdoch University, Western Australia) and a restraining crush with head bail. Hair was clipped from a 10 by 10 cm area around the point of incision. The position of the LTL sample was 10 cm from the spine between the 12th and 13th ribs and the SM and ST samples were taken from a site located between 20 and 25 cm below the anus, where the SM and ST muscles border each other, so that both muscles can be accessed through the same incision. Clipping was followed by sterilisation using Betadine surgical scrub and wiping with gauze soaked in 70% ethanol solution. Local anaesthetic (5 ml lignocaine) was infiltrated under the skin and then a single 1 cm ‘stab’ incision was made through the skin. The biopsy needle (∼5 cm long with a 3 mm inner diameter), attached to the drill (∼3700 revolutions/min producing minimal noise), was then passed into the appropriate muscle with a simultaneous vacuum applied to hold the muscle sample (∼250 mg) in the needle. Following biopsy, the wound was washed with Betadine solution and Chloromide surface disinfectant applied around the incision. Muscle samples were rapidly placed into liquid nitrogen after the ‘blotting’ away of blood and removal of visible fat. Muscle samples were stored at −80°C until analysed. Muscle biopsy samples were taken from alternate sides of the animals. Glycogen concentrations in each muscle sample were measured using the enzymatic method of Chan and Exton (Reference Chan and Exton1976), modified by removing the filter paper step. Glycogen concentration represented the sum of glycogen and lactate plus free glucose and does not account for glucose-6-phosphate or glucose-1-phosphate.
Sampling and acclimation for adrenaline challenges
Following the biopsy at day 14, all 24 Angus steers were weighed and real-time ultrasound measurements (3.5 MHz/180-mm linear array animal science probe, Esoate Pie Medical, Maastricht, The Netherlands) for eye muscle area (EMA) and subcutaneous fat depth between the 12th and 13th rib, as well as subcutaneous fat depth at the P8 rump site, were taken. The animals were then acclimated to individual 3 m2 pens for 2 weeks before commencement of the adrenaline challenges. The animals need an acclimation period as this method of measuring responsiveness to adrenaline is suitable only if animals do not release endogenous adrenaline during the sampling period due to human interaction. The animals were fed once daily at 1600 h during acclimation and daily feed residuals weighed. The steers were given ∼3% of their live weight in feed initially and this amount was then adjusted during acclimation on a per animal basis. The feeding regime remained the same on sampling days, with steers having direct access to feed and water at all times.
Adrenaline challenges
On the day prior to the commencement of challenges, animals were weighed and fitted with two catheters, one in each external jugular vein. One catheter was a 14 gauge × 20 cm catheter with integrated extension tube (MILA International Inc., Cat. no. 1410, Erlanger, Kentucky, USA) and the other was fashioned from single lumen Teflon tubing with an outer diameter of 1.80 mm and an inner diameter of 1.20 mm (Jepson Bolton, England). The 14-gauge catheter was used for blood sampling and the other for infusion of the exogenous adrenaline. On sampling days, the catheters were kept patent by filling with 12.5 g/l EDTA (Product code: ED2P, Sigma-Aldrich Pty. Ltd, Castle Hill, NSW, Australia) in sterile saline between sample collections. Overnight, catheters were filled with 2.5 × 10⁴ U/l of heparinised sterile saline (Heparin Sodium, Pharmacia Australia, Bently, WA, Australia in NaCl 9 g/l, Baxter Healthcare, Old Toongabbie, NSW, Australia).
The steers were administered seven different adrenaline challenges and one glucose challenge over a 4-day period. The glucose challenge was part of a separate study and the results will be reported elsewhere.
Adrenaline causes the rapid mobilisation of energy stores. This mobilisation results in the release of glucose, lactate and NEFA from the liver, muscle and adipose tissue (Leenanuruksa and McDowell, Reference Leenanuruksa and McDowell1985). Therefore, to test the responsiveness and/or sensitivity of these tissues, plasma substrate concentrations can be measured following the administration of exogenous adrenaline. The seven challenges were assigned in a randomised design with two challenges per day (morning 1000 h or afternoon 1400 h) per steer. The rates of the adrenaline (1 mg/ml Adrenaline injection BP as 1.82 mg of adrenaline acid tartrate, AstraZeneca Pty Ltd., North Ryde, NSW, Australia, Cat. No. 03025) challenges were 0.2, 0.4, 0.6, 1.0, 1.6, 2.2 and 3.0 ug/kg live weight, which are representative of the physiological range of plasma adrenaline. Blood samples (5 ml) were taken from the catheter at −30, −15, −10, −5, 0, 2.5, 5, 10, 15, 20, 30, 45, 60, 120, 125 and 130 min relative to the administration of the challenge. Whole blood was collected using S-Monovette Vacutainer® tubes (Sarstedt Australia Pty. Ltd Cat. no. 02.1066.001, Ingle Farm, SA, Australia) containing EDTA to prevent clotting. Immediately after collection, the blood-filled tubes were stored on ice to minimise further metabolic activity of red blood cells converting glucose to lactate. Within 20 min of collection, the samples were centrifuged at 3500 r.p.m. for 15 min at 5°C and the plasma decanted into two separate labelled storage tubes. One tube was stored at −20°C for glucose and lactate analysis and the other tube was stored at −80°C for NEFA analysis.
A separate aliquot of plasma from the −30 and 0 time points from each challenge was also stored at −80°C for GH analysis. Additional blood samples were collected on each day that the biopsy samples were taken for GH analysis, with samples processed and stored in the same manner as described above.
Plasma analysis
Laboratory determination of blood plasma was carried out in duplicate using enzymatic methods for glucose (Kunst et al., Reference Kunst, Draeger and Ziegenhorn1984) and lactate (Marbach and Weil, Reference Marbach and Weil1967) automated within the Dupont Dimension® XL Clinical Chemistry system Auto-analyser (Dade Behring Diagnostics, QLD, Australia) measured at 340 nm. The NEFA concentration was measured in duplicate using a Wako NEFA C Kit (Wako Pure Chemical Ind., Osaka, Japan) modified for use as a plate assay. This kit used an enzymatic method based on the protocol of Itaya and Ui (Reference Itaya and Ui1965) and Duncombe (Reference Duncombe1964). The modification of the assay involved reduction in the volume of samples and reagents to allow for analysis using 96 flat well Microtest Plates (Sarstedt Australia Pty. Ltd, Cat. no. 82.9923.148, SA, Australia). These plates were measured using a Microplate spectrophotometer (Expert 96 Art. no. G018065 B.E.S.T. Lab Instrumentation, ASYS, Hitech GmbH, Austria).
Sixteen basal plasma samples from each of the 24 steers were also analysed for GH. These plasma samples were collected during the basal period of each challenge and at muscle biopsy sampling. Plasma concentrations of GH were assayed in a homologous double-antibody radioimmunoassay (Downing et al., Reference Downing, Joss, Connell and Scaramuzzi1995), which was adjusted by Boukhliq et al. (Reference Boukhliq, Martin, White, Blackberry and Murray1997) as follows. These plasma samples were collected during the basal period of each challenge and at muscle biopsy sampling. The standard (NIDDK-oGH-I-5) and antiserum (NIDDK-oGH-2) were provided by NIDDKD, Baltimore, MD, USA. 125I-labelled GH was prepared by the chloramine-T method. For the assay, duplicate 100 μl sub-samples of plasma or standard were incubated with 300 μl 0.05 M phosphate buffer and 50 μl antiserum (1: 30 000 in 0.05 M phosphate buffer and bovine serum albumin + 1: 600 normal rabbit serum) at 4°C overnight, and the next day 50 μl 125I-oGH (15 000 cpm) was added. Incubation was continued for 48 h, after which donkey anti-rabbit serum (100 μl diluted 1 : 10 in 0.05 M phosphate buffer) was added. After incubation overnight, the tubes were centrifuged (1500 r.p.m., 30 min, 4°C) and the supernatant was aspirated. Accuracy of the assay was checked by adding known concentrations of oGH to serum from a whether to provide concentrations ranging from 1 to 62 ng per tube. The limit of detection was 0.48 ng/ml. All samples were assayed in a single assay, and pooled plasma samples containing 1.48, 2.89 or 4.92 ng/ml were included in the assay to estimate the within-assay coefficients of variation (4.9%, 4.1% and 3.1%, respectively).
Modelling of response curves
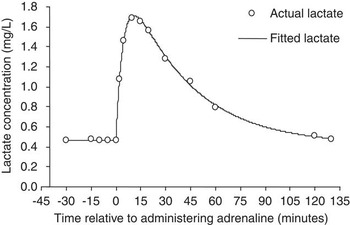
Basal concentrations of glucose, lactate and NEFA were calculated as the mean of samples collected at −30, −15, −10, −5 and 0 min relative to the adrenaline challenge. The concentrations of each substrate were then plotted against time for each challenge administered to each animal and a derived function with multiple exponential components was fitted to the raw data (Figure 1). This showed a classic increase and then tapering off in response, which was modelled using the following function:

where y(t) is plasma substrate concentration at time t; t is time (min); A is basal metabolite concentration (average of five samples taken in the 30-min period pre-challenge); β, γ, α, Δ are exponential constants; θ is the adjustment from the basal metabolite concentration; ε is error.
An example of the actual lactate concentration and fitted lactate response curve over time following administration of 3.0 μg/kg live weight of adrenaline at time 0.

The function was used to determine the time to maximum substrate concentration (results not shown), the maximum substrate concentration (results not shown) and the area under the response curve between 0 and 10 min (AUC10) for NEFA and 0 and 20 min (AUC20) for glucose and lactate, relative to administration of the adrenaline challenge. These cut-offs of 10 and 20 min for area under the response curve were chosen because they best reflected the time to maximum concentration of the three substrates studied. The magnitude of the response up to approximately the time of maximum concentration was analysed as this change in plasma concentration is the result of substrate release in response to exogenous adrenaline. Incorporating times later than when the substrate concentrations reached a maximum will also depict differences in homoeostatic regulation rather than the direct effect of adrenaline stimulation.
Statistical analysis
The results for basal substrate concentration, AUC 10 and 20 min for NEFA, glucose and lactate were analysed using a linear mixed effects model (SAS, 2001). Muscling genotype was used as a fixed effect while P8 fat depth, live weight, EMA and interactions between these terms were included as covariates in the model. For the analyses of AUC, adrenaline challenge was also included as a covariate in both linear and curvilinear forms and these terms were interacted with muscling genotype. Animal within sire was used as a random term. Basal substrate concentration prior to challenge was included in all analyses as a covariate (except where it was the dependent variable). Non-significant terms (P > 0.05) were sequentially deleted from the models.
Muscle glycogen and lactate concentrations were analysed using a linear mixed effects model (SAS, 2001), with muscling genotype, sampling time and muscle as fixed effects and animal within sire as the random term.
Plasma samples were taken at 16 time points to allow analysis of mean GH concentration. Owing to samples being collected at non-continuous time points, the volume and length of GH pulses were not assessed. Mean plasma GH concentration was analysed using a linear mixed effects model (SAS, 2001) with muscling genotype used as a fixed effect and animal within sire used as a random term.
Results
Animal phenotype measurements
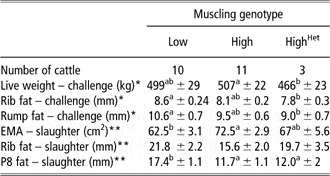
Live weights at the time of challenge were similar between the Low and High steers, but the HighHet steers were about 8% lighter (P < 0.05) than the High steers (Table 1). The High steers had about 16% larger EMA than the Low genotype steers (P < 0.05), with the HighHet steers differing from neither of these groups.
Live weights, EMA, and fat measurements at the time of adrenaline challenge and at slaughter for low, high and high heterozygote myostatin (HighHet) muscling genotype Angus steers. Values are least square means ± s.e.

EMA = eye muscle area.
a,bValues within rows with different superscripts are different (P < 0.05).
*Measurements taken prior to the administration of adrenaline challenges.
**Measurements taken on carcasses after slaughter.
Subcutaneous fat measurements at the time of challenge (Table 1) showed that the Low steers had 10.8% more rib fat (P < 0.05) and 18.6% more P8 fat (P < 0.05) than the HighHet steers (Table 1). The High genotype animals differed from neither of these groups for both subcutaneous fat measurements. Final measurements at slaughter (Table 1) showed that the low muscling genotype steers had about 45% more subcutaneous fat at the P8 site compared to both the High and HighHet steers (P < 0.01). Conversely, there was no difference in rib fat (Table 1).
Basal metabolite concentrations
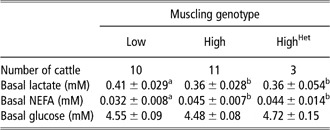
There was a significant effect of muscling genotype on basal lactate and NEFA concentration (Table 2). The High and HighHet genotypes had on average 14% less basal lactate (P < 0.1) and on average 40% more basal NEFA (P < 0.1) than the Low genotype steers. There was no significant effect of muscling genotype on basal glucose concentration (Table 2). There was no effect of live weight, EMA or P8 fatness on basal concentrations.
Least square means (±s.e.) for basal plasma lactate, NEFA and glucose concentration (mM) in Angus steers of low, high and high heterozygous myostatin (HighHet) muscling genotypes

NEFA = non-esterified fatty acids.
a,bValues within a row with a different superscript are different (P < 0.10).
Lactate response to adrenaline
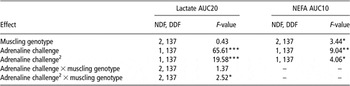
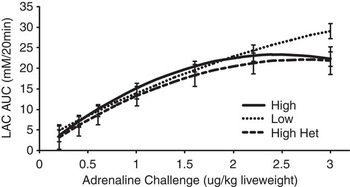
As adrenaline challenge increased, the plasma lactate AUC20 increased by more than 4-fold across the range of adrenaline challenges administered (P < 0.0001; Table 3). The High and HighHet genotypes reached a plateau in AUC20 above 2.0 μg/kg live weight adrenaline. In contrast, the Low steers lactate AUC20 increased linearly up to the highest level of adrenaline challenge (Figure 2), such that their lactate AUC20 was more than 30% higher than the High and HighHet muscling genotypes (P < 0.05; Figure 2) at the highest adrenaline dose (3 μg/kg live weight). There were no effects of basal lactate, live weight, P8 fat depth or EMA on lactate AUC20.
F-values for the effect of muscling genotype and adrenaline challenge and significant interactions on lactate area under curve for 20 min post-adrenaline challenge (AUC20) and NEFA area under curve for 10 min post-adrenaline challenge (AUC10)

NEFA = non-esterified fatty acids; NDF = Numerator degrees freedom; DDF = Denominator degrees freedom.
*P < 0.05; **P < 0.01; ***P < 0.0001.
Lactate concentration area under curve (±s.e.) between 0 and 20 min (LAC AUC20) relative to adrenaline challenge in Angus steers of low, high and high heterozygous myostatin (HighHet) muscling genotypes.

NEFA response to adrenaline
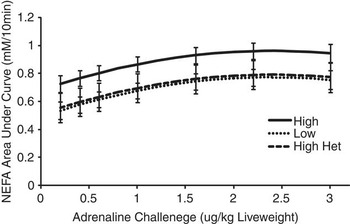
As the level of adrenaline challenge increased, the plasma NEFA AUC10 increased (Table 3), reaching a plateau at an adrenaline dose of about 2.5 μg/kg live weight (Figure 3). Across this entire range of adrenaline challenges, NEFA AUC10 was between 30% and 40% higher for the High genotype compared to both the Low and HighHet genotypes (P < 0.05; Table 3). There was also no effect of basal NEFA concentration, live weight, P8 fat or EMA on NEFA AUC10.
NEFA concentration area under curve (±s.e.) between 0 and 10 min (AUC10) relative to adrenaline challenge in Angus steers of low, high and high heterozygous myostatin (HighHet) muscling genotypes.

Glucose response to adrenaline
There was no effect of muscling genotype, live weight, P8 fat or EMA on glucose AUC20; however, the level of adrenaline challenge and basal glucose concentration did have an effect. Across the range of adrenaline challenges administered, the plasma glucose AUC20 increased by about 8-fold (P < 0.001). Basal glucose was associated with a reduction in glucose AUC20 (P < 0.05), with a 2 mM increase in basal glucose resulting in a 25% or 6.3 mM/20 min decrease in glucose AUC20.
Effect of muscling genotype on muscle glycogen and lactate
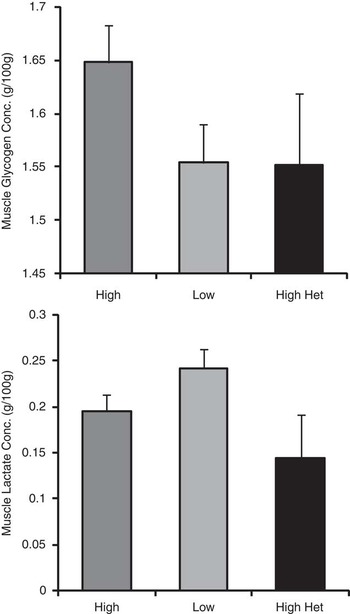
Muscling genotype had an effect on muscle glycogen concentration (P < 0.05), with the High steers having a 6.1% higher muscle glycogen content than the Low steers and the HighHet steers differing from neither group (Figure 4). The muscle lactate concentrations from the first biopsy (Figure 4), taken before the animals were habituated to humans, showed that the Low steers had around 23% more lactate in the muscle samples than the High or HighHet steers (P < 0.05).
Muscle glycogen concentration (+s.e.) from four muscle biopsies taken from the semimembranosus (SM), semitendinosus (ST) and longissimus thoracis et lumborum (LTL) and muscle lactate concentration (+s.e.) of SM, ST and LTL from muscle biopsy no. 1 in Angus steers of low, high and high heterozygous myostatin (HighHet) muscling genotypes.

Effect of muscling genotype on growth hormone
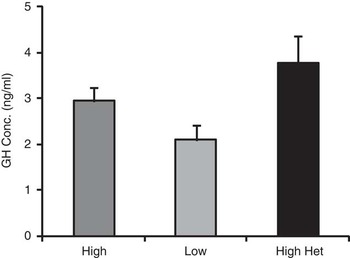
The mean GH concentration did not differ between the HighHet and High steers; however, these genotypes had 80% and 42% more GH, respectively, compared to the Low genotype steers (P < 0.05; Figure 5). There was no effect of live weight, P8 fat depth or EMA on GH concentration.
Average plasma growth hormone concentration (+s.e.) in Angus steers of low, high and high heterozygous myostatin (HighHet) muscling genotypes.

Discussion
Muscle responsiveness to adrenaline
Changes in plasma lactate concentration indicate the responsiveness of muscle tissue to adrenaline. These results showed that the High and HighHet muscling genotypes had a lower muscle response at high levels of endogenous adrenaline, which did not support our initial hypothesis. Computerised tomography scans of the hind limb of these 24 cattle (data not shown) showed that the High and HighHet steers had proportionately more muscle than the Low steers (muscle represented 65.3% and 67.7% compared to 62.4% of hind-limb weight). A calculation using live weight at challenge, dressing percentage (data not shown) and percentage muscle mass (based on hind limb) was used to determine total muscle mass at the time of challenge. Thus, lactate output in response to adrenaline could be expressed on a per kilogram muscle weight basis. At the highest adrenaline dose, the Low animals had around 47% more lactate output per kilogram of muscle weight compared to the High and HighHet cattle. Furthermore, at high levels of adrenaline challenge, the High and HighHet cattle appeared to reach a plateau in their response curves, while the Low genotype cattle were still responding in a linear fashion. This may suggest even greater muscle responses at levels of adrenaline (stress) beyond those tested within this study. These results compare closely with work in sheep (Martin et al., Reference Martin, McGilchrist, Thompson and Gardner2011) where progeny from sires selected for high muscling breeding values also demonstrated reduced muscle responsiveness to adrenaline.
The lower adrenaline responsiveness of high muscle animals could be due to a shift in proportion of muscle fibre types. Selection for muscling reduces the proportion of type I oxidative myofibres, while increasing the proportion of type IIX fast glycolytic myofibres (Wegner et al., Reference Wegner, Albrecht, Fiedler, Teuscher, Papstein and Ender2000; Greenwood et al., Reference Greenwood, Cafe, O'Rourke and McKiernan2006b). Martin et al. (Reference Martin, Murphree and Saffitz1989) showed that the muscle of rats with more oxidative myofibres (type I) had an increased density of β2-adrenoreceptors and increased glycogenolysis. Furthermore, the receptor affinity in rats was similar across all myofibre types (Jensen et al., Reference Jensen, Alvardado, Pirkusny and Geary1995), which indicates that receptor density is the primary determinant of adrenaline sensitivity. These β2-adrenoreceptor receptor density differences suggest that muscle with more oxidative myofibres would be more responsive to adrenaline, an assertion supported by Lacourt and Tarrant (Reference Lacourt and Tarrant1985) and Richter et al. (Reference Richter, Ruderman, Haralambos, Belur and Galbo1982) who showed that endogenous adrenaline induced more glycogenolysis in type I oxidative myofibres than type IIA oxido-glycolytic or IIX fast glycolytic myofibres. Thus, selection for muscling in cattle, which reduces the proportion of type I oxidative myofibres, may dilute the density of β2-adrenoreceptors, subsequently reducing the muscle response to adrenaline.
This mechanism appears to override the intrinsic enzymatic capacity of muscle with higher proportions of type IIX myofibres, which have a greater glycogenolytic capacity (Briand et al., Reference Briand, Talmant, Briand, Monin and Durand1981; Saltin and Gollnick, Reference Saltin and Gollnick1983). However, this may only occur in the absence of physical stress (i.e. muscle contraction). Contractile stress, such as that caused by mixing and fighting between animals, is associated with elevated levels of intracellular Ca2+ ions, which activate glycogen phosphorylase, thus inducing glycogenolysis. Given the greater glycogenolytic capacity of type IIX myofibres, it is likely that cattle selected for muscling and therefore having greater proportions of these myofibres will be more susceptible to contraction-induced glycogen depletion. This has been previously demonstrated in cattle and rats (Richter et al., Reference Richter, Ruderman, Haralambos, Belur and Galbo1982; Lacourt and Tarrant, Reference Lacourt and Tarrant1985).
The reduced adrenaline responsiveness of the high-muscled cattle in a more chronic scenario is likely to lead to less stimulation of the catabolic phase of glycogen turnover, resulting in greater accumulation of muscle glycogen. This was supported by the glycogen results of this study, which were higher in the high-muscled cattle. Furthermore, the high-muscled cattle also had lower concentrations of basal plasma lactate, indicative of reduced glycogen turnover in muscle. Lastly, the lower concentration of lactate within the first biopsy sample indicates less mobilisation of glycogen due to the stress of the biopsy procedure. These results all show that selection for more muscular animals will reduce muscle glycogen depletion under stress, leading to greater concentrations at slaughter and, most importantly, reduce the proportion of dark, firm and dry carcasses.
Adipose tissue responsiveness to adrenaline
The adipose tissue of high muscling steers is more responsive to adrenaline than their low muscling counterparts, shown by larger mobilisation of NEFA at all levels of adrenaline challenge, supporting our initial hypothesis. This result suggests a catabolic (lipolytic) mechanism contributing to the reduced adiposity seen in these high-muscled animals at slaughter. It aligns well with research in sheep (Martin et al., Reference Martin, McGilchrist, Thompson and Gardner2011) where the progeny of sires with high muscling breeding values also had an increase in adipose tissue response to adrenaline. Furthermore, research in double-muscled bulls showed that subcutaneous and peri-renal adipose tissue was reduced in quantity as a result of hypotrophy (reduced fat storage per fat cell) and hypoplasia (less fat cells; Hocquette et al., Reference Hocquette, Bas, Bauchart, Vermorel and Geay1999). This result may also be indicative of greater mobilisation of adipose tissue in response to stress in double-muscled bulls.
In general support of the assertion that high-muscled genotypes have greater adipose responsiveness to adrenaline, the basal NEFA concentrations of the High and HighHet steers were also elevated compared to the Low-muscled animals. However, it should be noted that the basal concentrations of NEFA were at the lower end of the normal range for plasma NEFA concentrations, indicating that the animals were habituated to humans and the sampling conditions. Thus, external/environmental stressors are unlikely to have impacted on the results of this study.
Although the physiological mechanisms contributing to these results in ruminants are unclear, Gregory et al. (Reference Gregory, Christopherson and Lister1986) showed that adipose tissue capillary blood flow declines with increasing fatness in sheep, slowing the perfusion of endogenous adrenaline. This may lead to less activation of hormone-sensitive lipase and β2-adrenoreceptors, reducing lipolysis in fatter animals. Furthermore, Jocken and Blaak (Reference Jocken and Blaak2008) found reduced hormone-sensitive lipase expression, coupled with reduced number and function of β2-adrenoreceptors in adipose tissue in obese humans (Reynisdttir et al., Reference Reynisdttir, Wahrenberg, Carlstrom, Rossner and Arner1994). The reverse may apply in high muscled, lean steers, with greater density of β2-adrenoreceptors in their adipose tissue due to hypotrophy of cells, as observed in double-muscled bulls (Hocquette et al., Reference Hocquette, Bas, Bauchart, Vermorel and Geay1999). This could create an increased responsiveness in these animals, further reducing their adipose tissue storage.
Alternatively, elevated GH concentrations were found in the plasma of the High muscling genotype steers, which may also explain their elevated NEFA response. Numerous studies have shown that animals undergoing GH treatment have higher adipose sensitivity to adrenaline, generating higher plasma NEFA and glycerol concentrations (McCutcheon and Bauman, Reference McCutcheon and Bauman1986; Novakofski et al., Reference Novakofski, Brenner, Easter, McLaren, Jones, Ingle and Bechtel1988; Sechen et al., Reference Sechen, Dunshea and Bauman1990; Pethick and Dunshae, Reference Pethick and Dunshae1996). Thus, the increased adipose tissue responsiveness of cattle selected for muscling may be associated with elevated levels of growth hormone, resulting in greater adipose turnover and the leaner phenotype evident in these animals.
Liver responsiveness to adrenaline
In support of our initial hypothesis, there was no effect of muscling genotype on the responsiveness of the liver to adrenaline challenges. These findings are in contrast to those of Martin et al. (Reference Martin, McGilchrist, Thompson and Gardner2011) where lambs from low muscling sires had higher glucose responsiveness to adrenaline challenge. This increased responsiveness in lambs from low muscling sires could be due to substrate availability and different levels of gluconeogenesis in the liver and kidney rather than liver responsiveness. Lactate is a key gluconeogenic substrate in ruminants contributing around 15% of gluconeogenic glucose (Seal and Reynolds, Reference Seal and Reynolds1993), while glycerol from the metabolism of triacylglycerols will contribute around 2% to 5% of glucose in ruminants (Drackley et al., Reference Drackley, Overton and Douglas2001). Martin et al. (Reference Martin, McGilchrist, Thompson and Gardner2011) showed that the lambs from low muscling sires had much higher lactate responsiveness to adrenaline, allowing for greater gluconeogenesis in the liver and kidney following an adrenaline challenge. Thus, in this study, there is possibly no difference in glucose response as the effect of adrenaline on lactate was more subtle, while the contribution of glucose from glycerol would be negligible, therefore allowing less scope for a substrate-driven glucose response in these animals.
The impact of basal glucose concentration on adrenaline response
Higher basal glucose levels were associated with a dampening effect on glucose responses to adrenaline challenges. This implies that the higher circulating levels of glucose had stimulated the homoeostatic counter-regulatory mechanisms of insulin to a larger degree in these animals. This may inhibit the subsequent response to the exogenous adrenaline challenge, a result that has also been shown in lambs (Martin et al., Reference Martin, McGilchrist, Thompson and Gardner2011).
Effects of myostatin polymorphism
Conclusions for the impact of the 821, del11 myostatin mutation on adrenaline sensitivity of the muscle, adipose tissue and liver are tentative because of the limited number of animals (n = 3) available in this study. However, as a general trend, the High and HighHet genotypes were relatively similar in their muscle response to adrenaline, as well as their circulating levels of basal metabolites. In addition, they did not differ in their adipose tissue response. However, the key point to note is that the presence of the myostatin mutation was not additive to the response of the High muscling genotype. This suggests that the response of the HighHet steers is not strongly associated with the 821 del11 myostatin mutation. Further work with increased numbers is required to more conclusively study differences in adrenaline responsiveness of these animals.
Conclusion
Cattle selected for high muscling have reduced responsiveness to adrenaline in muscle, leading to less glycogenolysis during stress and ultimately increasing the levels of stored muscle glycogen. Therefore, selection for muscling may decrease the incidence of dark, firm, dry beef carcasses. This response may be driven by lower β2-adrenoreceptor density in muscle cells of highly muscled cattle. Cattle selected for muscling also have greater adipose responsiveness to adrenaline. This may be associated with elevated levels of GH in these animals, and is likely to contribute to their phenotypic leanness.
Acknowledgements
The authors thank the Australian Cooperative Research Centre for Beef Genetic Technologies and Murdoch University for funding this project. They also thank Malcolm Boyce, Barbara Waldoch, Kim Thomas and the staff from the Murdoch University Veterinary School farm for their assistance with this experiment. They also thank Peter Kamphorst and the staff at Glen Innes Industry and Investment New South Wales research property for their continued cooperation as well as measurement and care of the animals before their arrival in Western Australia. Taron Brearley assisted in the development of the modelling equations and is thanked for his contribution.