Introduction
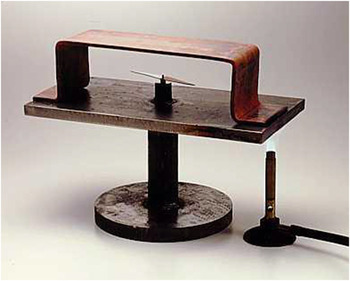
Thermoelectricity is defined by the “Seebeck effect,” after the German physicist Thomas Seebeck. In 1821, Seebeck discovered that, by using wires of different metals together and heating one end, he could induce a small electric current flow from the hot end to the cold end, demonstrating that heat could be converted to electricity. Seebeck’s ingenious experiment is illustrated in Figure 1 ; it shows a piece of metal with a magnet underneath it and a hot source. The magnet moves as the current flows. This phenomenon is the basis of thermolectrics. Reference Kanatzidis1–Reference Rowe5
Seebeck’s experiment to demonstrate thermoelectricity. The apparatus consists of a piece of metal attached to a magnet, and under the magnet is a hot source. Heating the apparatus induces current flow, which then causes the magnet to move.

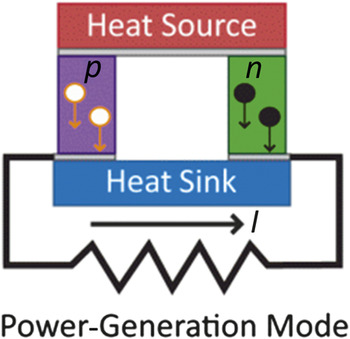
Thermoelectricity can also operate in reverse and create temperature differences using electric currents, so it can be used for solid-state refrigerators. The Seebeck effect is based on a property of a material called thermopower. This has a simple explanation: A piece of metal or semiconductor contains charge carriers, and if it is subjected to a temperature difference, the charge carriers will move to create a current from the region of higher temperature to that of lower temperature in order to lower their energy. If the temperature difference ΔT induces a voltage difference ΔV, then the thermopower is defined as ΔV/ΔT, so the higher the value of ΔV for a given ΔT, the higher the thermopower. Reference Wood4,Reference Rowe5 The best thermoelectric devices uses an n-type and p-type material placed in parallel, bounded at each end by a heat source and a heat sink, as shown in Figure 2 . The charge carriers then move from the heat source to the heat sink, creating an electric current. This process can also be driven in reverse to cool the material. The dream of the thermoelectrics research community is to harness this energy-conversion technology for widespread power generation and energy management.
The principle of thermopower. Thermoelectric devices use n-type and p-type materials placed in parallel. These materials are bounded by a heat source and a heat sink. The motion of charge carriers from the heat source to the heat sink creates an electric current. This can also be driven in reverse to cool the metal. Note: I, current.

According to US Department of Energy (DOE) figures, 6 40% of all energy production comes from petroleum, 23% from natural gas, 23% from coal, 8% from nuclear energy, and 7% from renewables (solar, biomass, geothermal, hydroelectric, and wind). However, 65% of all energy produced by these sources is in the form of waste heat. If 10% of this waste energy could be recovered and returned to the system using thermopower, this would have a marked impact on global energy usage.
Thermoelectric applications
The number of potential applications of thermoelectricity is extremely large and only limited by researchers’ imaginations. There are some obvious examples: exhaust heat from vehicles, constituting approximately three-quarters of the total fuel energy; as well as engines on ships, utilities, chemical plants, the brick industry, glass industries, industries producing a large amount of heat, and space power. The National Aeronautics and Space Administration (NASA) must be credited for selecting thermoelectrics for deep space missions early on beginning in the 1960s because of reliability. Thermoelectric devices were tested and proven successful for all thermoelectric applications at NASA. For example, the hot source for the NASA applications is PuO2 and the semiconductor material is SiGe. The Voyager spacecraft left the earth in the late 1970s. Voyager 1 has now escaped the solar system, and it is still sending signals, so the thermoelectric device on the spacecraft is still working and “the lights are still on.” NASA cannot afford to lose a costly mission due to failure of the power supply. The Curiosity Rover on Mars also uses thermoelectrics, in the form of PbTe, an older generation of this thermoelectric material.
A number of companies, both large and small, are investing in thermoelectrics. For example, General Motors has a program to develop thermoelectric generators for their own vehicles; Gentherm (formerly Amerigon) has their own design and program and is working with companies such as Ford and BMW to install thermoelectric generators in cars.
Conversion efficiency
As with any other energy-conversion system, such as solar power, every energy-conversion material and technology has a figure of merit and conversion efficiency. For thermoelectric materials, this figure is denoted by ZT, and the higher the value of ZT, the higher the conversion efficiency. ZT incorporates the properties of the material and is defined by
 $$ZT = {{\sigma {S^2}} \over {{\kappa _{total}}}}T$$
,
where σ is the electrical conductivity, S is the thermopower, κtotal is the thermal conductivity, and T is the temperature; the numerator σS 2 is referred to as the power factor. Thus, for efficient energy conversion, we require high electrical conductivity to maximize the number of electrons and low thermal conductivity to maximize the temperature difference. The aim of research in thermoelectrics is to maximize ZT, because of its role in the equation for Carnot efficiency:
 $$\eta = {{{T_h} - {T_c}} \over {{T_h}}}{{\sqrt {1 - ZT} - 1} \over {\sqrt {1 + ZT} + {T_c}/{T_h}}}$$
,
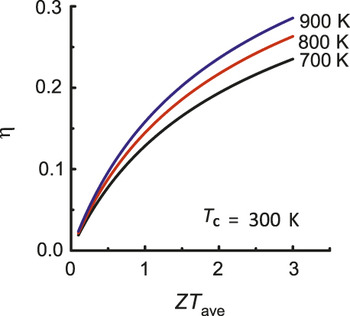
where η defines the Carnot fraction, the fraction of energy that is actually utilizable, and T h and T c are the hot and cold source temperatures, respectively. Figure 3 shows the variation of η as a function of ZT for a cold source at room temperature and varying values of T h. For example, the temperature of the hot source is 800 K and the average value of ZT is 1.5, the theoretical Carnot efficiency is about 20%. This order of thermal efficiency is an exciting prospect for the development of viable thermoelectric materials.
Carnot efficiency η as a function of figure of merit ZT. As the hot source temperature increases, the efficiency increases. Note: T c, cold source temperature; T ave, average temperature.

The influence of thermal conductivity κtotal is also important. For diamond, κtotal ≈ 1600 W/mK. Metals also have high thermal conductivity; for example, for copper κtotal ≈ 400 W/mK. Wood is a good insulator, with κtotal ≈ 0.2 W/mK, while PbTe, which is a good thermoelectric material, has κtotal ≈ 2.2 W/mK. Thus, because ZT from Equation 1 is inversely proportional to the thermal conductivity, good thermoelectric materials must have a thermal conductivity closer to that of wood than to that of diamond.
Historical perspective
While the Seebeck effect was discovered in 1821, around 1834, Peltier discovered the reverse effect, which results in cooling. Near the beginning of the 20th century, Altenkirch identified the ZT equation as the most important factor influencing efficiency. Reference Altenkirch7 Little progress was achieved in this field between 1905 and 1950; subsequently, government funding was made available, such as through the US Office for Nuclear Regulation. As a result of considerable effort in the United States, and also in Russia, researchers developed cooling devices with ZT ≈ 1 using Bi2Te3 and alloying it with other elements such as Sb, Te, and Se, in order to lower the thermal conductivity. This can be called the first paradigm of thermoelectric optimization, developed in the late 1950s.
In the 1970s, NASA capitalized on this discovery and introduced other materials such as PbTe, Reference Eogers and Ridihalgh8–Reference Rowe11 SiGe, Reference Eogers and Ridihalgh8–Reference Rowe11 and AgGeSbTe. Reference Skrabek12,Reference Decheva and Dimitrova13 At this time, government funding ceased, and there was little progress until the early 1990s, when Dresselhaus and Hicks published a very interesting paper Reference Hicks and Dresselhaus14 that discusses the effect on the nanoscale—in nanowires and thin films, for example. They predicted that the power factor would increase for nanoscale devices. This motivated a number of researchers to investigate this effect, especially using thin films and nanowires. In the 1990s, Glen Slack introduced the phonon glass electron crystal approach, Reference Nolas, Slack, Cohn, Schujman and Ieee15 using special crystals with low thermal conductivity but high mobility. He predicted that they would have high ZT. In 2000, my group and collaborators discovered that CsBi4Te6 was a very promising cooling material, Reference Chung, Hogan, Brazis, Rocci-Lane, Kannewurf, Bastea, Uher and Kanatzidis16,Reference Chung, Hogan, Rocci-Lane, Brazis, Ireland, Kannewurf, Bastea, Uher and Kanatzidis17 which was followed by the discovery of lead antimony silver tellurium (LAST) material with ZT ∼ 1.5, which we thought at the time was an upper limit. Reference Hsu, Loo, Guo, Chen, Dyck, Uher, Hogan, Polychroniadis and Kanatzidis18 The LAST material has a quaternary composition of the type AgPb m SbTe2+m and has an overall rock-salt crystal structure. It is a series of compositions in which m is a tunable parameter. We learned how to design nanostructures and obtained the ZT ∼ 2.2, and more recently, we have a new material, SnSe, which is not a nanostructure but a single phase with ZT ∼ 2.6. There are many other materials currently under consideration, including Skutterudites (ZT ∼ 1.5); Reference Shi, Yang, Salvador, Chi, Cho, Wang, Bai, Yang, Zhang and Chen19–Reference Shi, Kong, Li, Uher, Yang, Salvador, Wang, Chen and Zhang22 Mg2(Si,Sn) (ZT ∼ 1.4); Reference Zaitsev, Fedorov, Gurieva, Eremin, Konstantinov, Samunin and Vedernikov23,Reference Liu, Tan, Yin, Liu, Tang, Shi, Zhang and Uher24 Half-Heusler alloys (ZT ∼ 0.8); Reference Chen, Dresselhaus, Dresselhaus, Fleurial and Caillat25 MgAgSb (ZT ∼ 1.2). Reference Zhao, Sui, Tang, Lan, Jie, Kraemer, McEnaney, Guloy, Chen and Ren26
Optimization of ZT
The maximum value of ZT is given by
 $$Z{T_{\max }} \propto \gamma {{{T^{3/2}}t} \over {{\kappa _{latt}}}}\sqrt {{{{m_x}{m_y}} \over {{m_z}}}} {e^{(r + 1/2)}}$$
, (3)
where γ is the band degeneracy, which refers to the symmetry of the Brillouin zone and the crystal, t is the scattering time, m j is the effective mass of the electrons in the j = x,y,z orthogonal directions, r is the scattering parameter (for acoustic phonon scattering, r = ½) and κlatt is the lattice thermal conductivity. Reference Ravich, Efimova and Smirnov27 The higher the value of γ and the lower the value of κlatt, the higher is the value of ZT. Further, if the current flows in the z direction, the value of m z should be small, while the values of m x and m y should be large, implying an anisotropic structure. However, high values of γ imply an isotropic structure, which leads to a contradiction.
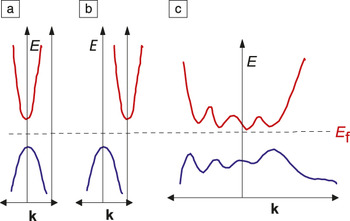
Figure 4 shows three plots of three different hypothetical electronic structures, where blue depicts the valence band and red the conduction band. If γ is high then all levels are multiplied by γ, resulting in a multiplication effect in the Seebeck coefficient and the power factor. Interestingly, if we have a complex electronic structure with multiple peaks in the valence band or multiple valleys in the conduction band and they can all be accessed by carriers, then each will contribute to ZT and the additive effect plus the multiplicative effect of γ will result in a high ZT. The advantage of the complex electronic structure is that the electrons can be split into several bands. If the electrons are all in the same band, the mobility is reduced, and the conductivity is low, resulting in a low power factor. If there is mixed conduction, with n-type and p-type materials, the electrons and holes counteract each other and the power factor remains low. We need to have only one type of carrier in as many transport “lanes” as possible, such that electrons can be distributed among these “lanes” (i.e., electronic bands) and move with high mobilities. If the number of lanes is small or a single lane exists, then the electrons cause congestion or undergo collisions (akin to a traffic jam) and mobilities decrease.
Simple versus complex electronic structure. (a) Direct bandgap where blue depicts the valence band and red depicts the conduction band (simple); (b) indirect bandgap (simple); and (c) complex structure where the conduction band has multiple valleys and the valence band has multiple peaks (complex). Note: k, wave vector; E, energy; E f, Fermi energy level.

The requirements for new candidate thermoelectric materials may thus be listed as follows: narrow-bandgap semiconductors such that we can dope the materials; heavy elements such that they have low thermal conductivity and also high mobility because of the broad conduction and valence bands; large unit cells that have low thermal conductivity by providing a more tortuous path for the phonons; an anisotropic structure or a highly symmetric structure (a consequence of Equation 3); and complex compositions with a complex electronic structure. We started to design and synthesize new materials using based on the above criteria and have subsequently discovered over 100 compounds, including lead chalcogenides, bismuth chalcogenides, alkaline chalcogenides, and silver chalcogenides. Reference Mrotzek and Kanatzidis28,Reference Kanatzidis29 Many of these are potentially interesting thermoelectrics.
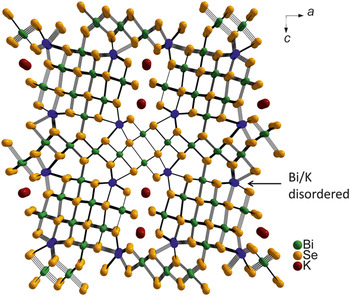
The first compound discussed is K2Bi8Se13. Reference Chung, Choi, Iordanidis, Schindler, Brazis, Kannewurf, Chen, Hu, Uher and Kanatzidis30,Reference Kanatzidis, McCarthy, Tanzer, Chen, Iordanidis, Hogan, Kannewurf, Uher and Chen31 The exact composition is rather complex and obviously difficult to predict beforehand; it must be discovered. The structure is shown in Figure 5 . It is anisotropic, and it grows perpendicular to the page with a needle or columnar structure. Reference Kanatzidis32 We were able to achieve large crystal growth (cm size), and we found that at room temperature, the thermopower is –200 µV/K, which is an impressively high value; it is negative, so it is an n-type material. At room temperature, the electrical conductivity is also high, thermal conductivity is low, and ZT is between 0.5 and 0.6, which is also quite high. These are pure crystals of single phase materials.
Structure of K2Bi8Se13.

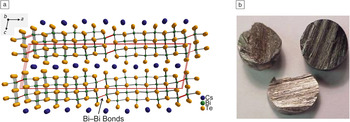
Figure 6 shows the structure of another new thermoelectric, CsBi4Te6 we discovered. Again the structure is anisotropic, with a number of layers, each of which is anisotropic in itself. We were able to optimize the material by doping, and we obtained a Seebeck coefficient of about 160 µV/K. The coefficient is positive, so it is p-type, with high electrical conductivity, of several thousand S/cm, and low thermal conductivity. Parallel to the needles, the thermal conductivity is less than 2 W/mK, which is excellent, and the perpendicular thermal conductivity is even lower. We obtained a value of ZT = 0.8 at 225 K, which is superior to our benchmark of Bi2Te3 for this temperature.
(a) Structure of CsBi4Te6. The red box represents a unit cell. (b) Crystals of CsBi4Te6 formed as ingots of 12 mm diameter. Reference Chung, Hogan, Brazis, Rocci-Lane, Kannewurf, Bastea, Uher and Kanatzidis16

Low thermal conductivity
We also found a number of more isotropically shaped crystals such as octahedral cubes (e.g., K2Pb3Bi2Te7 and KPb4SbTe6) in which the number of cations equals the number of anions. All of the materials in this category have the same diffraction pattern—that of NaCl, rock salt. K can also be substituted by Ag, and we found a family of materials AgPb m SbTe2+m , where m is a tunable parameter. We called this series LAST-m(m is a tunable parameter); Reference Bilc, Mahanti, Quarez, Hsu, Pcionek and Kanatzidis33 we then substituted Na for Ag to create the SALT-m (sodium antimony silver tellurium, NaPb m SbTe2+m ) series. Reference Poudeu, D'Angelo, Downey, Short, Hogan and Kanatzidis34 All these materials show very simple diffraction patterns, and they can be grown stoichiometrically as crystals, resulting in very high power factors, with high Seebeck coefficients and high electrical conductivity. We were surprised to find that the thermal conductivity was extremely low, less than one would expect from a solid solution, and approximately half that of PbTe. Standard theoretical calculations predicted that the thermal conductivity should be lower than that for PbTe, but not as low as we found. Because of the low thermal conductivity, we were able to achieve ZT = 1.6, much higher than the value of 1 for PbTe.
We were intrigued by the very low thermal conductivity of the LAST-m materials. Transmission electron microscopy (TEM) studies Reference Quarez, Hsu, Pcionek, Frangis, Polychroniadis and Kanatzidis35 showed that these materials are not really single phase, but they are inhomogeneous on the nanoscale. Nanocrystals of different sizes precipitate coherently in the matrix, so this is a two-phase system, but electron diffraction experiments indicate that it has the appearance of a single crystal. We call this endotaxy by analogy to epitaxy because we have near lattice matching in all three dimensions. We concluded that this is a possible reason for the low thermal conductivity; there is considerable strain in the interface, different composition, mass mismatch, and so on, which increases the phonon scattering and results in low thermal conductivity. Reference He, Girard, Kanatzidis and Dravid36,Reference He, Sootsman, Girard, Zheng, Wen, Zhu, Kanatzidis and Dravid37
In order to prove that this was the reason, rather than a coincidence, we needed one composition that existed in two forms: one that is not in a non-nanostructured form (i.e., solid solution), and one in nanostructured form. Then we needed to compare the thermal conductivities. The difficulty was that many solid solution materials naturally form nanostructures, so it is not easy to obtain a homogeneous solid-solution phase. We found such a case in the PbTe-PbS system, with 10% PbS. We heated this system and melted it, and quickly quenched it to room temperature, and this produced a frozen homogeneous metastable solid solution. Reference Girard, He, Li, Moses, Wang, Uher, Dravid and Kanatzidis38,Reference Girard, He, Zhou, Shoemaker, Jaworski, Uher, Dravid, Heremans and Kanatzidis39 Based on the phase diagram, we first annealed the quenched material and then heated it such that it precipitated throughout the volume and created a nanostructure. We then compared the nanostructured compound with the compound that was a solid solution; the nanostructured composition had a thermal conductivity that was lower by 50%, due to phonon scattering by point defects. This heating process is irreversible and demonstrates that the low thermal conductivity was due to nanostructuring.
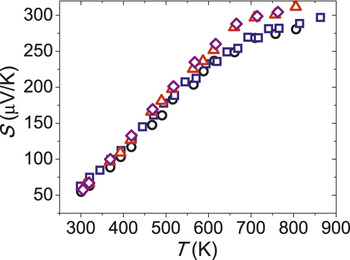
We then returned to PbTe, because it has a valence band with two peaks, a light-hole band and a heavy-hole band, and in principle, this should result in a high power factor. SrTe has the same crystal structure as PbTe, but it is not very soluble in it, so if a few percent of SrTe is introduced into PbTe, it will precipitate from the PbTe matrix. If the material is then doped with holes, using Na for example, the resultant sample has a Seebeck coefficient of approximately 50 µV/K at room temperature. As the material is heated, the Seebeck coefficient increases steeply, as shown in Figure 7 . This is due to the fact that the holes are thermally excited in the light-hole band, and the electrons flowing as a result have high effective mass, which increases the Seebeck coefficient. Reference Biswas, He, Zhang, Wang, Uher, Dravid and Kanatzidis40 When we included a few percent of SrTe and allowed it to precipitate uniformly, we obtained nanocrystals of SrTe. The dispersity was relatively narrow, between 1 nm and 10 nm.
Influence of increasing temperature on the Seebeck coefficient in PbTe. The different data points are from three different samples. The Seebeck coefficient increases sharply as the material is heated. Reference Biswas, He, Zhang, Wang, Uher, Dravid and Kanatzidis40 Note: S, thermopower; T, temperature.

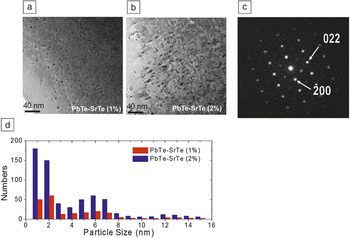
The difference between the materials containing 1% and 2% SrTe is shown in Figure 8 ; the material with 1% SrTe has more nanocrystals. However, for the 2% doping, there are fewer nanocrystals, but the crystals are bigger. This results in a very large interface area, increasing the scattering of intermediate sized phonons with mean-free path on the order of the nanocrystal size. The electron diffraction pattern in Figure 8 is that of a single crystal; this indicates perfect endotaxial alignment of the lattices, and the thermal conductivity is reduced from 1.3 W/mK in the pure material to 0.8 W/mK at 900 K. Reference Biswas, He, Blum, Wu, Hogan, Seidman, Dravid and Kanatzidis41
Comparison of PbTe with 1% and 2% SrTe. (a) Transmission electron microscopy micrograph of PbTe-(1%)SrTe and (b) PbTe-(2%)SrTe. (c) Diffraction pattern. (d) Particle size distribution for both PbTe-(1%)SrTe and PbTe-(2%)SrTe. PbTe matrix and SrTe nanocrystals have similar symmetry, structure, and lattice parameters, and corresponding crystallographic planes and directions are completely aligned in 3D. Reference Biswas, He, Blum, Wu, Hogan, Seidman, Dravid and Kanatzidis41

We also found that the introduction of 1% or 2% SrTe into PbTe had a negligible effect on the hole mobility. This means that there is essentially no carrier scattering from these extra particles. In order to understand the reason for this, we performed some calculations with Wolverton and Freeman at Northwestern University. We were able to calculate the positions of the valence bands between the SrTe nanoparticle, which is a wide-gap material, and the PbTe matrix, which is narrow gap. Because both materials are tellurides, and the top of the band is mainly determined by tellurium orbitals, the tops of the valence bands have similar energy. Therefore, holes can find a favorable energy level in the nanoparticle, and they scatter less. On the other hand, electrons in the conduction band must overcome the large energy barrier, and there is strong scattering. The result is a high power factor because the holes do not scatter and low thermal conductivity, and so ZT =1.7 for 2% SrTe doping; this was a record at the time. Reference Biswas, He, Zhang, Wang, Uher, Dravid and Kanatzidis40
The thermal conductivity is quite low (0.8 W/mK) due to the scattering of short and intermediate mean-free path phonons, but the nanostructure allows the long wavelength (100 nm to a few μm) phonons to escape. To address this problem, we moved from the nanoscale to the mesoscale, by grinding the material into sizes that are more appropriate for the long mean-free path phonons. We processed all the material using spark plasma sintering such that each grain was on the mesoscale, but the material itself was nanostructured. The result was a further reduction in thermal conductivity and an increase in ZT from 1.7 to 2.2. This illustrates the importance of scale in thermoelectrics: if we only control the atomic scale, the value of ZT is limited to 1; if we tackle the nanoscale, we can achieve ZT = 1.7; and when we include the mesoscale, we can reach ZT = 2.2. Reference Biswas, He, Blum, Wu, Hogan, Seidman, Dravid and Kanatzidis41 We refer to this all-scale hierarchical approach as the second paradigm of optimization of TE in the field.
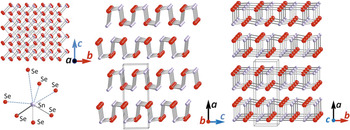
We then found a surprising result, when we started to work with SnSe. Reference Zhao, Lo, Zhang, Sun, Tan, Uher, Wolverton, Dravid and Kanatzidis42 Because of its orthorhombic structure, SnSe is not particularly attractive as a thermoelectric, shown in Figure 9 . Although the structure is layered, it has no van der Waals gap. The layers have weak bonding. We grew cm sized crystals of SnSe and measured the properties. Growing crystals of SnSe is very challenging because there is a high temperature phase transition, which tends to crack the containers, so double silica tubes must be used. The undoped material is a semiconductor, with relatively low conductivity, but we were able to measure conductivity in all directions due to the size of the crystal. The conductivity in the b and c directions are comparable and higher in conductivity than in the a direction, which makes sense because of the weak bonding. The Seebeck coefficients are very large—with values over 500 at room temperature—and increase to a maximum as temperature increases, corresponding to a phase transition at 760 K to another layered orthorhombic structure. Even above 760 K, the Seebeck coefficient remains high, resulting in a power factor of 10 µW/cm·K2 at 900 K. Reference Zhao, Lo, Zhang, Sun, Tan, Uher, Wolverton, Dravid and Kanatzidis42 This is surprisingly high, since it is a semiconductor that is not doped.
Crystal structure of SnSe. The box outline is the unit cell.

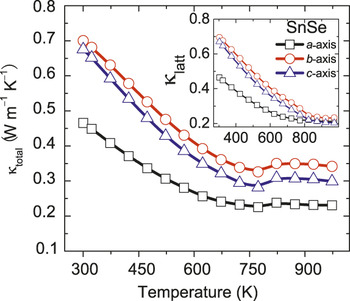
The more surprising result was the thermal conductivity of the sample in all three directions, shown in the inset in Figure 10 . This measurement was a great achievement, because the brittle sample needs to be cut without breaking it. We found that the thermal conductivity at room temperature on the b-axis was very low, 0.7–0.8 W/mK and even lower, 0.3–0.4 W/mK, at high temperatures. In the other direction it was further lower (i.e., perpendicular to the layers). That was surprising because 0.3–0.4 W/mK (with 15% error)) was one of the lowest values of thermal conductivity we have obtained, and there is no nanostructure. The low thermal conductivity of this single phase gives rise to a surprisingly high value of ZT = 2.6 along the b-axis, but even along the c-axis, ZT = 2.25. Reference Zhao, Lo, Zhang, Sun, Tan, Uher, Wolverton, Dravid and Kanatzidis42
Thermal conductivity of SnSe as a function of temperature. The thermal conductivity at room temperature along the b-axis is very low, 0.7–0.8 W/mK, and even lower, 0.3–0.4 W/mK, at high temperatures. The thermal conductivity is even lower in the a and c directions. These are some of the lowest thermal conductivity values obtained in the absence of a nanostructure. The inset shows the lattice thermal conductivity as a function of temperature. Reference Zhao, Lo, Zhang, Sun, Tan, Uher, Wolverton, Dravid and Kanatzidis42 Note: κtotal, thermal conductivity; κlatt, lattice thermal conductivity.

Wolverton and his group investigated the reasons for this low value of thermal conductivity using phonon calculations and electronic structure calculations. Reference Zhao, Lo, Zhang, Sun, Tan, Uher, Wolverton, Dravid and Kanatzidis42 They calculated the Gruneisen parameters γ (different from the band degeneracy γ used earlier in Equation 3) for this sample (roughly speaking this parameter is a measure of the softness of the material), which is related to the lattice thermal conductivity through:
 $${\kappa _{latt}} = A{{{M_{ave}}{\theta ^2}\delta } \over {{\gamma ^2}{n^{2/3}}T}}$$
,
where M ave is the average atomic mass of the atoms per unit cell, θ is the Debye temperature, δ is the cube root of the volume per atom, A is a constant, and n is the number of atoms per unit cell. Since thermal conductivity depends on γ2, large values of the Gruneisen parameter γ result in low thermal conductivity. For SnSe, γave ≈ 4.1, which is extremely large; for PbTe, γave ≈ 1.4, for AgSbTe2, γave ≈ 2.05, and for AgSbSe2, γave ≈ 3.5. So apparently, this lattice is very soft and pliable and has an amazing ability to dissipate phonons, to inhibit phonon transfer. Reference Zhao, Lo, Zhang, Sun, Tan, Uher, Wolverton, Dravid and Kanatzidis42
Conclusion
To summarize, I would like to give what we call the panoscopic view of thermoelectrics. A number of features must be considered: the atomic scale; the nanoscale; the mesoscale, the band engineering; and the band alignment. We need to consider all these properties in trying to develop new materials. Moving from the atomic scale to the nanoscale, we can lower thermal conductivity, and by moving to the mesoscale it can be lowered again. We also need to consider the band alignment and optimization of the electronic structure to achieve the highest ZT. Making a device introduces more length scales, including electrical contacts. Adding the contacts is not trivial, since these are on the millimeter scale; the legs must be cut for the devices, which is on the scale of millimeters, and finally, modules must be constructed. All these dimensions and all of these scales taken together contribute to the panoscopic view, and they must all function simultaneously if we are to build an energy converting device.
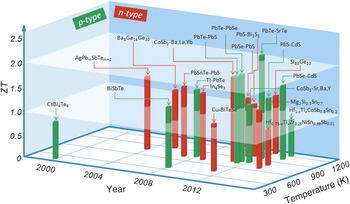
Figure 11 Reference Zhao, Dravid and Kanatzidis43 shows a summary of the highest ZT materials available today. The field is very dynamic, so these values are changing fairly quickly, and new materials are added. The red columns are the n-type materials; the green columns are the p-type materials. There are two ceilings, one is for ZT = 1 and the other is for ZT = 2, both of which have been penetrated, and the current maximum is ZT = 2.6.
Highest ZT materials. There are two ceilings: ZT = 1 and ZT = 2. Both have been penetrated, and the current maximum is ZT = 2.6. Reference Zhao, Lo, Zhang, Sun, Tan, Uher, Wolverton, Dravid and Kanatzidis42 Note: ZT, figure of merit.

Acknowledgments
M.K. thanks the US Department of Energy (DOE), Basic Energy Sciences, through the EFRC Program for the last five years. Before that, he obtained funding from the Office of Naval Research. The EFRC was particularly important because it enabled a number of researchers to collaborate on many of the important problems in thermoelectrics. He also thanks his collaborators at Northwestern University, Vinayak Dravid, Chris Wolverton, and David Seidman; Tim Hogan, Bhanu Mahanti, and Eldon Case at Michigan State University; Ctirad Uher at the University of Michigan; Jos Heremans at Ohio State University; and Yaniv Gelbstein at Ben Gurion University in Israel. He would like to acknowledge recent postdoctoral fellows Lidong Zhao, Kanishka Biswas, John Androulakis, Jiaqing He, and Gangjian Tan and graduate students Rachel Korkosz, Steven Girard, Yeseul Lee, and Thomas Chasapis.

Mercouri G. Kanatzidis is the Charles E. and Emma H. Morrison Professor of Chemistry at Northwestern University and also holds an appointment at Argonne National Laboratory. He received his BSc degree in chemistry from Aristotle University of Thessaloniki, Greece, in 1979 and his PhD degree in chemistry from the University of Iowa in 1984. He was a postdoctoral research fellow at the University of Michigan and Northwestern University from 1985 to 1987. His current research interests include the area of discovery as well as design and synthesis of advanced materials, nanostructures, and large crystals. He is the recipient of the ACS Morley Medal, an Alfred Sloan Research Fellowship, the Richard Dreyfus Teacher-Scholar Award, an NSF Presidential Young Investigator Award, the Beckman Young Investigator Award, a Guggenheim Fellowship, and the International Thermoelectric Society Outstanding Achievement Award. He is a Fellow of MRS and AAAS. Kanatzidis has supervised more than 40 doctoral students and 80 postdocs. He has authored over 850 publications and holds over 20 patents. Kanatzidis can be reached by email at m-kanatzidis@northwestern.edu.