Implications
Linking producer payments to eating quality, in combination with yield, is vital for improving the beef industry and delivering a quality product to consumers. Both ossification score and animal age are used as indications of age-related decreases in eating quality and tenderness. This work demonstrates that ossification score is a more accurate predictor of eating quality for less mature animals, commonly used for beef production. However it is limited in its use for mature animals such as cull cows, for which animal age is a more appropriate measure.
Introduction
For beef to remain competitive in the market place, the industry must address consumer demands. Variable eating quality, in particular consumers being unable to identify beef of a consistent or desired tenderness, is seen as a major factor in the global decline in beef consumption (Morgan et al., Reference Polkinghorne, Watson, Thompson and Pethick1991; Polkinghorne et al., Reference Polkinghorne, Nishimura, Neath and Watson2008b). The Meat Standards Australia (MSA) system has addressed this issue through a prediction model using carcass traits and pre-slaughter guidelines to supply beef to consumers with a guaranteed tenderness and eating quality (Polkinghorne et al., Reference Polkinghorne, Thompson, Watson, Gee and Porter2008a and Reference Polkinghorne, Nishimura, Neath and Watson2008b; Watson et al., Reference Watson, Gee, Polkinghorne and Porter2008a and Reference Weston, Rogers and Althen2008b). A similar system guaranteeing beef eating quality would be well accepted by European beef consumers (Verbeke et al., Reference Waggoner, Dikeman, Brethour and Kemp2010), and would also enable products within such a system to command a premium price (Lyford et al., 2010).
The Australian MSA system relies on a maturity estimate as an essential part of the quality prediction (Polkinghorne et al., Reference Polkinghorne, Nishimura, Neath and Watson2008b). Animal maturity has been well established as a valuable indicator of eating quality through its negative relationship with tenderness (Shorthose and Harris, Reference Thompson, Polkinghorne, Hwang, Gee, Cho, Park and Lee1990; Schonfeldt and Strydom, Reference Shackelford, Koohmaraie and Wheeler2011). As an animal matures crosslinks develop within all collagen, including the collagen present in muscle tissue. These crosslinks increase the thermal stability and decrease the solubility of the collagen matrix (Weston et al., Reference Bailey2002). With the increased stability more collagen survives the cooking process intact, acting to reduce the tenderness of the subsequent product (Weston et al., Reference Bailey2002). Therefore meat becomes tougher as animals mature.
Within Europe, animal maturity is estimated using animal age, with certain ages set as thresholds to differentiate beef into different markets. Alternatively, the MSA system and the American United Stated Department of Agriculture (USDA) system use ossification score as an indicator of animal maturity in the prediction of beef eating quality (USDA, Reference Verbeke, Van Wezemael, de Barcellos, Kügler, Hocquette, Ueland and Grunert1997; Polkinghorne et al., Reference Polkinghorne, Nishimura, Neath and Watson2008b). Ossification score is measured by a visual assessment of the degree of calcification in the cartilage of the sacral and dorsal vertebrae (USDA, Reference Verbeke, Van Wezemael, de Barcellos, Kügler, Hocquette, Ueland and Grunert1997). Animal age and ossification score in slaughter cattle in the USA have a positive relationship (Shackelford et al., Reference Shorthose and Harris1995) with one population of cattle having a simple correlation coefficient of r=0.64 (Raines et al., Reference Scheffler, Buskirk, Rust, Cowley and Doumit2008). However this relationship has not been examined in carcasses with greater maturity. Ossification score reaches its maximum score of 600 as animals reach 8 years of age (Raines et al., Reference Scheffler, Buskirk, Rust, Cowley and Doumit2008). As such it would be expected that for animals with greater maturities there would be a reduced or no correlation between animal age and ossification score.
The correlation between animal age and ossification score, and the correlations between these measures and eating quality are affected by several factors. The rate of ossification and hence ossification score at any given age is strongly influenced by the hormonal status of an animal, particularly through the hormone oestrogen (Field et al., Reference Field, Nelms and Schoonover1997; Scheffler et al., Reference Schonfeldt and Strydom2003). Factors such as sex, castration, hormonal growth promotants and parity status all influence oestrogen levels and therefore ossification score at any given age (Waggoner et al., Reference Watson, Polkinghorne and Thompson1990; Field et al., Reference Field, McCormick, Balasubramanian, Sanson, Wise, Hixon, Riley and Russell1996; Scheffler et al., Reference Schonfeldt and Strydom2003). In contrast animal age is a simple linear measurement and is not affected by physiological processes such as age at maturity, pregnancy and lactation. Through its close relationship with physiological processes, ossification score has a better capacity than animal age to reflect the physiological maturity of an animal (Field et al., Reference Field, Nelms and Schoonover1997) and consequently the maturity related decrease in tenderness (Weston et al., Reference Bailey2002). However this effect may be limited when ossification scores approach and reach the upper limit in groups with greater maturities.
Therefore we hypothesize that European cattle will demonstrate a positive relationship between animal age and ossification score, particularly for animals with lesser maturity, and for this relationship to be reduced for animals with greater maturity. We also hypothesize that ossification score will be a better predictor of eating quality than chronological age for carcasses with lesser maturity, whereas animal age will be a better predictor of eating quality in carcases of greater maturity.
Material and methods
Animals and muscle samples
The cattle were chosen randomly at commercial abattoirs on the day of sampling to reflect the different commercial production practices within France, Poland, Ireland and Northern Ireland. As a result the carcasses had an uneven distribution of breed, age, sex and carcass composition. The Polish carcasses were processed at a number of facilities distributed across the country. The Irish carcasses were processed at two commercial abattoirs and one pilot scale abattoir. The French carcasses were processed at a single facility in the West of France. The carcasses from Northern Ireland were processed at five different facilities distributed across the region.
The cattle were slaughtered commercially according to standard practice in each country. Animal age in days was determined from the legally documented birth dates and slaughter dates, as required in the European Union. All carcasses were graded by personnel trained in MSA and USDA meat grading according to standard MSA protocols for characteristics such as ossification (an estimate of maturity), marbling and ultimate pH. Ultimate pH was recorded at 24 h post slaughter. Ossification score is measured following the guidelines from the USDA. It is a measure of the calcification in the spinous processes in the sacral, lumbar and thoracic vertebrae and provides a scale between 100 and 590 in increments of 10 for MSA which is an assessment of physiological age of a bovine carcass (AUS-MEAT, 2005). Marbling score is a measure of the fat deposited between individual fibres in the rib eye muscle ranging from 100 to 1100 in increments of 10. Marbling is assessed at the quartering site of the chilled carcass and is calculated by evaluating the amount, piece size and distribution of marbling in comparison to the MSA reference standards (AUS-MEAT, 2005; MLA Reference Morgan, Savell, Hale, Miller, Griffin, Cross and Shackelford2006).
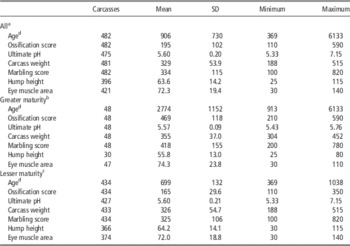
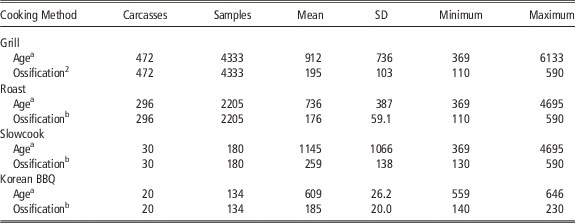
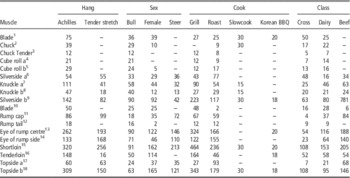
All cattle were growth-promotant free as these are prohibited in the European Union. There was a wide range in age and ossification score, though the distribution was heavily weighted towards carcasses of lesser maturity (Table 1). There was a wide range in the other carcass traits measured such as marbling score and carcass weight (Table 1). There were four different cooking methods, grill, roast, slow cook and Korean BBQ (barbeque). All cooking methods had muscle samples from carcasses with a wide range in age and ossification score. Some carcasses and muscle samples were prepared using more than one cooking method (Table 2). The postmortem ageing period of the muscle samples ranged between 5 and 35 days, and varied between countries, cooking method and other effects in the study (Table 3). Some muscle samples had multiple ageing periods. All muscles were prepared using the grill cooking method as this is the method most commonly investigated in the literature. In order to examine the other cooking methods, subsets of the muscle samples had portions which were also prepared using one of the other cooking methods.
Number of bovine carcasses and the raw maximum, minimum, mean and standard deviation for the covariates measured in this study, by maturity range

All other measures were recorded as standard Meat Standards Australia (MSA) measurements by trained graders.
The number of carcasses varies for each measure because not all measurements were recorded for all carcasses.
a All=the full range of bovine carcasses.
b Greater maturity=carcasses not classified as having lesser maturity.
c Lesser maturity=ossification score ≤200 or age ≤987 days.
d Age=chronological age in days.
Number of bovine carcasses, number of samples from those bovine carcasses and the raw maximum, minimum, mean and standard deviation of animal age (days) and ossification score by cooking method

BBQ=barbeque.
a Chronological age in days.
b Ossification score was recorded as standard MSA (Meat Standards Australia) assessments by trained graders.
Number of bovine carcasses from which specific muscles were sampled, within hang method, sex, cooking method and breed purpose, by muscle

BBQ=barbeque; Cross=beef and dairy breed cross; Dairy=dairy breed; Beef=beef breed.
1 m. triceps brachii caput longum; 2 m. serratus ventralis cervicis; 3 m. supraspinatus; 4 m. longissimus thoracis et lumborum; 5 m. spinalis dorsi; 6 m. semitendinosus; 7 m. rectus femoris; 8 m. vastus lateralis; 9 m. biceps femoris; 10 m. infraspinatus; 11 m. biceps femoris; 12 m. tensor fasciae latae; 13 m. gluteus medius; 14 m. gluteus medius; 15 m. longissimus thoracis et lumborum; 16 m. psoas major; 17 m. adductor femoris; 18 m. semimembranosus.
As expected in an observational study there was an uneven distribution of cattle and samples amongst all the effects controlled for in this study. Animal breed was divided into three categories or classes; beef breeds, dairy breeds and crosses between the beef and dairy breeds. Eighteen different muscles were represented in the 6852 different samples; however the number and type of muscles sampled varied between carcasses and other factors in the study (Table 3).
Meat preparation
Meat preparation and consumer assessment of eating quality for the four cooking methods were performed according to protocols for MSA testing described by (Anonymous, 2008; Watson, 2008a). In all cases the dissected muscle was denuded of all fat and epimysium. For the grill and roast samples a block measuring 75×25×150 mm was prepared then commencing at the proximal or anterior end of the block, five 25 mm thick steaks were cut across the grain using a cutting guide. The slow cook samples were portioned into twenty two 21×21×21 mm cubes. For the Korean BBQ samples initially a 90×20×75 mm block with the grain across the 75 mm line was prepared. After the designated postmortem ageing period the Korean BBQ samples were then conditioned to −4°C and sliced to create eleven 4 mm thick strips sliced across the grain. After their designated postmortem ageing period samples were then either cooked and served directly to consumers or frozen at −18°C. Frozen samples were thawed in a refrigerator at 2°C to 5°C for 24 h (grill, slow cook), 48 h (roast) or at room temperature 15 to 30 min before serving (Korean BBQ).
Cooking procedures
Grill
Steaks were cooked on a SILEX S-Tronic 163 GR Dual Contact grill with cast iron plates set at 220°C to 230°C. The grill was preheated for 45 min and a set of sacrificial steaks were cooked to commence the cooking cycle and stabilize temperature recovery. All steaks were cooked for a total of 300 s (360 s for well done), with the lid up for the first 30 s and the lid closed for the remaining 270 s (330 s for well done). After cooking steaks were rested for two minutes before halving and placing on pre-numbered serving plates. The consistent steak thickness, grill temperature and cooking time, allowed for an even doneness (internal temperature of approximately 65°C for medium and 78°C for well-done) for all samples.
Roast
Roasts were prepared in a commercial gas oven with sufficient capacity to simultaneously cook all roasts for any one taste panel. The oven was preheated to 160°C before the loading of the 42 roast blocks, paired for weight. The oven was maintained at 160°C during the cooking period and each roast pair was removed when an internal temperature of 65°C was reached (78°C for well-done roasts). On removal the roasts were placed in a bain marie steamer pan and rested for a minimum of 5 min before trimming to a standard 65×65×110 mm block. After trimming and during testing all roasts were kept in bain marie steamer pans which had been preheated to 48°C. Roasts were served to consumers in 10 mm slices and the carving of each slice was performed directly before serving, with an internal facing slice removed immediately before taking the first designated sample. After each slice was removed the roast block was returned to the bain marie. The total serving operation took 35 min.
Slow cook
The 22 cubes from each sample were sprayed liberally with olive oil and browned before cooking in a preheated stainless steel fry-pan for 90 s. After browning they were transferred to a bain marie steamer pan containing 300 ml of stock. The stock was made from; 12 l of boiling water, 1200 g defrosted and sliced frozen onion, 1200 g of defrosted and sliced frozen carrot, 400 g of fresh machine chopped celery and 4 level metric tablespoons of fine salt. The individual bain marie steamer pans were held at a boil for 30 min before adding the browned sample cubes. The cubes were then simmered at 93°C to 95°C for 2 h. The steamer pans were removed after cooking and placed in a water bath to achieve rapid cooling. The samples were then held in bain maries set to 48°C for a maximum of 3 h before serving.
Korean BBQ
Korean BBQ samples were directly cooked and served by a host seated at a table with five consumers. A metal disc cooker was mounted on a three ring gas burner with modified controls to facilitate fine adjustment. A thermocouple sensor was mounted to the cooking surface to record plate temperature, which was maintained at between 250°C and 260°C. Single samples were placed on the hotplate in the serving order and turned as moisture pooled on the surface. The sample was served to the nominated consumer when liquid pooled on the second side. The visual indicator combined with the temperature controlled surface produced a uniform medium degree of doneness in the cooked beef strip.
Consumer panels
Consumer panels for grilled samples were arranged in groups of 20 consumers, with three such sessions being held per day. There were 48, 54, 66 and 249 grill sessions in France, Ireland, Poland and Northern Ireland, respectively. Roast and slow cook consumer panels were held with groups of 60 consumers. There were 5, 11 and 58 roast sessions in Ireland, Poland and Northern Ireland, respectively. There were five slow cook sessions in Poland. Korean BBQ procedures provide for direct cooking with five consumers served by each host in a session. There were 30 Korean BBQ sessions in Ireland.
For all cooking methods each consumer received seven portions: the first portion (a link sample) was derived from either a generic striploin or rump muscle and expected to be of average quality – the sensory scores for this portion were not part of the final statistical analysis. The remaining six portions were derived from one of the muscle samples collected. Product order was determined by 6×6 Latin square design and every product occurred an equal number of times (6) in each presentational position, before and after each other product in the Latin square. This provides a balance for frequency, order and carryover effects.
Consumers scored steaks out of 100 for tenderness, juiciness, flavour liking and overall liking, by making a mark on a 100 mm line scale, with the low end of the scale representing a negative response and the high end of the scale representing a positive response. For a more detailed description of the testing procedures see Anonymous (2008) and Watson (2008a).
Consumer demographics
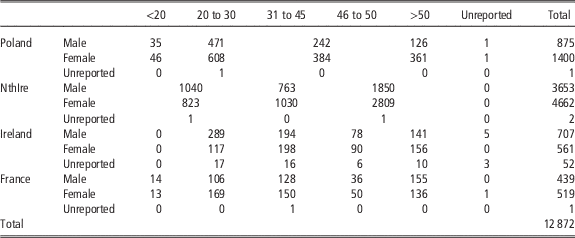
Consumers scored meat from their country of origin and were sourced through both commercial consumer testing organizations and local clubs and charities. They were selected to reflect the general population with the only requirement being that they considered meat an important part of their diet. The age ranges and the distribution of the gender of the consumers for each of the countries is reported in Table 4. A more detailed description of the demographics of the French consumers can be found in Legrand et al. (Reference Lyford, Thompson, Polkinghorne, Miller, Nishimura, Neath, Allen and Belasco2013).
Gender and age range (years) of the untrained consumers used in the sensory analysis

NthIre=Northern Ireland.
Numbers that sit between two columns indicates that the age range of the consumers spans both age groups.
Meat quality score
Each muscle, cooked with a specified cooking method, was assessed by 10 individual untrained consumers. The highest and lowest two scores for each muscle were removed and the average was calculated for the remaining six scores. These clipped mean values for tenderness, juiciness, flavour liking and overall liking were weighted and combined to create a single meat quality score (MQ4). The weightings were calculated using a discriminant analysis, as performed by Watson et al. (Reference Watson, Gee, Polkinghorne and Porter2008a and Reference Weston, Rogers and Althen2008b) and are 0.3×tenderness, 0.1×juiciness, 0.3×flavour liking and 0.3×overall liking. There is a high correlation between all four sensory scores with a minimum partial correlation coefficient between any of the scores of 0.66 calculated on a subset of the data (Bonny et al., Reference Field, McCormick, Balasubramanian, Sanson, Wise, Hixon, Riley and Russell2015).
Statistical analysis
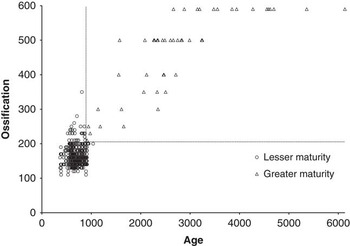
The effect of both ossification score and age on the composite MQ4 score was assessed across the full ranges of ossification score and animal age in the data set. The relationship between these two measurements and the MQ4 score was also explored within groups of carcasses with lesser or greater maturity. The first release of the MSA model used commercially in Australia disqualified any carcass with an ossification score >200. To align with this the ‘less mature group’ was limited to animals that had an ossification score of 200 or less, or were ⩽987 days old at slaughter, the age equivalent to an ossification score of 200 within this data set (Figure 1). All carcasses not meeting these criteria were allocated to the ‘greater maturity range.’ All analyses were performed on the whole data set and on these two subgroups using a combination of both correlation analyses and regression analyses.
The age (days) of each bovine carcass against the ossification score, each circle represents a carcass, with the carcasses above and right of the dotted lines were classified as the greater maturity group; carcasses to the left and below the dotted lines were classified as the lesser maturity group. Ossification score was recorded as standard MSA (Meat Standards Australia) measurements by trained graders.

Using a data set with only one observation per carcass, the partial correlation coefficients between ossification score and age for the three maturity ranges was determined with a bivariate model (SAS v9.1) accounting for the fixed effects of country, sex, breed class and kill group, and significant interactions between these terms. A similar approach using a bivariate model was then taken to determine the partial correlation coefficients between the maturity measures and MQ4 within each of the three maturity ranges, accounting for the fixed effects of country, sex, breed class and kill group, and significant interactions between these terms. Initially this was done within each muscle separately, enabling individual partial correlations to be determined for each muscle. This process was then repeated, but utilizing data from all muscles combined in the one data-set with ‘muscle’ included as a fixed term within the model. This enabled estimation of the mean partial correlation across all muscles.
The composite score MQ4 was analysed using a linear mixed effects model (SAS v9.1). Initially, a base model for all three maturity ranges was established, with the following fixed effects and all their significant interactions, carcass hanging method, cooking method, muscle type, sex, country and breed class. Postmortem ageing period in days was included as a covariate. Animal identification number within carcass source country, kill group (animals slaughtered on the same day at the same abattoir) and consumer country were included as random terms. The inclusion of animal identification number assumes that the correlation between eating quality scores in different muscles within the same animal are equal. Where this is not the case, this is likely to result in the analysis being over sensitive with respect to significant interactions with cut. The degrees of freedom were determined using the Kenward and Rodger technique. The consumers were not expected to have much variation between countries on the basis of previous work (Thompson et al., 2008; Polkinghorne et al., Reference Raines, Dikeman, Unruh, Hunt and Knock2011; Legrand et al., Reference Lyford, Thompson, Polkinghorne, Miller, Nishimura, Neath, Allen and Belasco2013). Individual base models were determined for the three different groups of data.
Separately ossification score and age were then incorporated as both single and squared terms into the base models, including all interactions, to assess their association with the MQ4. In all cases, non-significant terms (P>0.05) were removed in a step-wise fashion. Where ossification score or age and their interactions remained significant we have interpreted the magnitude of effect of the covariate on MQ4. Magnitude of effect was calculated as the difference between the highest and lowest predicted MQ4 values over the range of the covariate being examined, with larger values implying a greater influence of the covariate on MQ4. A positive value would indicate an increase in MQ4 over the range of the covariate, while a negative value would indicate a decrease in MQ4 over the range of the covariate. Following this the covariates ossification score, marbling score, ultimate pH, animal age and carcass weight were tested in the models to evaluate their effects on the relationship between MQ4 and ossification score and age.
Results
Correlation between maturity measures
The partial correlation coefficients between ossification and age were strongly positive across all the data, 0.79 (P<0.001), and within the group with greater maturity, 0.79 (P<0.001), while being markedly reduced for the carcasses with lesser maturity, 0.35 (P<0.01).
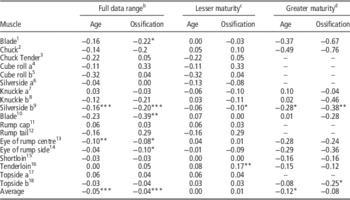
The maturity measures were also assessed for their correlation with MQ4. As ossification score and age are measurements of carcasses and MQ4 is a measurement of muscles, the correlations were also performed for each muscle tested (Table 5). Where significant (P<0.05), the correlation between either of the maturity measures and MQ4 was negative, except for the correlation between ossification score and MQ4 in the tenderloin for the group with lesser maturity. On average both age and ossification score had small negative correlations with MQ4 across all the data. This average was driven by two muscles for age and five muscles for ossification score. Neither age nor ossification score were correlated with MQ4 for the group with lesser maturity, despite the negative relationship between ossification score and MQ4 for both the tenderloin and the silverside b. For the group with greater maturity only animal age correlated with MQ4 overall and this was underpinned by a single muscle, the silverside b. Despite both the silverside and the topside b demonstrating negative correlations between ossification score and MQ4 for the greater maturity group, there was no correlation when all muscles were considered together.
Partial correlation coefficients between either the chronological age (days) or the ossification score of bovine carcasses, and eating quality (MQ4Footnote a ), overall and by muscle, for three maturity ranges

1 m. triceps brachii caput longum; 2 m. serratus ventralis cervicis; 3 m. supraspinatus; 4 m. longissimus thoracis et lumborum; 5 m. spinalis dorsi; 6 m. semitendinosus; 7 m. rectus femoris; 8 m. vastus lateralis; 9 m. biceps femoris; 10 m. infraspinatus; 11 m. biceps femoris; 12 m. tensor fasciae latae; 13 m. gluteus medius; 14 m. gluteus medius; 15 m. longissimus thoracis et lumborum; 16 m. psoas major; 17 m. adductor femoris; 18 m. semimembranosus.
a A weighted combination (0.3, 0.1, 0.3, 0.3) of four sensory scores, tenderness, juiciness, flavour liking and overall liking.
b All the carcasses.
c Ossification score ⩽200 or age ⩽987 days.
d Carcasses not classified as having lesser maturity.
*P<0.05; **P<0.01; ***P<0.001.
Influence of maturity measures on eating quality
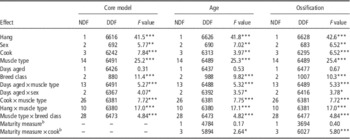
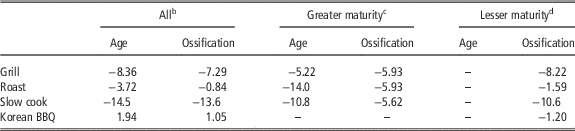
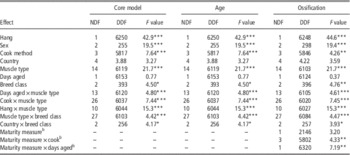
Outcomes for the core model utilizing the full data set are presented in Table 6, along with this same core model and either ossification score or age included as covariates. Both ossification score and age had a significant, negative relationship with MQ4. Although this effect varied between cooking methods, in all cases age had a greater magnitude of effect on MQ4 than ossification (Table 7) with both covariates demonstrating a negative relationship with MQ4. When the models were separately corrected for the covariates ultimate pH, carcass weight, hump height and eye muscle area (results not shown) ossification and age remained significant in the model. Correcting for marbling score also had no impact on any of the other effects within the core model or the model including ossification score. The only variation to this theme was for the model including animal age, the effect of which no longer varied by cooking method when corrected for marbling score.
F values and degrees of freedom for effects included in the base model predicting the composite eating quality score MQ4Footnote a using the full range of carcass maturity in the data set, and the base model with either the age or ossification score of bovine carcasses included

NDF=numerator degrees of freedom; DDF=denominator degrees of freedom.
The core model comprised of the following fixed effects and all of their significant interactions; carcass hang method, cooking method, muscle type, sex, country, and breed class. Postmortem ageing period in days was included as a covariate. Animal identification number, within carcass source country, consumer country and kill group (animals slaughtered on the same day at the same abattoir) were included as random terms. The covariates age and ossification score were included separately.
a A weighted combination (0.3, 0.1, 0.3, 0.3) of four sensory scores, tenderness, juiciness, flavour liking and overall liking.
b Maturity measure=either age or ossification score.
*P<0.05; **P<0.01; ***P<0.001.
The magnitude of effectFootnote a of either the animal age (days) or ossification score of bovine carcasses on the eating quality (MQ4) of beef, over the range of either age or ossification by cooking method, for the three different maturity ranges

BBQ=barbeque.
a Magnitude of effect is calculated as the difference between the highest and lowest predicted MQ4 values across the range of ossification or age in the group examined.
b All the carcasses.
c Greater maturity=carcasses not classified as having lesser maturity.
d Lesser maturity=ossification score ⩽200 or age ⩽987 days.
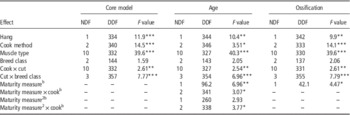
When the effect of ossification and age were analysed separately within the lesser and greater maturity ranges, their association with MQ4 differed. Within the lesser maturity group, ossification score had a significant effect on MQ4, although this effect varied by cooking method and with postmortem ageing (P<0.01; Table 8). Alternatively, age showed no association with MQ4 (Table 8). This result was not influenced after correcting the model for the covariates ultimate pH, carcass weight, marbling score, hump height and eye muscle area (results not shown). Alternatively, correcting the model for the covariates carcass weight, hump height and ultimate pH resulted in a more consistent effect of ossification score whose association with MQ4 no longer varied between sexes or carcase source countries.
F values and degrees of freedom for effects included in the base model predicting the composite eating quality score MQ4Footnote a for bovine carcasses with lesser maturity, and the base model with either the age or ossification score of bovine carcasses included

NDF=numerator degrees of freedom; DDF=denominator degrees of freedom.
Data set includes carcasses with an ossification score ⩽200 or an age ⩽987 days; the core model comprised of the following fixed effects and all of their significant interactions; carcass hanging method, cooking method, muscle type, sex, country, and breed class. Postmortem ageing period in days was included as a covariate. Animal identification number, within carcass source country, consumer country and kill group (animals slaughtered on the same day at the same abattoir) were included as random terms. The covariates age and ossification score were included separately.
a A weighted combination (0.3, 0.1, 0.3, 0.3) of four sensory scores, tenderness, juiciness, flavour liking and overall liking.
b Maturity measure=either age or ossification score.
*P<0.05; **P<0.01; ***P<0.001.
Within the greater maturity group both ossification and age were associated with MQ4 (P<0.05; Table 9), although the effect of age varied between cooking methods. When samples were grilled, ossification score has a greater magnitude of effect on MQ4 than age (Table 7). When samples were roasted or slow-cooked, age had a greater magnitude of effect than the model including ossification score (Table 7). For the most part, correcting the models for the covariates had no impact on the magnitude of the association between MQ4 and either ossification or age. The only variation to this theme was for ossification which was no longer significant when the model was corrected for carcase weight or hump height.
F values and degrees of freedom for effects included in the base model predicting the composite eating quality score MQ4Footnote a for bovine carcasses with greater maturity, and the base model with either the age or ossification score of bovine carcasses included

NDF=numerator degrees of freedom; DDF=denominator degrees of freedom.
Data set includes carcasses with an ossification score ⩽200 or an age ⩽987 days; the core model comprised of the following fixed effects and all of their significant interactions; carcass hanging method, cooking method, muscle type, sex, country and breed class. Postmortem ageing period in days was included as a covariate. Animal identification number, within carcass source country, consumer country and kill group (animals slaughtered on the same day at the same abattoir) were included as random terms. The covariates age and ossification score were included separately.
a A weighted combination (0.3, 0.1, 0.3, 0.3) of four sensory scores, tenderness, juiciness, flavour liking and overall liking.
b Maturity measure=either age or ossification score.
*P<0.05; **P<0.01; ***P<0.001.
Discussion
Correlation between maturity measures
Aligning well with the hypothesis, ossification score and animal age had strong positive partial correlation coefficients across all the data and for the group with greater maturity. Although still positive, the correlation coefficient for the group with lesser maturity was lower. This supports the work of others who have investigated the relationship between ossification score and age within the USDA beef grading system (Shackelford et al., Reference Shorthose and Harris1995; Raines et al., Reference Scheffler, Buskirk, Rust, Cowley and Doumit2008) and supports the idea that the plateau in ossification scores would reduce the slope of the association between ossification score and age. The strong correlation between these two measurements indicates that they are likely to have similar relationships with eating quality. This plateau in ossification score appeared in this data set at about 8 years of age (3000 days). The same plateau was also noted by Raines et al. (Reference Scheffler, Buskirk, Rust, Cowley and Doumit2008) at 8 years of age and would explain the smaller slope of the relationship between age and ossification score when carcasses of greater maturity are assessed. Any small differences in the strength of either measure with eating quality would likely be outweighed by other factors such as cost and convenience in any one industry.
This result for the lesser maturity group shows that the strength of the relationship between these measures of maturity is not consistent over different maturity ranges. Other researchers have also expressed concerns over the ability for ossification score to act as a proxy for animal age across varying maturity ranges and diverse production systems within the United States (Field et al., Reference Field, Nelms and Schoonover1997; Lawrence et al., Reference Legrand, Hocquette, Polkinghorne and Pethick2001). Studies that find strong relationships between ossification score and age often source from relatively standard and consistent production systems (Shackelford et al., Reference Shorthose and Harris1995). In light of this uncertainty it is important to determine the most appropriate maturity measure for the prediction of eating quality across the European production environment.
Maturity measures and eating quality
Animal age had slightly greater magnitude of effect on MQ4 when all of the data was considered, giving the largest range in maturity. Likewise, the correlation coefficients also supported this general theme of age having a slightly stronger correlation with MQ4 when assessed across all the data, although these correlations were small and quite variable within individual muscles. Aligning well with our hypothesis, this trend was also evident when the group with greater maturity was assessed. Importantly, these results support the general theme of a negative relationship between animal maturity and eating quality (Bailey, Reference Bonny, Gardner, Pethick, Legrand, Polkinghorne and Hocquette1985), but also indicate the potential for animal age to be used as the indicator of this effect. Furthermore, they highlight that when assessing carcasses of greater maturity the utility of ossification score is limited since when ossification is completed at around 8 years of age, the maximum score of 590 is reached (USDA, Reference Verbeke, Van Wezemael, de Barcellos, Kügler, Hocquette, Ueland and Grunert1997).
Also aligning with our hypothesis ossification score had a greater magnitude of effect on eating quality than animal age for carcasses with lesser maturity. Indeed animal age was found to have no significant effect at all. This supports the notion that ossification score more closely relates to physiological maturity (Field et al., Reference Field, Nelms and Schoonover1997) and therefore age related decreases in eating quality (Bailey, Reference Bonny, Gardner, Pethick, Legrand, Polkinghorne and Hocquette1985). This finding is in contrast to the outcome for the greater maturity group where animal age was more strongly associated with eating quality than ossification, likely due to the insensitivity of ossification beyond 8 years of age. The lack of an age effect in the lesser maturity group is also supported by Field et al. (Reference Lawrence, Whatley, Montgomery and Perino1966) who concluded that animal age is not a significant determinant of eating quality in animals less than two years old. The correlation coefficients within the lesser maturity group partly supported these findings in that there was no significant correlation for age v. MQ4, yet there was also no correlation for ossification v. MQ4.
When the model including ossification score for the lesser maturity group was corrected for the phenotypic traits; carcass weight, hump height, marbling score and ultimate pH, ossification score no longer varied by carcass source country and/or sex. This may indicate that some of the variation in the relationship between MQ4 and ossification score is likely due to differences in the phenotype of the animals between countries and genders.
These phenotypic corrections also affected the model which included ossification score for the greater maturity group. When either carcass weight or eye muscle area were included in the model, ossification score was no longer significant. This is not entirely surprising given that weight and eye muscle area are both strongly correlated with maturity, hence they explain similar sources of variation in eating quality. This may also imply that age or ossification may therefore be of limited use in a processing environment that routinely collects carcase weight or eye muscle area.
Overall the results have shown that the best maturity measurement depends on the expected maturity of the cattle to be evaluated. Animal age would be more useful for predicting the eating quality of mature animals such as cull cows and bulls that are likely to reach the maximum ossification score. However, age would not be useful for young bulls, steers and heifers produced in a more conventional beef production system, with ossification score being a more suitable maturity measure. Additional information in populations where parity status was known and a greater volume of data on carcasses of advanced maturity would be needed to fully confirm this conclusion.
Conclusion
Delivering a price signal on eating quality is a good incentive for producers to deliver carcasses that have a better and more consistent eating quality. Maturity-related decreases in eating quality are estimated by either animal age or ossification score. The strength of the relationship between these measures and eating quality varies with different carcass maturity ranges. Ossification score is more appropriate for younger carcasses more commonly used for production, however for more mature animals, such as cull cows animal age becomes a more accurate predictor of eating quality. This indicates that a combination of animal age and ossification score would be required to adequately guarantee beef eating quality to consumers across the diversity of the European beef production system.
Acknowledgements
This research was supported by Meat and Livestock Australia and Murdoch University. Data were obtained through the financial contributions of the European research project ProSafeBeef (Contract No. FOOD-CT-2006-36241), the Polish ProOptiBeef Farm to Fork project funded by the EU Innovative (POIG.01.03.01-00-204/09), the French ‘Direction Générale de l’Alimentation’ and FranceAgriMer, the Irish Department of Agriculture Food and The Marine under the FIRM programme and the Northern Ireland Department of Agriculture and Rural Development ‘Vision’ programme. Furthermore, this project would not have been possible without the practical support of the Association Institut du Charolais, the Syndicat de Défense et du promotion de la Viande de Boeuf de Charolles and the gourmet restaurants ‘Jean Denaud’ and representatives of the beef industry across Europe. The international travel required for this project has been funded by ‘Egide/Fast’ funds from the French and Australian governments, respectively (project no. FR090054) and by ‘Egide/Polonium’ funds from the French and Polish governments, respectively. The assistance and participation the Beef CRC and Janine Lau (MLA, Australia), Alan Gee (Cosign, Australia), Ray Watson (Melbourne University, Australia) and John Thompson (UNE) are also gratefully acknowledged.