

In 2003, mental health illness was identified as the second highest burden of disease in children in Australia (Begg et al., Reference Begg, Vos, Barker, Stevenson, Stanely and Lopez2007), and it is likely that the incidence of these problems will continue to rise (Zubrick, Silburn, & Vimpani, Reference Zubrick, Silburn and Vimpani2000). Both family (see Maimon, Browning, & Brooks-Gunn, Reference Maimon, Browning and Brooks-Gunn2010; Ooi, Ang, Fung, Wong, & Cai, Reference Ooi, Ang, Fung, Wong and Cai2006) and school (e.g., Ross, Shochet, & Bellair, Reference Ross, Shochet and Bellaire2010) relationships have been shown to be implicated in mental health problems in young people; however, there are only a few studies that have investigated their combined influence on children's functioning.
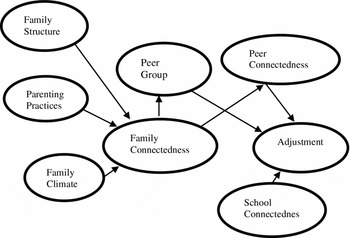
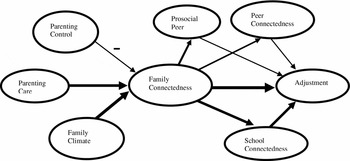
This article presents and tests a theoretical model of the associations between the important social systems of family, school and peers and their combined impact on children's adjustment. The theoretical model, labelled the Social Connectedness Model, is based on children's perceptions. The model indicates that parenting practices, family climate, and family structure predict family connectedness, and that family connectedness, in turn, predicts children's perceptions of connectedness to their peers and school. The model suggests that the combined influence of children's views of connectedness to family, school and peers on their adjustment is additive.
The relationships identified in the model are based on two theoretical perspectives: Bronfenbrenner's (Reference Bronfenbrenner1979) ecological framework and Bowlby's (Reference Bowlby1969) attachment theory, as well as reflecting current empirical evidence. Bronfenbrenner's (Reference Bronfenbrenner1979) ecological theory provides a framework for understanding the impact of non-familial influences on children's adjustment. Bronfenbrenner argued that if child development is to be properly understood, a mesosystemic approach is necessary in which multiple environments and their interactive effects on children are integrated. With respect to children, two of the most important environments after their family are their peer group (Gifford-Smith & Brownell, Reference Gifford-Smith and Brownell2003) and their school (Shochet, Dadds, Ham, & Montague, Reference Shochet, Dadds, Ham and Montague2006). Attachment theory stresses the importance of the parent-child bond in influencing children's capacity to develop meaningful relationships with others as they progress through life (Wilkinson, Reference Wilkinson2004), and this includes with peers and with school. Freeman and Brown (Reference Freeman and Brown2001) found that early attachment predicted peer relationships in adolescence; and Shochet, Smythe, and Homel (Reference Shochet, Smyth and Homel2007) found that parental attachment predicted school connectedness (i.e., ‘the extent to which students feel personally accepted, respected, included, and supported by others in the school social environment’ [Goodenow, Reference Goodenow1993, p. 80]) in a group of adolescents.
These two theoretical approaches, in concert with the literature discussed below, led us to postulate a model of relationships important to children's psychosocial adjustment as laid out in Figure 1. The following reviews the evidence on which this model is based and focuses on those social environments likely to have the greatest impact on children's functioning.
Theoretical model illustrating children's views of parenting practices, family climate, connectedness with family, peers, school, peer group type, their family structure, and the combined impact on adjustment.

Family Influences
Positive family relationships involving warm family interactions and appropriate control have been shown to promote the psychological wellbeing of children (see, e.g., Amato & Fowler, Reference Amato and Fowler2002). It has been established that parenting effectiveness is compromised when parents use too much psychological control, which reflects the attempt to control the child by regulating his/her emotions, opinions, and feelings (Barber, Reference Barber1996). Parental use of approaches that depend upon psychological control has been found to be negatively correlated with attachment to parents (van der Vorst, Engels, Meeus, & Deković, Reference van der Vorst, Engels, Meeus and Deković2006), and the model presented here posits that parental use of psychological control strategies will negatively contribute to children's sense of connection to their family, while affectionate interactions with parents will be positively associated with family connectedness. This is consistent with attachment theory which supports the continuity of attachment between parent and child (Baer, Reference Baer2002), partially on the basis of the continued use of sensitive parenting from those parents who develop good attachment relationships with their child in infancy.
Recent studies have demonstrated the relationship between family connectedness, defined as a sense of belonging and closeness to family members, and adolescent wellbeing (e.g., see Dwairy & Achoui, Reference Dwairy and Achoui2010; Houltberg, Henry, Merten, & Robinson, Reference Houltberg, Henry, Merten and Robinson2011). These studies, however, do not explore the mechanisms or pathways by which children's family experiences lead to a sense of family connectedness.
The model proposes that children's positive perceptions of parenting practices and family climate develops and maintains their overall sense of family connectedness. As with attachment, these perceptions reinforce children's internal working models of relationships and enhance their general level of functioning. In this sense, attachment and family connectedness are related constructs; however, family connectedness is viewed as an extension, or broader aspect of attachment which operates to influence children's positive psycho-social development as they mature and engage in wider social arenas.
The effect of family structure (i.e., children being raised in a one- or two-parent family/natural or step-family) on child adjustment has been the focus of a great deal of research. Some such as that by Walker and Hennig (Reference Walker and Hennig1997) have found that children in non-nuclear families experience more negative outcomes, while others have found no effect (e.g., Pike, Reference Pike2003). Walker and Henning argue that changes to family circumstances that result from parental separation impact negatively on parental functioning, making parents less available to provide effective parenting. We anticipate that children's perceptions of positive family relationships will be more important to child well being than family structure.
Peer Influences
Children's peers are also an important influence on children's development, with a large proportion of their social interactions involving peers by middle childhood (Gifford-Smith & Brownell, Reference Gifford-Smith and Brownell2003). This involvement continues to increase during adolescence (Hartup & Abecassis, Reference Hartup, Abecassis, Smith and Hart2002). Studies have concluded that attachment behaviour of adolescents can be directed towards non-parental figures, especially peers, and that secure attachments with peers acts as a supportive mechanism, buffering individuals against life's stressors (e.g., Buhrmester, Reference Buhrmester, Bukowski, Newcomb and Hartup1996). Baer (Reference Baer2002) stressed though, that during adolescence there is greater continuity than change in the quality of the parent-adolescent relationship. Some have argued that the family provides a consistent and stable setting for children's development, whereas peer and school influences are relatively transient (Ary, Duncan, Duncan, & Hops, Reference Ary, Duncan, Duncan and Hops1999). Wilkinson (Reference Wilkinson2004) proposed, as does the theoretical model presented here, that children's connection to their family predicts their connection to their peers and that both family and peer connectedness contribute to children's psychological adjustment.
Children's sense of family connectedness may influence the type of peer group with whom children identify. Studies have established that low levels of parent-child involvement are related to children associating with deviant peers and this association is related to an array of children's problem behaviours (Ary et al., Reference Ary, Duncan, Duncan and Hops1999; Fleming, Catalano, Haggerty, & Abbott, Reference Fleming, Catalano, Haggerty and Abbott2010). Thus, it is theorised that strong connection to family acts to influence children to associate with a prosocial peer group, and that this, in turn, enhances children's adjustment.
School Influences
A developing body of evidence suggests that children's perceptions of school connectedness are related to their adjustment outcomes (Blum & Libbey, Reference Blum and Libbey2004; Catalano, Haggerty, Oesterie, Fleming, & Hawkins, Reference Catalano, Haggerty, Oesterie, Fleming and Hawkins2004; Shochet et al., Reference Shochet, Dadds, Ham and Montague2006). For example, school engagement was found to be related to lower levels of emotional distress, and lower involvement in a range of problem behaviours (Blum & Libbey, Reference Blum and Libbey2004).
Carr-Gregg (Reference Carr-Gregg2000) stressed the importance of school engagement for children, and argued that schools should formulate policies that actively promote and encourage children's sense of school connectedness. McNeely, Nonnemaker, and Blum (Reference McNeely, Nonnemaker and Blum2002) established that positive classroom management climates, participation in extracurricular activities, tolerant disciplinary policies, and small school size were positively associated with higher school connectedness. When school interventions, specifically designed to enhance school connectedness for disaffected youth, were introduced this resulted in increased school commitment, better academic results, reduced school problems, and lower levels of violence, alcohol abuse, and risky sexual activity (Catalano et al., Reference Catalano, Haggerty, Oesterie, Fleming and Hawkins2004).
The work of Shochet and colleagues (Shochet, Homel, Cocksure, & Montgomery, Reference Shochet, Homel, Cocksure and Montgomery2008: Shochet et al., Reference Shochet, Smyth and Homel2007) has demonstrated the association between children's relationship with their parents and school connectedness. The proposed model reflects this relationship and posits that family connectedness leads to enhanced school connectedness, which, in turn, promotes children's adjustment.
Multiple Social Influences and Children's Development
Studies have suggested then, that children's perceptions of family connectedness influence their perceptions of peer connectedness (Wilkinson, Reference Wilkinson2004), peer group affiliation (Ary et al., Reference Ary, Duncan, Duncan and Hops1999; Guo, Hill, Hawkins, Catalano, & Abbott, Reference Guo, Hill, Hawkins, Catalano and Abbott2002), and school connectedness (Shochet et al., Reference Shochet, Smyth and Homel2007; Reference Shochet, Homel, Cocksure and Montgomery2008). As well, the research has indicated that peer connectedness (Buhrmester, Reference Buhrmester, Bukowski, Newcomb and Hartup1996; Van Ryzin, Gravely, & Roseth, Reference Van Ryzin, Gravely and Roseth2009), peer group affiliation (Ary et al., Reference Ary, Duncan, Duncan and Hops1999; Guo et al., Reference Guo, Hill, Hawkins, Catalano and Abbott2002), and school connectedness (Blum & Libbey, Reference Blum and Libbey2004; Catalano et al., Reference Catalano, Haggerty, Oesterie, Fleming and Hawkins2004) independently influence children's adjustment. Others have demonstrated an additive effect of family and peer influences (Wilkinson, Reference Wilkinson2004), and family and school influences (Fleming et al., Reference Fleming, Catalano, Haggerty and Abbott2010) on children's adjustment.
There are a small number of studies that have investigated the combined impact of family, school and peers on children's psychosocial outcomes. In one such study, Garnefski (Reference Garnefski2000) found that depressive symptoms had a strong independent relationship with negative perceptions of peers, while antisocial behaviour had a stronger relationship with negative perceptions of school. Limited information was gathered, however, as the family, school, and peer assessment measures consisted of only three items each and required only a yes or no response. Sameroff, Peck, and Eccles (Reference Sameroff, Peck and Eccles2004) investigated the relative contributions of family, peer, school and neighborhood factors to adolescents’ conduct problems. They found that all contexts but the neighborhood made a unique contribution to conduct problems. McGraw, Moore, Fuller, and Bates (Reference McGraw, Moore, Fuller and Bates2008) investigated family, peer, and school connectedness in a sample of older adolescents and found that connectedness to each of these domains was a protective factor against maladjustment and that peer connectedness was a strong predictor of wellbeing. Similarly, Witherspoon, Schotland, Way, and Hughes (Reference Witherspoon, Schotland, Way and Hughes2009) found that connection to any of the systems of family, school or neighbourhood was protective with respect to depression for adolescents.
These studies, however, have not suggested how the connectedness variables are interrelated. Although it is likely that peer, family, and school influences will impact in different ways on children compared to adolescents, this study will explore the overall relationships of social connectedness in the context of family, peers and school in older children and younger adolescents. The literature, then, does not provide clarity on the relationship between family connectedness, children's attachments to different social environments, and the individual and interactive impacts these bonds have on children's development.
The current article intends to address this gap by investigating the impact on children of their multiple social connections during the later childhood/early adolescent period of their development. It is proposed that children's perceptions of parenting practices and family climate and, to a lesser extent, their family structure, influence their sense of family connectedness, which in turn impacts on their psychosocial functioning. The model also posits that family connectedness influences children's perceptions of school and peer connectedness, as well as the type of peer group to which they belong, and that these variables have an additional and combined effect on their functioning. Finally, because of the contention around the importance of family structure to child outcomes, this variable was included in the model.
Method
Pilot Study
In order to establish the suitability and reliability of the instruments selected for this investigation, a pilot study was conducted in two phases. The first phase was focused on establishing the literacy demands of all items and to ensure that the time requirement was not too onerous. Feedback was received from 17 students across Years 6 to 10. One hundred and seventy-eight students, in Years 6 and 7 and Years 9 to 11, and 101 parents participated in the second phase of the pilot study. This phase involved testing modifications that were made to the scales, some of which emanated from the readability considerations of the initial phase. Some items were altered or deleted and some scales were recoded to improve discrimination and to ensure consistency of response options. Examination of the internal consistency of the modified instruments was undertaken in the pilot study and resulted in some further modifications to the instruments. All alterations to scales are described below in the Instruments section.
Main Study Participants
Data were collected from 563 students (360 females and 200 males, with three students’ gender not reported; aged 9 to 16.6 years) attending eight state schools in South East Queensland, Australia. Specifically, 205 students (130 females, 73 males; two students did not report their gender) enrolled in Years 6 and 7, 178 students (114 females, 63 males; gender of one student not reported) enrolled in Years 8 and 9, and 180 students (116 females, 64 males) enrolled in Years 10 and 11 were recruited to the study. Parents (178 females, 88 males) also provided data on the adjustment of 266 students.
The majority of children were from intact families (62.9%) with 21% from one parent families and 13.7% from step-families. Data were missing for 2.4% of the sample. The occupations of parents were spread across the occupational levels identified by the Australian Bureau of Statistics (ABS, 2001) in much the same proportions as the population; although fewer were reported to be unemployed (ABS statistics in brackets): Managers — 31.3% (39.2%); Tradespersons — 36.9% (32.4%); Intermediate workers — 12.1% (18.8%); unemployed 1.15 (8.6%); Home-duties or missing data — 18.6%.
Instruments
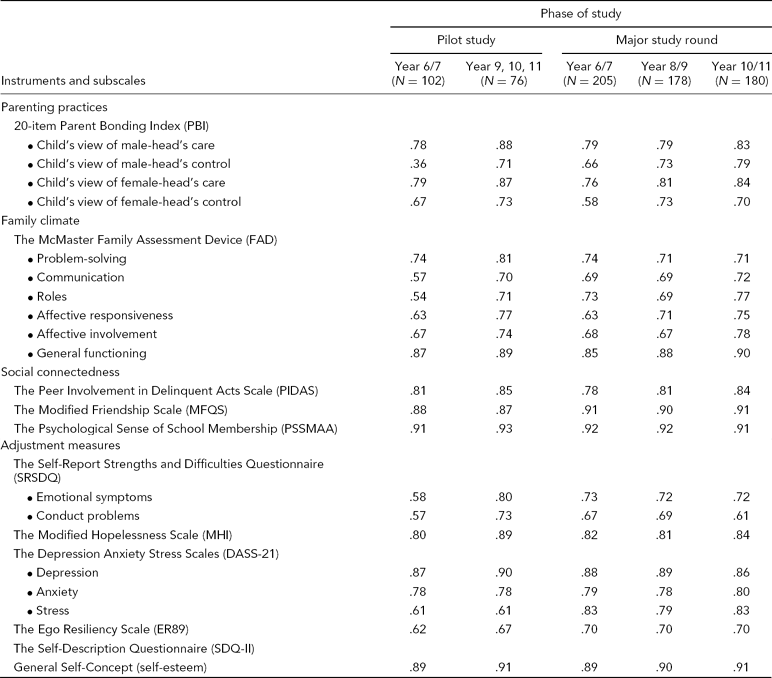
The instruments and their subscales are outlined below. In addition to the pilot study analysis, internal consistency was calculated for each of the three cohorts (Years 6/7, 8/9 & 10/11), the ages included in the study, to ensure the instruments were appropriate for students of varying age. Table 1 displays the internal consistency statistics for all instruments used in the study. As indicated below, some scales were recoded so that the direction of all scales completed by the students was consistent in order to assist children in their responding. That is, for all scales completed by the children, the left-hand choices indicated agreement and the right-hand choices indicated disagreement.
Reliability Analysis of Instruments and their Subscales
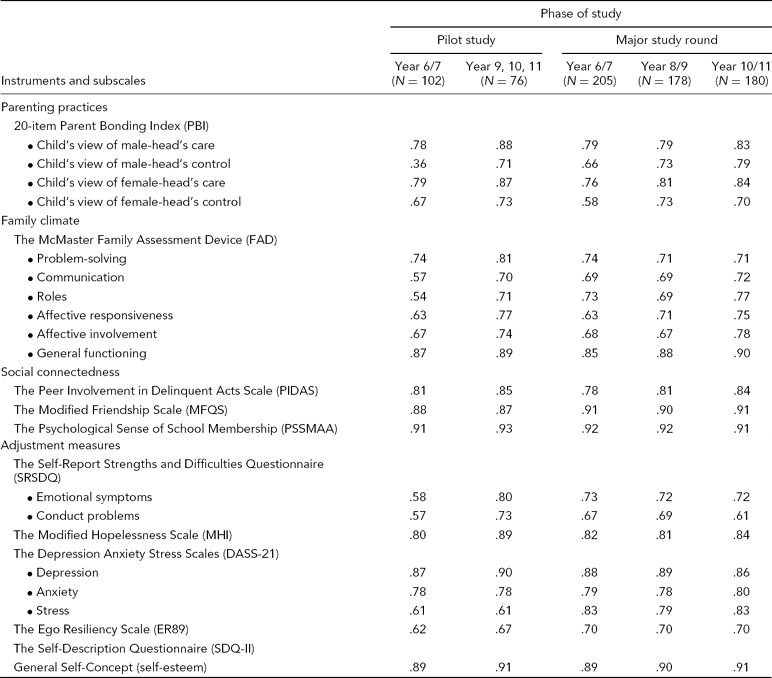
Note: The Child Behavior Checklist for Ages 6–18 reliability analysis is not included as its psychometric properties are well established.
Measures of Family Functioning
The 20-item Parental Bonding Index (Pedersen, Reference Pedersen1994) measures children's perceptions of parenting practices across two dimensions, Care and Control, and was used to measure children's perceptions of parenting practices. Responses are on a 4-point scale. Higher scores on the Care subscale indicate more care/affection; on the Control subscale, higher scores indicate less autonomy in decision-making (more psychological control). Children completed the items with respect to each parent individually (if applicable).
The McMaster Family Assessment Device (Epstein, Baldwin, & Bishop, Reference Epstein, Baldwin and Bishop1983) measures perceptions of family climate. Subscales include: Problem Solving, Communication, Roles, Affective Responsiveness, Affective Involvement, Behavioral Control, and General Functioning; however, Behavioral Control was found to have poor validity (Miller, Bishop, Epstein, & Keitner, Reference Miller, Bishop, Epstein and Keitner1985) and so was not used in this study. The students indicated their level of agreement with each statement on a 4-point scale. Scores used are the means for each subscale. A lower score on each subscale is indicative of increased family functionality. Internal consistencies of the Problem Solving and Communication subscales became acceptable after the removal of items 11 and 13 from the respective subscales.
Peer Connectedness Measures
The Security and Closeness subscales of the Friendship Qualities Scale (Bukowski, Hoza, & Boivin, Reference Bukowski, Hoza and Boivin1994) measure children's perceptions of emotional closeness to peers. Using a 5-point Likert scale, respondents indicate the extent to which each statement is true of them. All items are reverse scored and summed. Higher scores indicate greater connectedness with peers.
The Peer Involvement in Delinquent Acts Scale (PIDAS) was created using a modification of the Adapted Self-Report Delinquency Scale (Carroll, Durkin, Houghton, & Hattie, Reference Carroll, Durkin, Houghton and Hattie1996). The original scale assesses whether the respondent engages in delinquent behaviour. The current scale uses the two highest loading items for the factors: School Misdemeanors, Soft Drug Use, Stealing Offences, and Abuse of Property, and asks respondents to report if their friends have engaged in these behaviours in the last 12 months. Responses are collected on a 4-point Likert scale anchored by 1 = often and 4 = never. All items are reverse scored and summed. A low score is indicative of involvement with a prosocial peer group and a high score is indicative of association with an antisocial/delinquent peer group.
School Connectedness
The Psychological Sense of School Membership Amongst Adolescents (Goodenow, Reference Goodenow1993) measures the degree of school connectedness children experience. It comprises 18 items, scored on a 5-point Likert scale. A higher score indicates higher school connectedness.
Child Adjustment
Wellbeing
The Self-Report Strengths and Difficulties Questionnaire (Goodman, Reference Goodman1997) is a behavioural screening instrument for 4- to 16-year-old children comprising five subscales of which only the Emotional Symptoms and Conduct Problems were used in this study. The Hyperactivity subscale duplicated items in other measures, the Peer Problems subscale had poor internal consistency with our sample, and Prosocial Characteristics had been determined to make no contribution to psychological difficulties (Goodman). To increase separation of responses, it was modified from a 3-point to a 4-point Likert-scale. As one of the items in the Conduct Problems subscale consisted of two different statements (‘I fight a lot’; ‘I can make other people do what I want’), the statements were separated. The scores of the two subscales are summed to generate a Total Difficulties score. A higher score for each subscale is indicative of more adjustment problems.
The 20-Item Hopelessness Instrument (Beck, Weissman, Lester, & Trexler, Reference Beck, Weissman, Lester and Trexler1974) was modified for the present study to include only the three positively and three negatively phrased statements that were most highly correlated with the total score. As the original Hopelessness Instrument used a true or false response format, in order to provide more discrimination, the instrument was adapted so that children responded to a 4-point Likert scale. Appropriate items are reverse scored and all items are then summed. A higher score is indicative of more hopelessness regarding the future.
The 21-Item Depression Anxiety Stress Scales (Clara, Cox, & Enns, Reference Clara, Cox and Enns2001) is a short version of the Depression Anxiety Stress Scales (DASS; Lovibond & Lovibond, Reference Lovibond and Lovibond1995) and measures overall adjustment, depression, anxiety, and stress. In response to feedback from the pilot study, the responses were simplified and recoded so that the anchoring of the response items were consistent with the other scales included in the student questionnaire (e.g., ‘applied to me to some degree or some of the time’ was changed to ‘some of the time’). Pilot study data revealed that removing Item 1 (Stress subscale) improved the internal consistency of that scale and so it was eliminated. Refer to Table 1 for resultant alphas. Alphas were satisfactory for the Depression and Anxiety subscales. Eliminating item 1 resulted in acceptable alpha coefficient for the Stress subscale. A higher score is indicative of more problems.
Ego Resiliency
The Ego Resiliency Scale (Block & Kremen, Reference Block and Kremen1996) is a measure of resilience, and consists of 14 items. To ensure consistency across other scales responses were anchored from 1 = very true of me to 4 = not at all true of me. Item 14 was removed to improve the internal reliability of the scale. A higher score indicates increased Ego Resiliency, whereas a lower score means increased ego-brittleness.
Self-Esteem
The Self-Description Questionnaire (Marsh, Reference Marsh1990) was designed for students in Years 7 through to 12, and includes a general self-concept scale (General Self-Scale) consisting of 10 items, which was used in this study. In order for the scale to be anchored in the same direction as the other scales, the responses were recoded and anchored from 1 = true to 6 = false. A higher score is indicative of higher self-esteem.
The Child Behavior Checklist for Ages 6–18 (CBCL/6–18; Achenbach & Rescorla, Reference Achenbach and Rescorla2001) enables parents to rate children's adjustment on a range of measures that can be grouped into either Internalising or Externalising syndromes. Parents rate each item as 0 = not true, 1 = somewhat or sometimes true, 2 = very true or often true. To score the CBCL/6–18, item scores for each dimension are summed. A Total Problem score is also computed by summing the individual scores across all dimensions. A higher score is indicative of more adjustment problems. This measure was completed by parents.
Independent and Dependent Variables
The independent variables used in the current study were: Parenting Care and Control; Family Climate; Pro- or Anti-Social Peer Group Membership; Peer Connectedness and School Connectedness. Of these, Self-reported Delinquency, Peer Connectedness and School Connectedness were also tested in the model as mediators.
The dependent variables were measures of students’ adjustment as supplied by students’ self-reports and by the students’ parents. The self-report measures of adjustment were the composite measure of Well Being, Ego Resiliency and Self-Esteem. The parents’ reports of student adjustment were taken from the Internalising, Externalising and Total Problems scales of the Child Behavior Checklist.
Procedure
Ethical approval for the study was provided by The University of Queensland's Ethics Board, and Education Queensland. Eight schools (three primary) were approached to participate in the study and all agreed. They were distributed across two urban areas in South East Queensland and were chosen to represent a range of socio-economic status (SES) regions using the school's Index of Relative Socio-Economic Disadvantage (IRSED). The IRSED rates schools on their level of disadvantage, based on mapping student enrolment data to social and economic factors supplied by the Australian Bureau of Statistics (Byrne, Reference Byrne2001). According to this rating, four schools were in a high SES area and four in a low SES area.
As the children are considered minors by law, written permission for their involvement was first sought from their parents, and then the children themselves. Random draw prizes were offered as incentives to participating students. Upon completion of the student scales, students were asked to take home the CBCL, which parents completed and returned by post. In two-parent families, parents were asked to collaborate and give an agreed response. Data were collected from students in class groups during school time.
Data Reduction and Analysis
In order to simplify the analysis, the number of variables as described in Table 1 (predicted to be indicators for particular factors) were reduced by combining them. Holmes-Smith (Reference Holmes-Smith2000) recommended that when indicator measures are considered parallel, that is, when they have similarly weighted loadings to each factor, new composite measures can be created. Children had been asked to report on their mothers and fathers separately when completing the Parental Bonding Index (subscales labeled Parent Control and Parent Care); however, for the analysis in order to ensure the largest number of respondents, each child received one parenting score (in those cases where reports on two parents were included, an averaged score was created). Problem Solving and Communication were combined to form a new composite variable, Family Processes; Affective Involvement and Affective Responsiveness were combined to form a new composite variable, Family Affection; and Stress, Depression, Anxiety, Emotional Symptoms, Conduct Problems, and Hopelessness were combined to form a new composite variable, Well Being. Factor analyses were used to investigate the validity of the proposed relationships.
Multiple regression was then conducted to acquire an understanding of the overall relationships depicted in the model. As the theoretical model suggested that Peer and School Connectedness, and Peer Group mediate the impact of Family Connectedness on children's Adjustment, these mediation effects were also statistically examined. The minimum significance level for all statistical tests was set at .05. The effectiveness of the model was also analysed by comparing adjustment ratings of children as supplied by themselves, and their parents.
Results
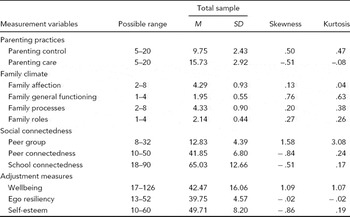
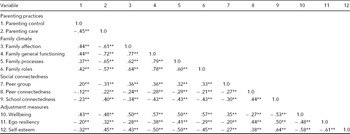
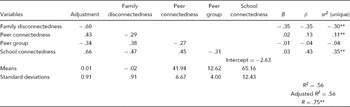
Table 2 displays the descriptive information for the total sample. The correlation matrix for the variables is provided in Table 3. All correlations are significant at the p < .01 level and demonstrate the expected direction of the relationships between the variables of interest. It was established that higher levels of Parental Control were related to lower levels of Well Being, Ego Resiliency and Self-Esteem.
Total Sample: Ranges, Means, Standard Deviations, for the Measured Variables

Note: 1. Depending on the variable, N varies between 559 and 563.
2. Affective Involvement and Affective Responsiveness were combined to form a new composite variable, Family Affection.
3. Problem-solving and Communication were combined to form a new composite variable, Family Processes.
4. Stress, Depression, Anxiety, Emotional Problems, Conduct Problems, and Hopelessness were combined to form a new composite variable Wellbeing, where a lower score indicates better functioning.
Students’ Reports: Correlation Matrix for the Measurement Model Variables for Total Year 6 to 11 Sample

Note: **p < .01 (two-tailed).
1. As some variables were non-normally distributed, values calculated using Spearman's rho. N varies between 559 and 563 responses.
2. A higher score for the variables parenting care, peer connectedness, school connectedness, ego resiliency and self-esteem indicate increased functionality. For the remaining variables, a higher score indicates decreased functionality.
Gender, Age and Socioeconomic Influences
Prior to investigating the associations between the variables of interest, we examined the possible confounds of age, gender and socioeconomic area on the outcome variables of child self-reported Well Being, Ego Resiliency and Self-Esteem using 2 × 3 × 2 (Gender by Year Cohort by Socioeconomic Area) MANOVA. Socio-economic groups were based on IRSED cut offs. Unless otherwise indicated, for all MANOVAs, the Wilk's approximation of F is reported. The year cohorts of Years 6/7, 8/9 and 10/11 were used as an indicator of students’ ages. Socioeconomic influences on children's adjustment were analysed by contrasting the data from students who attended schools located in diverse socioeconomic areas. Schools were coded as belonging to either a high (HSA), or low (LSA) socioeconomic area and resulted in the following sample sizes: Year 6/7, HSA = 106, LSA = 99; Year 8/9, HSA = 168, LSA = 10; and for Year 10/11, HSA = 86 and LSA = 94. These sample sizes indicate a range of responses were gathered from students attending schools located in different socioeconomic classifications, however for the Year 8/9 cohort, the sample is mainly derived from a school located in a high socioeconomic area.
There were no significant multivariate effects, indicating that children's adjustment was not significantly affected by any two- or three-way interaction effects; Gender by Year Cohort: F(6, 1092) = 1.31, p = .25; Gender by Socioeconomic Area: F(3, 546) = 1.71, p = .16; Year Cohort by Socioeconomic Area: F(6, 1092) = 1.84, p = .09; Gender by Year Cohort by Socioeconomic Area: F(6, 1092) = 1.42, p = .20. There were also no significant main effects for Gender, F(3, 546) = 2.19, p = .09; Year Cohort, F(6, 1092) = 0.61, p = .72; or Socioeconomic Area, F(3, 546) = 1.81, p = .14.
The Levene test of homogeneity was significant for Well Being, indicating that the error variances of this dependent variable were dissimilar for the different groups. A non-parametric analysis was conducted using the Kruskal-Wallis test to further investigate any mean differences in Well Being as a function of each of the three independent variables. For the Year 6/7 cohort, wellbeing was significantly affected by Socioeconomic Area, χ2(1) = 5.39, p < .05. Those students in Years 6/7, who attended the school located in a lower socioeconomic area, reported lower levels of Well Being. As this was the only effect for these demographic variables, they were not considered in further analyses.
Relationships between the Measured Variables and the Proposed Factors
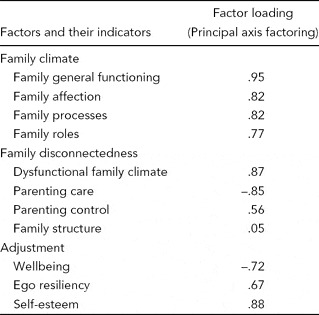
Factor analysis was performed to establish the validity of the factors based on their indicator variables. Due to the way the indicators loaded onto Family Connectedness it was relabelled Family Disconnectedness. Principal axis factoring with varimax rotation was used and the extracted factors and the factor loadings are displayed in Table 4. All the indicators loaded well on their respective factors, except family structure.
Established Factors, and Factor Loading, Using Principal Axis Factoring

Notes: 1. Family climate saved as a variable from first factor analysis.
2. Family Structure is dummy coded 0 = nuclear families (N = 348), and 1 = non-nuclear families (N = 202).
Prediction of Adjustment
Using the data from the children's reports, a sequential multiple regression was conducted to investigate whether the addition of information regarding Peer and School Connectedness, and Peer Group improved prediction of Adjustment beyond that afforded by Family Disconnectedness. The four predictors were entered in the following sequence: Family Disconnectedness, Peer Connectedness, Peer Group, and School Connectedness. Using p < .001 criterion for Mahalanoibis distance checks, nine multivariate outliers were identified and deleted from the data set leaving N = 549. Table 5 displays the results of the regression analysis.
Standard Multiple Regression of Family, Peer and School Variables on Adjustment after all Four Independent Variables Entered (N = 549)

Note: **p < .01.
The dependent variable is adjustment based on children's views and derived by factor analysis.
R was significantly different from zero after each step. After the final step, with all four independent variables entered R = .75, R2 = .56, F(4, 544) = 172.50, p < .01. After step one, with Family Disconnectedness entered R = .60, R2 = .36, F(1, 547) = 310.37, p < .01. After step two, with Peer Connectedness entered with Family Disconnectedness R = .66, R2 = .43, F (2, 546) = 208.25, p < .01. After step three, with Peer Group entered with Family Disconnectedness and Peer Connectedness R = .66, R2 = .44, F(3, 545) = 141.90, p < .01. Referring to the semipartial correlations (when all variables were entered) all the independent variables, except Peer Group, uniquely contributed to the prediction of adjustment.
Mediation Effects
Peer Connectedness, Peer Group, and School Connectedness were analysed, in turn, to investigate whether they mediated the impact of Family Disconnectedness on Adjustment. The procedure for testing mediation as outlined by Baron and Kenny (Reference Baron and Kenny1986) was followed. Additionally, the significance of the indirect effect of the independent variable on the dependent variable via the mediator was tested using the formula provided by Sobel (Reference Sobel and Leinhart1982). Unless otherwise stated, the indirect effects of the relationships explained below were found to be significant at the .05 level. It was established that Peer and School Connectedness, and Peer Group partially mediated the impact of Family Connectedness on Adjustment.
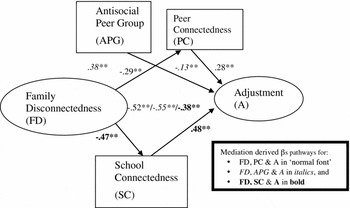
For Peer Connectedness, equation 1: F(1, 547) = 49.06, p < .001; equation 2: F(1, 547) = 310.37, p < .001; and equation 3: F(2, 546) = 208.25, p < .001. The effect of Family Disconnectedness on Adjustment was less in equation 3 (β = –.52) compared to equation 2 (β = –.60). For Peer Group, equation 1: F(1, 547) = 92.65, p < .001; equation 2: F(1, 547) = 310.37, p < .001; and equation 3: F(2, 546) = 165.31, p < .001. The effect of Family Disconnectedness on Adjustment was less in equation 3 (β = –.55) compared to equation 2 (β = –.60)]. For School Connectedness, equation 1: F(1, 547) = 151.08, p < .001; equation 2: F(1, 547) = 310.37, p < .001; and equation 3: F(2, 546) = 325.92, p < .001. The effect of Family Disconnectedness on Adjustment was less in equation 3 (β = –.38) compared to equation 2 (β = –.60).
Final Model
The results reported above provide good empirical support for the theoretical model, when children's reports were used. The final model is illustrated in Figure 2. The standardised regression coefficients reported in this model are derived from the mediation testing analyses. Every pathway depicted in Figure 2 is significant at p < .01, and demonstrates the expected relationships. The factor Family Disconnectedness predicts membership of an Antisocial Peer Group, Peer Connectedness, and School Connectedness, and all four variables predict Adjustment. These relationships indicate that as children's perceptions of family disconnectedness decrease they are more likely to identify with a prosocial peer group, and report higher levels of peer and school connectedness. The mediation testing outlined in the previous section, demonstrates that Peer Connectedness, School Connectedness and Peer Group Type partially mediated the impact of Family Disconnectedness on children's adjustment. That is, the predictor variables had a combined, additive, and positive influence on adjustment.
Model derived from factor analysis and mediation testing for the total sample illustrating children's sense of connectedness to family, peers, and school and their adjustment.
Note: **p < .01.
1. The variables Peer Group, Peer Connectedness, and School Connectedness are illustrated in rectangles, as they are measured variables, whereas the variables Family Disconnectedness and Adjustment are illustrated in ovals as they are derived from indicators and saved as factors.
2. Pathway values are standardised regression coefficients (βs)derived from mediation testing.

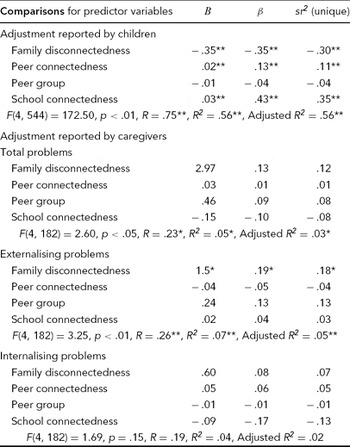
As displayed in Table 5, the analysis indicates that Family Disconnectedness, Peer Connectedness, and School Connectedness uniquely contribute to predicting Adjustment. The model was also tested using parents’ reports of children's adjustment where the dependent variables were parents’ views of Externalising, Internalising and Total Problems from the CBCL. The same predictors as were used in the analysis reported above, were used in this analysis. The results are displayed in Table 6.
Comparisons of Standard Multiple Regressions for Children's Reports of Connectedness and Peer Group Affiliation on Children's Adjustment Where Adjustment is Reported By Children and Caregivers

Note: *p < .05; **p < .01.
1. For children, N = 548; for caregivers, N = 186.
As shown in Table 6, when children reported on their adjustment, 56% of the variability in adjustment was predicted by their views of family, peers, and school connectedness and peer group type. However, when parents reported on children's adjustment the model explained respectively, 7%, 4%, and 5% of the variability in Externalising, Internalising and Total Problems.
Discussion
The focus of this article was to investigate how children's sense of family connectedness influences their connectedness to other important social spheres, and how these perceptions affect their general psychological functioning. A theoretical model was proposed and empirically tested using a sample of students in Years 6 to 11. The Social Connectedness Model (refer to Figure 3) was empirically supported by children's reports of their adjustment, explaining 56% of the variance. While the parental data was significant, it explained only a small amount of the variance in children's adjustment. With the exception of the relationship between Family Structure and Family Connectedness, the tested model supports the proposed model. Second, the original construct ‘parenting practices’ is now illustrated as two separate variables: Parenting Control, and Parenting Care, as these variables loaded in opposite directions on the predicted factor of Family (Dis)connectedness.
The Social Connectedness Model, illustrating the relationships between children's perceptions of family functioning, family, peer, and school connectedness, identification with a prosocial peer group, and children's adjustment.
Note: 1. Parenting Practices is represented by Parenting Control and Parenting Care.
2. For all factors, a higher score indicates more positive functioning, except Parenting Control, where a higher score indicates less positive functioning.
3. All relationships are significant at the .01 level, and stronger relationships are accentuated.
4. For the total sample: Years 6 to 11, N = 563.

The Social Connectedness Model provides a sound framework for understanding the central importance of a strong sense of family connectedness and the part this plays in strengthening young people's connections to other social groups. These multiple social environments have a combined influence in promoting children's psychosocial wellbeing. Children who have a strong sense of family connectedness are more likely to be positively connected with school and peers, and to identify with prosocial peers, and these relationships amalgamate to promote children's adjustment. The overall relationships were not influenced by family structure. The socioeconomic location of the school did impact on children's wellbeing, with students who attended schools located in lower socioeconomic areas reporting lower levels of wellbeing.
The amount of variation explained by the model was higher when children were reporting on the predictor variables and their own adjustment than when parental adjustment ratings comprised the outcome variable. The independent measure of children's adjustment, as provided by parents who reported on children's externalising, internalising and total problems, accounted for only 4–7% of the variance in the model. The difference in the variance explained may be due to parents being less aware of any internalising problems experienced by children, to child effects, or to shared method variance.
The centrality of the parent–child relationship and the importance to this relationship of parental care and affection and appropriate control (Amato & Fowler, Reference Amato and Fowler2002) is reaffirmed by the results of this study. Well functioning families provide an environment conducive to the development of family connectedness, which was found to predict children's healthy adjustment. Children who were disengaged from their families had poorer adjustment, findings that are reflected in other studies (e.g., Shochet et al., Reference Shochet, Homel, Cocksure and Montgomery2008).
Family, school and peer connectedness, in addition to having a combined impact, were found to independently influence adjustment. Family and school connectedness had the greatest, and an approximately equal, unique association with adjustment. The finding that school connectedness influences children's emotional functioning adds to the literature which has reported this relationship (Blum & Libbey, Reference Blum and Libbey2004; Catalano et al., Reference Catalano, Haggerty, Oesterie, Fleming and Hawkins2004; Shochet et al., Reference Shochet, Dadds, Ham and Montague2006), and further contributes by indicating a possible pathway commencing with children's perceptions of family dynamics, leading to family connectedness then school connectedness.
As the established model suggests that family connectedness predicts both school and peer connectedness, these relationships are consistent with those studies which have suggested that children who are well attached to their parents are more able to form positive social relationships with others (Sturgess, Dunn, & Davies, Reference Sturgess, Dunn and Davies2001; Wilkinson, Reference Wilkinson2004). The study, therefore, provides support for the view that family connectedness is the foundation of social connectedness for older children and adolescents and, in this role, provides the basis for effective adjustment.
School connectedness was found to have a stronger association with children's functioning than did either their connectedness to their peers or the type of peer group with which they aligned. This was somewhat surprising, but may be explained in terms of the ecological framework, as children's experiences of school provide them with an enhanced opportunity to develop within a broader, more consistent, and more enduring social environment compared to that provided by their friendship networks alone. This may be particularly so for the younger children in the sample, as their peer relationships are likely to be more unstable than those of adolescents (Poulin & Chan, Reference Poulin and Chan2010). Unfortunately, this level of analysis was not able to be undertaken in this paper, but is worthy of investigation in the future.
It was established that when children reported family disconnectedness they were more likely to identify with antisocial peers as found by Garnefski (Reference Garnefski2000). As a mediator, peer group type had a minor negative impact on children's adjustment, and did not uniquely contribute to adjustment. The relationships suggest that the emotional bonds children form with peers are more important than the type of peer group with whom they associate.
As school connectedness and peer connectedness uniquely predicted children's adjustment, these relationships indicate how those non-familial social environments can have a positive, compensatory impact on children's emotional functioning. This suggests that schools would benefit their students by formulating procedures designed to enhance the student-school bond. Those school-based interventions that have specifically focused on these have resulted in improvements in children's general functioning (Catalano et al., Reference Catalano, Haggerty, Oesterie, Fleming and Hawkins2004). Schools, then, seem to be in a position to provide a protective buffer for those children who are experiencing some level of disconnection from their families.
Establishing a model that indicates the importance of social connectedness is a useful basis for the development of interventions, and the present study has made a contribution in this regard. Evidence shows that for every dollar invested in prevention and early intervention programs there can be a seven-fold increase in benefits by the time the children become adults (Social Inclusion in the Australian Government, 2009). Rowe and Stewart (Reference Rowe and Stewart2009) have shown that school connectedness can be encouraged by a range of activities. Social connectedness is a somewhat broader construct as it requires young people, families, teachers, and the community to work together; nevertheless, the promising work of Rowe and Stewart, alongside this work, suggest that there are methods available for promoting these important connections. This focus on the interaction of multiple social environments contributes to the specification of Bronfenbrenner's (Reference Bronfenbrenner1979) ecological model in demonstrating the impact of interactions at the mesosystemic level on young people's functioning.
The findings of the present study provide support for the influence of school-wide approaches on social connectedness as a key dimension. Schools that create environments rich in social capital have a strong capacity to foster social connectedness.
Limitations
It would have been useful to utilise structural equation modeling to investigate the robustness of the theoretical model we had proposed; however, the number of participants meant that this procedure was not available to us. There are other variables, not included in this study, that have been shown to contribute to student psychological outcomes, including, for example, academic success (Wang & Algozzine, Reference Wang and Algozzine2011) and extra-curricular involvement (van de Wetering, van Exel, & Brouwer, Reference van de Wetering, van Exel and Brouwer2010). Aspects of family demography, such as position in family and number of siblings, may play an important role in connectedness to family and peers and were not included in this study. These omissions are likely to contribute to the unexplained variance in the model, and future research should consider their contribution. In addition, all the participants in this study came from government schools; however, there is some evidence that the school sector influences school connectedness and its outcomes (Waters, Cross, & Shaw, Reference Waters, Cross and Shaw2010). Random sampling of schools would also strengthen the capacity to generalise results and is recommended for future research. The findings of the study would also be enhanced by utilising a longitudinal design, which would investigate how changes in familial and non-familial connectedness impacts on children's adjustment.
The data gathered for this study were all collected at the same time, and, with respect to the model presented, were all collected from the same informants. The direction of influence, therefore, may be different from that proposed. It is possible, for example, that the disaffection felt by children who were poorly adjusted negatively influenced their view of their parents and peers. Only prospective studies can provide certainty with respect to causal pathways.
Of most importance is the failure of the model to adequately explain a reasonable amount of the variance associated with parental reports of adjustment. This, in part, is likely to reflect the complexity of the construct of adjustment, and the difficulties of capturing the essential qualities of a constantly changing social system. The issue of shared variance is also a contributor here — children provided all the information — the predictors and the outcome measure, in the successful model. The study does make clear, however, the importance of collecting information from children if we wish to understand their situation — parents and children see things differently.
The discrepancy between child and parent predictions of adjustment indicates an area that requires further investigation. As indicated above, the established model applies to children's perceptions; establishing a better understanding of parental views and the contributions to differences between child and parental perceptions would be most helpful.
Conclusion
The study has provided an important explanation of how young people's perceptions of family processes and connectedness to familial and non-familial social environments influence their general functioning. Family connectedness directly impacts on children's functioning and influences children's abilities to connect with other important social environments, of which the family and the school were found to have the greatest impact. Moreover, The Social Connectedness Model provides a strong theoretical explanation of how the factors are interrelated and provides a useful tool for guiding future theoretical developments, when children's views of their adjustment are at issue.
The model has stronger applicability to children's perceptions of their own functioning than it does to parent's perceptions of children's adjustment. Previous studies have established that children's adjustment is more closely related to their own perceptions of family processes and events, rather than the perceptions of significant others (Sturgess et al., Reference Sturgess, Dunn and Davies2001) and that children perceive and report family processes and events differently from those of their parents (Neiderhiser, Pike, Hetherington, & Reiss, Reference Neiderhiser, Pike, Hetherington and Reiss1998). The findings underscore the importance of collecting information directly from children and adolescents when attempting to understand the contributors to their psychosocial adjustment.