Introduction
Fundamental to the fields of paleontology, evolutionary biology, and conservation biology is the phenomenon of extinction. Differential rates of extinction result in heterogeneity in the longevity of taxa across clades and through time (McKinney Reference McKinney1997; Jablonski Reference Jablonski2008a). The fossil record is an indispensable source of information on how past species responded to extinction pressures, with implications for understanding the extinction risk faced by species today (Harnik et al. Reference Harnik, Lotze, Anderson, Finkel, Finnegan, Lindberg, Liow, Lockwood, McClain, McGuire, O'Dea, Pandolfi, Simpson and Tittensor2012). It provides a detailed framework for exploring whether certain environmental, biological, and/or ecological traits can be identified as universal predictors of extinction risk, or whether the role of certain traits varies across clades and through time. A number of factors have been linked to extinction selectivity in the fossil record across many clades, such as geographic range size (e.g., Payne and Finnegan Reference Payne and Finnegan2007; Powell Reference Powell2007; Jablonski Reference Jablonski2008a; Foote et al. Reference Foote, Crampton, Beu and Cooper2008; Harnik et al. Reference Harnik, Fitzgerald, Payne and Carlson2014) and niche breadth (Kammer et al. Reference Kammer, Baumiller and Ausich1997, Reference Kammer, Baumiller and Ausich1998; Liow Reference Liow2007; Heim and Peters Reference Heim and Peters2011; Nurnberg and Aberhan Reference Nurnberg and Aberhan2013; Smits Reference Smits2015), as well as factors that are more taxon specific, such as larval dispersal in mollusks (Hansen Reference Hansen1978; Gilli and Martinell Reference Gili and Martinell1994; Jablonski and Hunt Reference Jablonski and Hunt2006). Other factors have variable effects in different taxonomic groups, such as body size (Jablonski Reference Jablonski, Jablonski, Erwin and Lipps1996; Harnik Reference Harnik2011; Tomiya Reference Tomiya2013) and morphologic variation/complexity (Villier and Korn Reference Villier and Korn2004; Liow Reference Liow2004, Reference Liow2006; Hopkins Reference Hopkins2011; Kolbe et al. Reference Kolbe, Lockwood and Hunt2011). Many of these traits have also been implicated in increased extinction risk of modern species (Purvis et al. Reference Purvis, Gittleman, Cowlishaw and Mace2000; Thomas et al. Reference Thomas, Cameron, Green, Bakkenes, Beaumont, Collingham, Erasmus, De Siqueira, Grainger, Hannah and Hughes2004).
When investigating extinction selectivity, there are two notable sources of potential error. First, many biological traits may covary and/or be governed by the same underlying mechanisms. Failing to account for potential relationships among variables may result in spurious interpretations of the complex, interacting processes driving extinction selectivity (Wootton Reference Wootton1994; Jablonski Reference Jablonski2005). A number of studies have attempted to tease apart the effects of interacting factors using multivariate linear regression (e.g., Liow Reference Liow2007; Crampton et al. Reference Crampton, Cooper, Beu, Foote and Marshall2010; Harnik Reference Harnik2011; Hopkins Reference Hopkins2011; Harnik et al. Reference Harnik, Fitzgerald, Payne and Carlson2014), but the relative contribution of multiple variables on taxonomic duration has rarely been quantified. Second, phylogenetic effects can play a role in extinction selectivity and/or confound the apparent signal of other variables (Green et al. Reference Green, Hunt, Wing and DiMichele2011; Smith and Roy Reference Smith and Roy2006; Purvis Reference Purvis2008; Fritz and Purvis Reference Fritz and Purvis2010; Soul and Friedman Reference Soul and Friedman2017; Congreve et al. Reference Congreve, Falk and Lamsdell2018). Taxic approaches cannot fully account for shared evolutionary history among closely related taxa, and most incorrectly treat taxa as phylogenetically independent units. As a result, the value of incorporating explicit phylogenetic hypotheses into studies of extinction selectivity using comparative methods has been recognized in recent years (e.g., Friedman Reference Friedman2009; Hopkins Reference Hopkins2011; Harnik et al. Reference Harnik, Fitzgerald, Payne and Carlson2014; Puttick et al. Reference Puttick, Kriwet, Wen, Hu, Thomas and Benton2017; Field et al. Reference Field, Bercovici, Berv, Dunn, Fastovsky, Lyson, Vajda and Gauthier2018).
Here, I use the fossil record of diplobathrid crinoids to (1) assess the effects of multiple factors on extinction selectivity, both with and without phylogenetic nonindependence taken into account, and (2) determine the relative contribution of biological and ecological traits to diplobathrid genus duration. Diplobathrids are a model group for this study, because they have an extensive stratigraphic range (Late Ordovician [Floian] to Upper Mississippian [Serpukhovian]), a well-sampled fossil record (Cole Reference Cole2017), and a well-resolved phylogeny that is nearly comprehensive at the genus level, including 100 genera (Cole Reference Cole2018). In addition, many aspects of crinoid ecology can be extracted from skeletal features that readily preserve in fossil specimens, facilitating investigation of the role ecology played during their evolutionary history (Cole et al. Reference Cole, Wright and Ausich2019). Traits investigated were body size, species richness, niche breadth, density of the filtration fan, and food size selectivity. To identify significant correlations between these traits and the duration of diplobathrid genera in the fossil record, I employed multiple linear regression, which accounts for covariation between variables without phylogenetic context, and phylogenetic generalized least squares, which takes phylogenetic relationships of the study taxa into account. I calculated phylogenetic signal to explore the degree to which characters are phylogenetically structured, and calculated Cohen's f 2, a measure of effect size, to determine the relative contribution of variables to diplobathrid duration and to compare the influence of variables on duration among groups. Using these approaches, the following key questions were addressed concerning extinction selectivity and genus duration in diplobathrid crinoids: (1) What are the significant predictors of extinction? (2) What are the relative contributions of those predictors? (3) Do ecological traits, such as habitat preference and ecomorphologic variation, play a significant role in genus longevity? (4) How does incorporating phylogenetic structure affect interpretations of extinction selectivity?
Trait Selection and Crinoid Ecology
The first three traits investigated in this study—body size, species richness, and habitat preference/niche breadth—were chosen because they have been identified as notable correlates of extinction from previous studies. As a result, one goal of this study was to determine whether the correlations of these traits with extinction would hold true for diplobathrid crinoids. For example, significant correlations between body size and extinction risk have been documented for many vertebrate groups (Gaston and Blackburn Reference Gaston and Blackburn1997; Friedman Reference Friedman2009; Tomiya Reference Tomiya2013; Lyons et al. Reference Lyons, Miller, Fraser, Smith, Boyer, Lindsey and Mychajliw2016), but body size is not consistently correlated with extinction risk in invertebrates (e.g., Lockwood Reference Lockwood2005; Harnik Reference Harnik2011). Likewise, it has been recognized that species richness corresponds to the persistence of higher taxa (Jablonski Reference Jablonski1991; McKinney Reference McKinney1997), but few studies have tested this correlation explicitly. Niche breadth has also been investigated for multiple vertebrate and invertebrate groups; taxa with greater niche breadth (i.e., generalist taxa) generally have been found to have increased taxonomic longevity (Baumiller Reference Baumiller1993; Liow Reference Liow2007; Nurnburg and Aberhan Reference Nurnberg and Aberhan2013; but see Colles et al. [Reference Colles, Liow and Prinzing2009] for a more detailed review). In this study, niche breadth is measured as a function of habitat preference, which is thought to represent a major environmental control on the distribution of different crinoid groups (Kammer et al. Reference Kammer, Baumiller and Ausich1997, Reference Kammer, Baumiller and Ausich1998).
The other two traits investigated—filtration fan density and food size selectivity—were included because they reflect ecologically significant traits by which crinoids partition niches (Ausich Reference Ausich1980; Cole et al. Reference Cole, Wright and Ausich2019), and thus might be expected to have macroevolutionary significance over the history of Diplobathrida. Crinoids are epifaunally tiered passive suspension feeders that finely partition niche space on the basis of feeding ecology (Breimer Reference Breimer1969; Meyer Reference Meyer1973; Ausich Reference Ausich1980; Ausich and Bottjer Reference Ausich and Bottjer1982; Baumiller Reference Baumiller1997; Messing et al. Reference Messing, Hoggett, Vail, Rouse, Rowe, O'Hara and Byrne2017). Notably, there are many skeletal features in the arms of crinoids (e.g., arms, pinnules, brachials, ambulacral grooves) that dictate the maximum size of food particles captured, the efficiency of the filtration fan, and the environmental conditions that are optimal for feeding (Ausich Reference Ausich1980; Kammer Reference Kammer1985; Kammer and Ausich Reference Kammer and Ausich1987, Reference Kammer and Ausich2006; Holterhoff Reference Holterhoff1997; Brower Reference Brower2007; Baumiller Reference Baumiller2008). The relationships between these ecomorphologic characters and niche partitioning in crinoids has been extensively documented in both fossil and living crinoids (Meyer Reference Meyer1973; Macurda and Meyer Reference Macurda and Meyer1974; Ausich Reference Ausich1980; Kitazawa et al. Reference Kitazawa, Oji and Sunamura2007; Baumiller Reference Baumiller2008; see Cole et al. [Reference Cole, Wright and Ausich2019] for a more detailed review). The ecological traits included in this study reflect two of the most important aspects of feeding ecology (Ausich Reference Ausich1980; Cole et al. Reference Cole, Wright and Ausich2019). Filtration fan density (the total number of feeding appendages in a given area) affects feeding by altering the flow of water through the filtration fan, and food size selectivity (controlled by the size of the terminal feeding appendages) dictates the maximum size of the food particle that can be captured.
Data and Methods
Measuring Stratigraphic Duration
Genus duration was measured as the total duration of a genus in millions of years (Myr) given its constituent species. Stage-level bins were used for Ordovician, Devonian, and Mississippian occurrences, whereas series-level bins were used for Silurian occurrences to maintain time bins of roughly equal duration (mean 7.7 Myr, median 7.7 Myr). Although division into finer time bins would be desirable, temporal resolution is variable for the taxa used in this study because of their global distribution and broad stratigraphic ranges. Thus, stage- and series-level time bins were used for estimating genus duration so that taxa were treated at a similar scale of resolution.
Genus duration in millions of years was tabulated using the 2013 Bibliography of Paleozoic Crinoids (Webster and Webster Reference Webster and Webster2014), which was updated to include newly described taxa and to match current divisions of the International Chronostratigraphic Chart. Genera were assumed to originate at the beginning of the time bin in which they first occurred and to terminate at the end of the time bin in which they last occurred. Genera with species occurring in only one stage were assigned a duration equal to that of the stage.
Phylogenetic Framework
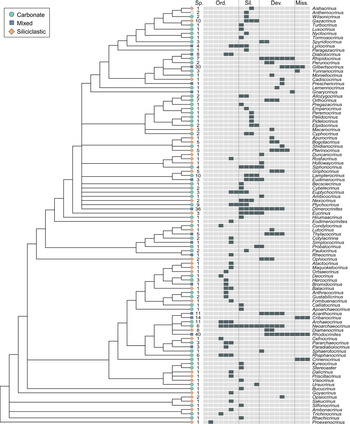
Paleobiological studies often treat taxa as independent units, despite the fact that species have shared evolutionary history. The nonindependence of species’ evolution is important to take into account, because species that diverged more recently from a common ancestor will share more evolutionary history than species that diverged less recently. This may result in greater similarity between features of closely related taxa, such as morphology, ecology, and/or geographic distribution (Felsenstein Reference Felsenstein1985; Harvey and Pagel Reference Harvey and Pagel1991; Wiens Reference Wiens2004; Jablonski and Hunt Reference Jablonski and Hunt2006; Losos Reference Losos2008; Hopkins Reference Hopkins2011; Harnik et al. Reference Harnik, Fitzgerald, Payne and Carlson2014). Here, trees recovered from a recent phylogeny of diplobathrid crinoids (Cole Reference Cole2018) were employed as a framework to take into account the effect of shared evolutionary history on genus duration (Fig. 1). The previous analysis of diplobathrid phylogeny assessed relationships among 101 diplobathrid genera (all but 4 of the currently valid genera) using 135 discrete morphologic characters. Fifteen most-parsimonious trees were recovered, which were largely congruent with trees resulting from Bayesian analysis (see Cole [Reference Cole2018] for further details). In the present study, outgroup taxa were pruned from the tree along with Cleiocrinus because of its uncertain assignment to Diplobathrida (Cole Reference Cole2018). As a result, all tree-based analyses of extinction selectivity used a phylogenetic framework containing 100 diplobathrid genera.
Phylogenetic relationships, durations, lithologies, and species numbers for diplobathrid crinoid genera. Tree topology is based on the strict consensus of 15 most-parsimonious trees recovered from a parsimony analysis of all well-preserved diplobathrid genera. Symbols at the terminal tips represent the lithologic environment in which genera occur, and the numbers following tips represent number of species within each genus. Stage-level stratigraphic ranges are plotted for each genus to the right of the tree; each square represents one stage; stages not scaled to duration. Sp., number of species per genus; Ord., Ordovician; Sil., Silurian; Dev., Devonian; Miss., Mississippian.

For evolutionary hypotheses to be incorporated into comparative studies, the tree must first be scaled to provide branch lengths for the tree in units of time (Bapst Reference Bapst2014). Each of the 15 most-parsimonious trees recovered by Cole (Reference Cole2018) were time-scaled 100 times using the “basic” approach in the R package paleotree (Bapst Reference Bapst2012) with the binned version of the timePaleoPhy function (bin_timePaleoPhy), in which the placement of internal nodes represents the earliest appearance of a taxon contained within the clade (Norell Reference Norell, Novacek and Wheeler1992; Smith Reference Smith1994). In this approach, node ages are randomly drawn from uniform distributions corresponding to first appearance interval times. Time-scaling trees using the first appearance method results in zero-length internal branches that cannot be used in comparative studies (Hunt and Carrano Reference Hunt and Carrano2010), so to circumvent this issue, a small, arbitrary amount of time (0.01 Myr) was added to each zero-length branch. This standard approach allows the tree to be used for comparative phylogenetic analyses without significantly altering the tree's structure or the subsequent results (Hopkins Reference Hopkins2011; Bapst Reference Bapst2013; Harnik et al. Reference Harnik, Fitzgerald, Payne and Carlson2014). All subsequent tree-based analyses were conducted over the recovered distribution of 1500 time-scaled trees.
Morphologic and Ecological Data
To address whether ecological variables were predictors of genus duration, measurement data were collected for multiple continuous skeletal traits that are directly tied to ecological functions. Morphologic data were collected for 295 specimens across 185 species and 100 genera (Supplementary Material). Measurements were taken directly from specimens for all taxa available for study at the Smithsonian National Museum of Natural History, the London Natural History Museum, the Lapworth Museum, and the Chicago Field Museum. For taxa that did not have specimens at accessible museums, measurements were collected from published literature. Measurement averages for each genus were calculated from all specimens measured for that genus. Measurements collected were calyx width (measured where the arms become free), pinnule density (the number of pinnules per 5 mm of arm length), pinnule width, arm length (from the edge of the calyx where the arms become free to the distal terminus), brachial width, and the number of terminal feeding appendages (i.e., the total number of pinnules). Arm length and calyx width were used to calculate the area of the filtration fan:
 $$A = {\rm \pi} \lpar {L + r} \rpar ^2-{\rm \pi} r^2$$
where A is the area of the filtration fan, L is the arm length, and r is the radius of the calyx (Cole et al. [Reference Cole, Wright and Ausich2019], modified from Ausich [Reference Ausich1980]). Although stem length plays an important role in crinoid niche partitioning along with feeding structures (Ausich Reference Ausich1980; Ausich and Bottjer Reference Ausich and Bottjer1982; Cole et al. Reference Cole, Wright and Ausich2019), preservation of complete stems is rare. Only 7% of genera investigated in this study preserved at least one specimen with a complete stem, so stem length was not considered here.
Because species niches are complex and multidimensional, they cannot be adequately represented by a single trait (Ausich Reference Ausich1980; Pianka et al. Reference Pianka, Vitt, Pelegrin, Fitzgerald and Winemiller2017; Cole et al. Reference Cole, Wright and Ausich2019). For example, continuously varying traits relating to crinoid feeding structures like arm number, pinnule and brachial dimensions, as well as the arrangement of arms and pinnules, can combine in countless ways to create filtration fans that vary in their density, feeding efficiency, and ability to capture food particles of different sizes. For this reason, it is the combined effect of multiple ecological traits rather than the individual traits themselves that should be evaluated when characterizing ecological niches. This is typically done through ordination of ecological and/or ecomorphologic traits followed by identifying the trait(s) that correspond to the major axes of variation (e.g., Pianka et al. Reference Pianka, Vitt, Pelegrin, Fitzgerald and Winemiller2017; Cole et al. Reference Cole, Wright and Ausich2019). Here, a principal component analysis (PCA) was conducted in PAST (Hammer et al. Reference Hammer, Harper and Ryan2001) on the morphologic data collected for diplobathrids. Traits included in the analysis were the number of terminal arm tips, the area of the filtration fan, brachial width, pinnule width, and pinnule density. Because many of the traits have high variance (up to three orders of magnitude), variables were log transformed before multivariate analysis.
The first three components resulting from the PCA accounted for more than 95% of the variance in morphologic data (64.4%, 24.0%, and 6.6%, respectively) and were interpreted as body size, filtration fan density, and maximum food particle size, respectively, based on their corresponding loadings (Supplementary Table 1). When analyzing morphologic data using PCA, the first principal component (PC 1) typically represents size (Humphries et al. Reference Humphries, Bookstein, Chernoff, Smith, Elder and Poss1981; Revell Reference Revell2009). Here, all morphologic variables had high positive loadings for PC 1, which is consistent with a strong positive relationship between these variables and overall body size. PC 2 represents the density of the filtration fan, particularly with regard to the number of terminal arm tips and pinnule density. PC 3 was interpreted as corresponding to maximum food size (hereafter “food size”), which relates to brachial width and, to a lesser extent, pinnule width. In all subsequent analyses, scores for the first three principal components were used to investigate the relationship between taxonomic duration and ecomorphologic traits. For brevity, variables are hereafter referred to using trait names rather than PC axes interpreted as corresponding to those traits.
Environmental and Species Data
Lithology is an important factor in crinoid ecology, because it relates to many aspects of the environment, including water turbulence, turbidity, temperature, depth, and proximity to the shore. As a result, lithology can be used as a coarse proxy for habitat preference, and previous work has indicated significant differences in the distribution of crinoid clades across habitats with different types of sediments (Kammer Reference Kammer1985; Holterhoff Reference Holterhoff1997; Kammer and Ausich Reference Kammer and Ausich1987, Reference Kammer and Ausich2006). I collected lithologic data from the rock matrix associated with specimens examined and/or from lithologic descriptions of the associated formations in published literature. Lithology was categorized as carbonate, siliciclastic, or mixed, and each genus was assigned to lithology based on the rock type(s) in which its constituent species were found. Genera with occurrences that were exclusively in carbonate or siliciclastic rocks were assigned “carbonate” or “siliciclastic” lithologies, respectively. “Mixed” lithology was assigned to (1) genera whose constituent species occurred in mixed siliciclastic–carbonate rocks (i.e., specimens were preserved in rock composed of a mixture of siliciclastic and carbonate material, indicating the individual lived in a mixed siliciclastic–carbonate environment during life) and (2) genera that had constituent species that occurred in both pure siliciclastic and pure carbonate rocks.
The final variable investigated as a potential correlate of duration was species richness, as measured by the number of species per genus. I tabulated the number of species in each genus using the 2013 Bibliography of Paleozoic Crinoids (Webster and Webster Reference Webster and Webster2014), supplemented with more recently described taxa not included in the bibliography. Species described from non-calyx material (e.g., only stem or arm fragments) were excluded, as were species that are not currently valid (Supplementary Material).
Analyses
All analyses were performed in RStudio v. 1.1.463. To assess the effect of habitat on taxonomic longevity, I first determined whether genus durations within subsets of lithologic data (carbonate, mixed, siliciclastic) differed significantly by performing a Tukey's honest significant difference (HSD) test on lithology ANOVA data. This approach simultaneously applies pairwise comparisons to the means of all treatments to find means with significant differences. On the basis of the Tukey's HSD test results (see “Results” for further information), all subsequent analyses were performed using lithologic subsets (carbonate, mixed, and siliciclastic) and the full data set including all three lithologies.
Separate analyses were conducted both with and without the potential effects of phylogeny taken into account. For taxonomic analyses that did not consider phylogenetic nonindependence, I first calculated Spearman's rank correlation coefficients to determine whether species number, body size, filtration fan density, and/or maximum food size were significantly correlated with genus duration. Second, multiple linear regression (MLR) was employed to determine the additive effects of multiple variables on genus duration. Finally, Akaike's information criterion (AIC) was applied to all MLR models (i.e., models representing all possible combinations of potential explanatory variables), and small sample size–corrected AIC scores (AICc) were used to identify the combination of variables that best explained the data.
For phylogeny-based analyses, I first employed phylogenetic generalized least squares (PGLS) so that the effect of phylogeny could be incorporated while estimating correlation between duration and the other variables of interest (Felsenstein Reference Felsenstein1985; Grafen Reference Grafen1989; Symonds and Blomberg Reference Symonds, Blomberg and Garamszegi2014). Analyses were run using functions from the R packages nlme and ape (Paradis et al. Reference Paradis, Claude and Strimmer2004; Pinhero et al. Reference Pinheiro, Bates, DebRoy and Sarkar2018) with a Brownian motion model of evolution implemented. This is a “random walk” model that predicts traits will change randomly through time, and thus trait covariance between taxa is expected to decrease through time as changes accumulate along branch lengths (Harmon Reference Harmon2018). PGLS was conducted for both the full model that contained all variables considered and for models containing all possible combinations of variables. AICc scores were then calculated using geiger to identify the combination of variables that constituted the “optimal” model (Harmon et al. Reference Harmon, Weir, Brock, Glor and Challenger2008). Analyses were run over all 1500 time-scaled trees, and the results were used to calculate mean β coefficients, mean p-values, and the percentage of trees for which recovered p-values were less than α = 0.05. Because results of PGLS using full and optimal models were qualitatively similar (Supplementary Tables 3, 4), only results of the full models containing all variables are discussed.
To determine whether there is evidence for phylogenetic structuring of traits, I calculated Pagel's λ for all variables using the phylosig function from the R package phytools to determine the degree of phylogenetic signal in each trait under a Brownian motion model of evolution (Pagel Reference Pagel1999; Cooper et al. Reference Cooper, Jetz and Freckleton2010; Revell Reference Revell2012). Pagel's λ was calculated for each of the 1500 time-scaled trees, and mean λ and associated p-values were computed for the distribution of trees. Blomberg's K, a commonly used alternative measure of phylogenetic signal (Blomberg et al. Reference Blomberg, Garland and Ives2003), was not used, because it is sensitive to incomplete branch-length information (Molina-Venegas and Rodríguez Reference Molina-Venegas and Rodríguez2017), which was the case in the data set used here. Pagel's λ, on the other hand, has been shown to be robust to suboptimal branch-length information and thus was considered preferable for this study (Molina-Venegas and Rodríguez Reference Molina-Venegas and Rodríguez2017).
Finally, I calculated Cohen's f 2, a measure of effect size, for all variables with and without phylogeny considered to determine the degree to which each variable contributed to genus duration (Cohen Reference Cohen1988). Although Cohen's f 2 has not been commonly used for paleontological data, the metric can be used to determine the magnitude and relative effect of variables in multiple regression models by assessing the strength of the relationship between a predictor variable and one or more dependent variables. In addition, effect size can be compared directly among models, which makes this metric valuable for studies including multiple predictor variables or comparing subsets of data (Selya et al. Reference Selya, Rose, Dierker, Hedeker and Mermelstein2012). Cohen's f 2is calculated using R 2 values recovered from multiple regression analyses, so it can be applied to both standard MLR and PGLS (Selya et al. Reference Selya, Rose, Dierker, Hedeker and Mermelstein2012: eq. 2):
 $$f^2 = \displaystyle{{R_{AB}^2 -R_A^2} \over {1-R_{AB}^2}} $$
where B is the variable of interest and A is the combination of all other variables excluding B.  $R_{AB}^2 $ then is the proportion of variance accounted for by all variables together, whereas
 $R_A^2 $ is the proportion of variance accounted for when B is excluded (Selya et al. Reference Selya, Rose, Dierker, Hedeker and Mermelstein2012). For example, in this study, Cohen's f 2 for species number is calculated using:
 $$f^2species = \displaystyle{{R_{sp + size + ffd + food}^2 -R_{size + ffd + food}^2} \over {1-R_{sp + size + ffd + food}^2}} $$
where subscripts denote the variables included in each regression model used to calculate R 2 values (sp = species number, size = body size, ffd = filtration fan density, food = maximum food size). In MLR, R 2 values can be recovered from the summary of results from the lm() function in base R and used to calculate Cohen's f 2. For PGLS, however, R 2 values are not automatically supplied but can be calculated from recovered log-likelihood scores using the approach outlined by Nagelkerke (Reference Nagelkerke1991: eq. 1b; Anderson Reference Anderson2008: Appendix A.7):
 $$R^2 = 1-{\rm exp}\left\{ {-\displaystyle{2 \over N}\lpar {l_{\,full}-l_{null}} \rpar } \right\}$$
Where l null is the log likelihood of the null model containing only the intercept term, l full is the log likelihood of the full model containing all variables, and N is the sample size; this is known as the Cox and Snell R 2 (Cox and Snell Reference Cox and Snell1989; Nagelkerke Reference Nagelkerke1991). Here, I calculated Cohen's f 2 values for the four variables of interest for both MLR and PGLS models. For all PGLS models, Cohen's f 2 values were calculated for each of the 1500 time-scaled trees, and mean f 2 values were then calculated for each variable. Using Cohen's f 2, a trait is considered to have significant effect size if f 2 ≥ 0.02 (Cohen Reference Cohen1988). In addition, the magnitude of effect size is considered small if 0.02 ≥ f 2 ≥ 0.15, moderate if 0.15 ≥ f 2 ≥ 0.35, and large if f 2 ≥ 0.35 (Cohen Reference Cohen1988).
Results
Lithologic Environment Analyses
Of the 99 taxa (out of 100) for which lithologic data were available, 55 occurred only in carbonate environments, 15 occurred in mixed carbonate/siliciclastic environments, and 29 occurred only in siliciclastic environments.
ANOVA indicated that the taxa occurring in different lithologic environments are not all from the same distribution (p = 0.004; Fig. 2A). The Tukey's HSD test indicates significant differences in the mean durations of taxa occurring in mixed versus carbonate lithologies and mixed versus siliciclastic lithologies but not between siliciclastic and carbonate lithologies (Table 1, Fig. 2B). Genera from mixed lithologies have significantly longer durations than those found in carbonate or siliciclastic lithologies (Fig. 2).
Relationship between lithologic environment and stratigraphic duration of genera. A, Box plot of major lithologic types with respect to duration. Error bars represent 95% confidence intervals, horizontal black lines represent means. B, Pairwise comparisons from Tukey's HSD (honest significant difference) using ANOVA of lithologic data. Brackets represent 95% family-wise confidence intervals; confidence intervals not containing 0 indicate difference between groups is statistically significant.

Tukey's multiple comparison of means at the 95% family-wise confidence level. Comparisons are given for each combination of lithologic subsets. Bolded p-values represent statistically significant differences between taxonomic durations for lithologies. Lithologies are listed in the order compared, so negative differences indicate taxa occurring in the first lithology tend to have shorter durations relative to those in the second lithology, and positive differences indicate taxa occurring in the first lithology have longer durations relative to those in the second lithology.

Predictors of Duration
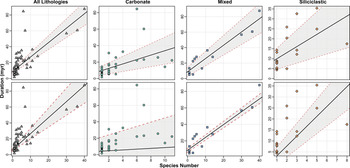
Spearman's rank correlation indicates a significant positive correlation between duration and number of species per genus for the full data set and for all lithologic subsets (Table 2, Fig. 3). In addition, duration is significantly correlated with body size for the full data set, but not for any of the lithologic subsets. Likewise, filtration fan density and food size do not correlate significantly with duration for the full data set or any of the lithologic subsets.
Scatter plots of all variables as a function of duration with least squares regression lines plotted for each lithologic subset. Data are subsetted by lithologic environment. See Table 2 for significance of correlations.

Spearman's rank correlations between duration and species number, body size, crown shape, and filtration fan density. Bold values are statistically significant; asterisks (*) indicate p-value range. *p < 0.05; **p < 0.01; ***p < 0.001.

MLR recovers a significant positive correlation between duration and the number of species within a genus for the full data set as well as for all lithologic subsets (Table 3, Fig. 4). For genera occurring in carbonate environments, food size is also significantly correlated with duration. None of the other variables (body size, food size, or filtration fan density) correlate significantly with duration at α = 0.05, regardless of lithologic environment. For the full, carbonate, and mixed data sets, optimal models (e.g., the combination of variables with the best fit to the observed data) identified by AICc scores contain the same variables identified as significant predictors in multiple regression analyses (Supplementary Table 2). Species number was the only variable in the optimal model for all lithologies combined and the mixed subset, and the best-fit model for the carbonate subset includes both species number and food size. For the siliciclastic subset, the optimal model includes both species number and filtration fan density. However, in each of the lithologic subsets, ΔAIC is very small for several other models, suggesting support for the optimal models is not robust.
Scatter plots of species number versus genus duration for all lithologies combined and for lithologic subsets. Solid lines represent regression lines from multiple linear regression (upper row) and phylogenetic generalized least squares (lower row). Shaded areas represent 95% confidence intervals. All regression lines are significant with the exception of that for PGLS of carbonate data.

Results of multiple linear regression for the additive effects of species number, body size, food size, and filtration fan on duration. Coefficients ±1 SE are given for the full data set, including all lithologies and for lithologic subsets. Bold values are statistically significant; asterisks (*) indicate p-value range. *p < 0.05; **p < 0.01; ***p < 0.001.

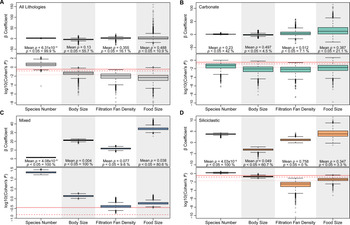
When phylogeny was incorporated into regression analyses using PGLS, variables that were significantly correlated with genus duration changed for lithologic subsets but not for total combined lithology (Table 4, Fig. 5). Results of PGLS for all lithologies combined are identical to multiple regression, for which only species number is significantly correlated with duration (mean p = 6.31 × 10⁻⁴, p < 0.05 = 100%) (Figs. 4, 5). When correlations of traits for carbonate data were evaluated using PGLS, all significant correlations disappeared. By contrast, accounting for phylogeny within mixed and siliciclastic subsets resulted in recovery of additional significant correlates of duration. Whereas only species number was a significant predictor for mixed and siliciclastic lithologies under MLR, PGLS of mixed lithologies recovered species number (mean p = 4.08 × 10⁻⁸, p < 0.05 = 100%), body size (mean p = 0.004, p < 0.05 = 100%), and food size (mean p = 0.038, p < 0.05 = 80.6%) as significant predictors. For PGLS of siliciclastic lithologies, both species number (mean p = 4.03 × 10⁻⁶, p < 0.05 = 100%) and body size (mean p = 4.87 × 10⁻², p < 0.05 = 60.7%) were recovered as significant predictors of duration (Figs. 4, 5). For PGLS, optimal models identified by AICc scores contain different variables than those identified as significant correlates of duration (Supplementary Table 3). The optimal model for all lithologies combined includes species number, body size, and filtration fan density; for the carbonate subset it includes only species number; for the mixed subset it includes species number, body size, and food size; and for the siliciclastic subset it includes species number and body size. As with results from MLR, however, there were multiple, alternative models for each lithologic subset with only marginally larger AICc scores, suggesting equivocal support for optimal models.
Results of phylogenetic generalized least squares and corresponding Cohen's f 2 values for each variable. Panels are divided by lithology: A, All lithologies combined; B, carbonate; C, mixed; and D, siliciclastic. For each panel, upper box plots give the distribution of β coefficients for each of the four variables calculated over a distribution of 1500 time-scaled trees, and mean p-values are given along with the percentage of trees for which p < 0.05 were recovered. Lower box plots in each panel give the distribution of log(Cohen's f 2), a measure of effect size. Horizontal lines represent the thresholds for small (f 2 > 0.02, dotted line), moderate (f 2 > 0.15, dashed line), and large (f 2 > 0.35, solid line) effect sizes as defined by Cohen (Reference Cohen1988).

Results of phylogenetic generalized least squares for the additive effects of species number, body size, food size, and filtration fan on duration. Mean β coefficients and p-values calculated across a distribution of 1500 time-scaled trees are given, along with the percentage of trees for which p < 0.05 was recovered. Bold values are statistically significant.

Effect Size
Cohen's f 2 values calculated from MLR recovered a large effect size for species number across the three lithologic subsets as well as for all lithologies combined (Table 5). For all total combined lithologies, no other variables were recovered with significant effect sizes (Table 5). For the carbonate subset, small effect sizes were recovered for filtration fan density (f 2 = 0.04) and food size (f 2 = 0.08). Within the mixed subset, moderate effect sizes were recovered for body size (f 2 = 0.33) and food size (f 2 = 0.17), and small effect size was recovered for filtration fan density (f 2 = 0.10). The only other significant effect size within the siliciclastic subset was for filtration fan density (f 2 = 0.10) (Table 5).
Effect size of traits on duration as given by Cohen's f 2. Effect size was calculated for multiple regression and phylogenetic generalized least squares models using all considered variables. Asterisks (*) indicate magnitude of effect size based on values given by Cohen (Reference Cohen1988). Effect size: *small (f 2 > 0.02); **medium (f 2 > 0.15); ***large (f 2 > 0.35). Note that for several traits, f 2 values are only marginally significant (f 2 ≈ 0.02).

When phylogeny was accounted for by calculating Cohen's f 2 from PGLS results, the significance and magnitude of effect size for traits changed in several ways (Table 5, Fig. 5). For total combined lithologies, species number remained the only variable with large effect size, but the magnitude of effect increased from 1.17 to 7.88. In addition, effect sizes of the other three traits increased from nonsignificant values to small effect size. Similarly, when phylogeny was incorporated in the mixed lithology subset, species number retained a large effect size, and body size, filtration fan density, and food size increased to large effect sizes (Table 5). For the siliciclastic subset under the PGLS model, effect size for species number remained large, filtration fan density decreased to a nonsignificant level, and body size and food size increased from nonsignificant to medium and small effect sizes, respectively. When phylogeny was accounted for in the carbonate subset, the effect of species number on duration decreased from a large to a small effect size, and body size increased from a nonsignificant level to a small effect size; effect sizes for both filtration fan density and food size remained small (Table 5, Fig. 5).
Phylogenetic Signal
Values of Pagel's λ calculated for species number, body size, filtration fan density, food size, lithology, and stratigraphic duration of genera indicated significant phylogenetic signal for all traits (Table 6). The highest mean λ values were recovered for body size (mean λ = 0.628) and lithology (mean λ = 0.526), and the lowest mean values were recovered for duration (mean λ = 0.203) and species number (mean λ = 0.305). Although values of λ varied (widely, in some cases) for traits, all mean p-values were statistically significant, and 100% of p-values calculated from all 1500 time-scaled trees were < 0.05 (Table 6, Fig. 6).
Phylogenetic signal of traits across the diplobathrid phylogeny. Distributions represent values of Pagel's λ calculated for each trait over 1500 time-scaled trees.

Phylogenetic signal of traits across the distribution of diplobathrid crinoid trees. Mean Pagel's λ and p-values calculated across all time-scaled trees are given, along with the proportion of trees for which p-values < 0.05 were recovered.

Discussion
Phylogeny and Extinction Risk
Several recent studies on extinction selectivity in the fossil record have not found considerable differences between taxic and phylogenetic approaches (e.g., Crampton et al. Reference Crampton, Cooper, Beu, Foote and Marshall2010; Hopkins Reference Hopkins2011; Harnik et al. Reference Harnik, Fitzgerald, Payne and Carlson2014). By contrast, in the four sets of comparisons investigated here (all lithologies combined and the three lithologic environment subsets), I identified notable differences between some, but not all, results when phylogeny was incorporated. Although the results of taxic and phylogenetic approaches were broadly similar, accounting for phylogenetic structure altered interpretations considerably in some cases. Notably, incorporating phylogeny did not consistently weaken correlations between traits and duration, as is commonly (but incorrectly) expected (Rohlf Reference Rohlf2007). Instead, both the strength and the direction of certain relationships changed under comparative methods for all lithologic subsets. Changes in the significance of correlations under MLR versus PGLS models appear unpredictable a priori, with traits increasing, decreasing, or remaining the same. By contrast, many changes in Cohen's f 2 values (or lack thereof) appear to be tied to the magnitude of the effect size and are thus somewhat predictable. All traits with medium or large effect sizes under taxonomic approaches retained at least small effect sizes when phylogeny was accounted for, whereas traits with small effect sizes under MLR lost all significant effect under PGLS. In some cases, however, new traits with significant effect sizes emerged under PGLS with no apparent connection to their effect sizes under MLR.
Differences between results of taxic and phylogenetic approaches in this study suggest non-phylogenetic methods recover similar results only when correlation is strong and/or effect size is very large. For example, I find that traits with moderate to large (f 2 > 0.15) effect sizes are likely to retain significant effect size when phylogeny is accounted for. However, phylogenetic approaches may recover additional traits with significant effect sizes with no obvious criteria predicting the traits for which this may occur. Likewise, changes in the significance of correlation between traits and duration do not appear predictable. Overall, these results show interpretations of extinction selectivity can be altered in unpredictable ways when phylogeny is taken into account and highlight the importance of a comparative approach when investigating correlates of extinction risk.
All of the traits considered, including genus duration and lithologic environment, were found to have significant phylogenetic signals (Table 6). Because this indicates phylogenetic structuring of traits across at least part of the diplobathrid tree, analyses incorporating phylogeny should provide results that more realistically reflect the evolutionary processes responsible for generating observed patterns. As a result, the majority of the following discussion will focus on the results of phylogenetic rather than taxic approaches.
Species Richness and Extinction Risk
Of the variables assessed here, the strongest control on genus longevity of diplobathrid crinoids appears to be the number of species within a genus. The strong correlation between species number and duration is recovered consistently for taxonomic investigations of all lithologic subsets, and when the effect of phylogeny is considered using PGLS, species number remains significantly correlated with duration for all lithologic environments except carbonates (Fig. 4). Species number is also the only trait for which a significant effect size is recovered regardless of lithologic environment investigated or the regression model used. Additionally, species number is the only common component among all optimal models identified by AIC. As noted, a number of alternative models have only marginally larger AICc values than the optimal models, but in most cases these alternative models contain species number (Supplementary Tables 2, 3). Finally, Cohen's f 2 values reveal species richness has the greatest effect size regardless of subsetting by lithologic environment, indicating it has a greater relative contribution to genus duration than do the other traits (Table 5).
Several non–mutually exclusive reasons may explain why species number corresponds so strongly to the duration of diplobathrid genera. First, higher species richness means random extinction is less likely to wipe out all species within a clade, and there are many examples supporting species richness as a trait that buffers against extinction, at least during intervals of background extinction (Jablonski Reference Jablonski1986; Payne and Finnegan Reference Payne and Finnegan2007; Smits Reference Smits2015; Foote et al. Reference Foote, Ritterbush and Miller2016). Second, species number frequently correlates strongly with geographic range size (Jablonski and Roy Reference Jablonski and Roy2003; Foote et al. Reference Foote, Ritterbush and Miller2016), and an inverse relationship between geographic range size and extinction risk has been documented for many fossil groups (Hansen Reference Hansen1980; Jablonski and Hunt Reference Jablonski and Hunt2006; Payne and Finnegan Reference Payne and Finnegan2007; Powell Reference Powell2007; Foote et al. Reference Foote, Crampton, Beu and Cooper2008; Harnik et al. Reference Harnik, Fitzgerald, Payne and Carlson2014; Smits Reference Smits2015; see McKinney [Reference McKinney1997] for a review). Although geographic range size was not addressed in this study and range data are not currently available, based on the expected relationship between species number and geographic range, it is very possible that diplobathrid genera with greater numbers of constituent species had more extensive geographic ranges that would have buffered genera from extinction, allowing them to persist in the fossil record. In addition, geographic ranges of genera and other higher taxa can also interact synergistically with species richness to increase resilience to extinction via increased ecological diversity (Foote et al. Reference Foote, Ritterbush and Miller2016), but as with species richness alone, this buffering is more pronounced during background extinctions than mass extinctions (Jablonski Reference Jablonski1986; Payne and Finnegan Reference Payne and Finnegan2007).
Another potential explanation for the significant correlation between genus duration and species number may relate to species selection, specifically “strict-sense species selection” (sensu Jablonski Reference Jablonski2008b), wherein differences in speciation and/or extinction rates arise from emergent, heritable properties at the species level (Vrba Reference Vrba1984; Okasha Reference Okasha2006; Jablonski Reference Jablonski2008b; Rabosky and McCune Reference Rabosky and McCune2010; Stadler Reference Stadler2011). As a result, heritable species-level traits that have a significant effect on net diversification, such as geographic range size (Jablonski Reference Jablonski1987; Hunt et al. Reference Hunt, Roy and Jablonski2005; Jablonski and Hunt Reference Jablonski and Hunt2006), may play an important role in survivorship. Strong phylogenetic signal recovered for species richness of diplobathrid genera indicates species number is conserved across at least part of the phylogeny and, by extension, suggests speciation and extinction rates are heritable among diplobathrid crinoids. Although further investigation would be necessary to confirm the role, if any, of species selection in the longevity of diplobathrid genera, such results would complement a previous study that found support for species selection in monobathrid crinoids, the sister group to diplobathrids (Simpson Reference Simpson2010).
Habitat Breadth and Extinction Risk
I interpret habitat, as defined by lithologic environment, to be the secondary control on duration of diplobathrid genera, following species number. Tukey's HSD test results indicate significant differences in duration corresponding to lithologic environment (Fig. 2, Table 1). Further, species number correlates significantly with duration for most lithologic subsets, whereas the significance of other ecological traits is highly variable among lithologic subsets. This provides additional support for the hierarchical ranking of species richness as the primary control and lithology as the secondary control on diplobathrid genus duration.
Taxa inhabiting environments with mixed lithologies were found to have significantly longer durations than those living in exclusively siliciclastic or exclusively carbonate environments (Fig. 2, Table 1). Many of the physical environmental conditions of carbonate versus siliciclastic depositional settings result in strikingly different habitats with dramatic differences in current strength and type, water depth, suspended sediment, and substrate conditions. As a result, genera with constituent species occurring in both carbonate and siliciclastic environments and/or in environments with alternating carbonate and siliciclastic sedimentation must be capable of coping with more extreme habitat variation (Kammer Reference Kammer1985; Kammer and Ausich Reference Kammer and Ausich1987; Holterhoff Reference Holterhoff1997; Kammer et al. Reference Kammer, Baumiller and Ausich1998). Thus, I attribute the longer durations of crinoid genera from mixed lithologic environments to greater tolerance of environmental heterogeneity.
An inverse relationship between extinction risk and environmental tolerance/niche breadth has been documented in many other groups (Liow Reference Liow2007; Heim and Peters Reference Heim and Peters2011; Nurnberg and Aberhan Reference Nurnberg and Aberhan2013; see Colles et al. [Reference Colles, Liow and Prinzing2009] for a review), including crinoids (Kammer et al. Reference Kammer, Baumiller and Ausich1997, Reference Kammer, Baumiller and Ausich1998), in keeping with Simpson's rule of “survival of the unspecialized” (Reference Simpson1944). Investigations of species longevity of Mississippian crinoids found that clades with higher mean eurytopy scores (a proxy for niche breadth calculated from the mean number of facies per species) were composed of longer-lived species (Kammer et al. Reference Kammer, Baumiller and Ausich1997, Reference Kammer, Baumiller and Ausich1998). Although the type of environmental data used in this study of diplobathrids (lithology type) is different from that used by Kammer et al. (Reference Kammer, Baumiller and Ausich1997, Reference Kammer, Baumiller and Ausich1998; the eurytopy index), the same overall pattern is recovered: greater environmental tolerance results in increased taxonomic longevity. The results presented here indicate this pattern holds true within crinoid clades, as well between crinoid clades.
Ecology and Extinction Risk
Body size, filtration fan density, and food size are considered tertiary controls on diplobathrid genus duration. The degree of correlation and effect size of these traits differ between lithologic environments, indicating that controls on longevity vary within habitats. Body size was a significant predictor of crinoid genus duration only for mixed and siliciclastic environments when phylogeny was taken into account. The correlation between body size and duration was positive for mixed environments but negative for siliciclastic environments (Table 4). Many previous investigations have found extinction risk increases with larger body size, especially in vertebrates, as a result of covariation between body size and other traits that increase extinction risk, such as low reproductive rate, longer generation time, and smaller population size (Gaston and Blackburn Reference Gaston and Blackburn1997; Purvis et al. Reference Purvis, Gittleman, Cowlishaw and Mace2000; Cardillo et al. Reference Cardillo, Mace, Jones, Bielby, Bininda-Emonds, Sechrest, Orme and Purvis2005; Tomiya Reference Tomiya2013). By contrast, in marine invertebrates, larger body size may improve survivorship through mechanisms like increased larval production, or it may not correlate with extinction risk, because attributes that are more important for survivorship may not covary with body size (Williams Reference Williams1975; Jablonski Reference Jablonski, Jablonski, Erwin and Lipps1996; McKinney Reference McKinney1997). As a result, there is extensive heterogeneity in the correlations between taxonomic survivorship and body size in marine invertebrates (Jablonski Reference Jablonski, Jablonski, Erwin and Lipps1996; Lockwood Reference Lockwood2005; Crampton et al. Reference Crampton, Cooper, Beu, Foote and Marshall2010; Harnik Reference Harnik2011), which suggests body size plays a complex macroevolutionary role in invertebrate groups that may be taxon specific. Within crinoids, minimal treatment has been given to understanding potential ecological advantages of different body sizes (Holterhoff Reference Holterhoff1997). In certain crinoid faunas, body size has been found to covary with sedimentary environment, although a driving mechanism for this pattern has not been identified (Watkins and Hurst Reference Watkins and Hurst1977). Because the results presented here recover body size as a significant correlate of genus duration across some lithologic environments, it is possible that a similar underlying process may be controlling both patterns.
The relationships between genus duration and the two traits investigated that relate to feeding ecology—filtration fan density and maximum food size—are also notable. A previous study of survivorship across multiple crinoid groups identified filtration fan density as an important predictor of longevity, particularly when comparing pinnulate and apinnulate crinoids (Baumiller Reference Baumiller1993). By contrast, I found filtration fan density was not a significant predictor of diplobathrid genus longevity, although it did have a significant effect size for taxa occurring in all but siliciclastic environments (Fig. 5, Tables 4, 5). Similarly, I found maximum food size had significant effect size for all lithologic subsets but was only a significant predictor of survivorship for taxa in mixed lithologic environments, where taxa that could capture larger food particles had longer durations. This may indicate these longer-lived taxa were generalists with regard to food size selectivity, that is, they were able to capture both large and small food particles because of wide ambulacra and associated feeding structures (however, note that this correspondence between increasing ambulacral width and decreasing selectivity for food size may be applicable to pinnulate diplobathrids but does not hold true for all crinoids, particularly those with more open and/or apinnulate filtration fans that are unable to capture smaller food particles) (Kammer Reference Kammer1985; Kammer and Ausich Reference Kammer and Ausich1987). Food size selectivity is not recovered as a significant correlate of duration for any of the other lithologic environments.
The minimal correlation between ecology and taxonomic duration is somewhat unexpected for two reasons. First, filtration fan density and food particle size are important components of niche differentiation in crinoids and determine whether a crinoid is a specialist or generalist in its feeding ecology (Ausich Reference Ausich1980; Holterhoff Reference Holterhoff1997; Cole et al. Reference Cole, Wright and Ausich2019). For example, specialist crinoids are those with denser filtrations fans and the ability to capture only small food particles (as controlled by ambulacral width), because they require more specific environmental conditions for optimal feeding and can only capture a narrow range of food particles. As a result, it would be expected that specialist diplobathrids with denser filtration fans and more restricted food size selectivity would be more prone to extinction, regardless of lithologic environment. Second, there are many documented examples of strong covariation between structure of the filtration fan and environmental settings (Kammer and Ausich Reference Kammer and Ausich1987; Holterhoff Reference Holterhoff1997; Kammer et al. Reference Kammer, Baumiller and Ausich1997, Reference Kammer, Baumiller and Ausich1998; Brower Reference Brower2007), because filtration fans of different densities require different environmental conditions for optimal feeding to occur (Ausich Reference Ausich1980; Baumiller Reference Baumiller1992; Kammer and Ausich Reference Kammer and Ausich2006). If covariation between filtration fan structure and habitat were conserved across diplobathrids, we would expect filtration fan density to be a significant predictor of duration, especially for total combined lithologies. However, no such pattern is recovered. Instead, habitat and feeding ecology appear to be decoupled in diplobathrids, at least insofar as their effects on genus duration are concerned. These results indicate substantial heterogeneity in the effect of feeding ecology on taxonomic longevity. Further, when coupled with conclusions from previous investigations (Baumiller Reference Baumiller1993; Kammer et al. Reference Kammer, Baumiller and Ausich1997, Reference Kammer, Baumiller and Ausich1998), it appears that the influence of ecology on taxonomic survivorship may vary across phylogenetic scales, where fan structure is important across crinoid clades, but plays a minimal role within the diplobathrid clade.
Conclusions
Investigation of macroevolutionary patterns in the fossil record should ideally account for both the influence of phylogeny and the effect of potentially interacting variables to avoid overly simplified and/or potentially distorted conclusions. Here, I applied a broad range of analytical techniques to the fossil record of diplobathrid crinoids to determine (1) the relative contributions of multiple variables to extinction selectivity and (2) how phylogeny effects interpretations of extinction selectivity. From these approaches, I identified a series of hierarchically nested variables that operate in concert to control crinoid extinction selectivity. Notably, I found species richness was the primary variable controlling diplobathrid genus duration, which likely correlates with larger geographic range size. I identified habitat, defined by lithologic environment (carbonate, mixed, or siliciclastic), as the secondary predictor of diplobathrid genus duration. Genera inhabiting mixed lithologic settings were found to have significantly longer durations than those occurring in exclusively siliciclastic or carbonate environments, which I attribute to higher environmental tolerance and greater niche breadth of taxa occurring in mixed environments. Finally, I identified two ecological variables (filtration fan density and food size) along with body size as weaker, tertiary controls on diplobathrid extinction selectivity. The effect of these variables on extinction selectivity differed widely among lithologic subsets, suggesting pressures of selective extinction vary between habitats. These results contrast with a previous study that identified filtration fan density as an important predictor of survivorship across Crinoidea as a whole (Baumiller Reference Baumiller1993). Here, fan density had a significant effect on genus duration only for diplobathrid crinoids occurring in mixed lithologic environments. This heterogeneity in the effect of ecological traits on crinoid extinction selectivity demonstrates these traits play a complex role in the generation of crinoid macroevolutionary patterns, with results depending on both phylogenetic scale and lithologic environment considered.
Incorporation of phylogeny into the study of diplobathrid longevity was found to have unpredictable effects on the association between traits and genus duration. In most cases, predictor variables that had strong associations with duration and moderately large effect sizes (Cohen's f 2 > 0.15) under taxic approaches, such as species richness, were still recovered under phylogeny-based analyses. However, accounting for phylogeny unexpectedly revealed new correlations and/or significant effect sizes for some variables, whereas other variables lost their associations with duration entirely. These results suggest strong associations recovered under taxic approaches will still be recovered under phylogenetic approaches, but many nuances might be overlooked. Importantly, moderate to weak correlations might not be detected, and other variables might be erroneously identified as significant predictors of extinction selectivity. Thus, caution should be used when interpreting results from studies that do not explicitly incorporate phylogenetic hypotheses.
Acknowledgments
This research was supported through student research grants from the Paleontological Society and Ohio State University's Friends of Orton Hall fund. Additional support was provided through a Presidential Fellowship (The Ohio State University), a Springer Postdoctoral Fellowship (Smithsonian Institution, National Museum of Natural History) and a Kathryn W. Davis Postdoctoral Fellowship (American Museum of Natural History). The design of this study and an early draft of the article were improved through many insightful discussions with W. I. Ausich. D. F. Wright provided assistance with coding and gave helpful feedback on analyses, data visualization, and a draft of this article. The article was also improved by comments from M. J. Hopkins and by reviews from two anonymous referees. I thank guest editors J. C. Lamsdell and C. R. Congreve for inviting this article as a contribution to the Paleobiology Special Issue, “Phylogenetic Paleoecology.” The design of Figure 1 was modeled after Harnik et al. (Reference Harnik, Fitzgerald, Payne and Carlson2014: Fig. 2).