Several studies have reported an ongoing change across varieties of English in which /s/ retracts before consonants to an [ʃ]-like variant, most commonly in /stɹ/ clusters. This change has been documented in regions of the US (Ahlers & Meer, Reference Ahlers and Meer2019; Durian, Reference Durian2007; Gylfadottir, Reference Gylfadottir2015; Hinrichs, Bergs, Axel, Brozovsky, Hodge, Meeman, & Schultz, Reference Hinrichs, Bergs, Axel, Brozovsky, Hodge, Meeman and Schultz2015; Labov, Reference Labov2001; Rutter, Reference Rutter2011; Shapiro, Reference Shapiro1995; Stuart-Smith, Sonderegger, Macdonald, Mielke, McAuliffe, & Thomas, Reference Stuart-Smith, Sonderegger, Macdonald, Mielke, McAuliffe, Thomas, Calhoun, Escudero, Tabain and Warrent2019; Wilbanks, Reference Wilbanks2017), the UK (Bailey, Nichols, Baranowski, & Turton, Reference Bailey, Nichols, Baranowski and Turton2019; Bass, Reference Bass2009; Gain Reference Gain2014; Stuart-Smith et al., Reference Stuart-Smith, Sonderegger, Macdonald, Mielke, McAuliffe, Thomas, Calhoun, Escudero, Tabain and Warrent2019), New Zealand (Lawrence, Reference Lawrence2000; Warren, Reference Warren1996), and Australia (Stevens & Harrington, Reference Stevens and Harrington2016). Much sociolinguistic research into this phenomenon has focused on the social and linguistic conditioning of the change in /stɹ/ in these individual communities.
Meanwhile, studies by Stuart-Smith and colleagues have examined variation in voiceless sibilants in large scale, cross-corpora analyses of English dialects (Stuart-Smith et al., Reference Stuart-Smith, Sonderegger, Macdonald, Mielke, McAuliffe, Thomas, Calhoun, Escudero, Tabain and Warrent2019; Stuart-Smith, Sonderegger, Mielke, Tanner, & Willerton, Reference Stuart-Smith, Sonderegger, Mielke, Tanner and Willerton2020). This work has focused on the distribution of sibilant categories’ spectral positions in acoustic space across individuals and dialects, providing a more global view of sibilant variation. For example, the findings of Stuart-Smith et al. (Reference Stuart-Smith2020) suggest there is more within-community than intercommunity variation in sibilant space distributions (i.e., distance between mean position of /s/ and /ʃ/).
Building on these insights, this paper examines which sociolinguistic factors account for the spectral positions of not only /stɹ/, but also /s/ and /ʃ/, within a single community. We examine variation and change in voiceless sibilants in the speech of African Americans in Washington DC, from the Corpus of Regional African American Language (CORAAL; Kendall & Farrington, Reference Kendall and Farrington2021). We examine change via apparent time, grouping speakers into generational cohorts based on years of birth (see Farrington, Reference Farrington2019). We foreground two primary axes of social structure common to variationist analysis, gender and social class, to explore their effect on sibilant variation. Overall, we ask to what extent three categories of sibilants (/s/ in /tɹ/ contexts, other contexts of /s/, and /ʃ/) are changing over time and how their variation is conditioned by social and linguistic constraints.
Our study is motivated by prior examinations of /stɹ/ within communities, considering the factors that condition variation and change within the community, and incorporates methodologies from Stuart-Smith et al.'s (Reference Stuart-Smith2020) intercommunity analyses, probing one of the corpora used in that study at greater depth. Additionally, this paper's examination of sibilant patterns in a variety of African American Language (AAL) adds to the literature on /stɹ/-retraction and sibilant variation more broadly, which has focused primarily on white varieties. In doing so, this work also adds to the more general body of work on consonantal variation in AAL, and specifically recent work on sibilant variation in AAL (Calder & King, Reference Calder and King2020). AAL remains one of the most researched varieties of English, but most of the focus has been on morphosyntactic variables (e.g., Bailey & Maynor, Reference Bailey and Maynor1985; Blake, Reference Blake1997; Fasold, Reference Fasold1981; Green, Reference Green2007; Rickford, Reference Rickford, Rickford and Romaine1999) and, more recently, vowel variation, including studies of the African American Vowel Shift and regional vowel variation (King, Reference King2016; Kohn, Reference Kohn2014; Kohn & Farrington, Reference Kohn and Farrington2013; Thomas, Reference Thomas2007). However, as Thomas (Reference Thomas2007) describes, there is a need for more descriptions of consonantal variation in AAL, and there is a noticeable lack of acoustic studies on the topic. Thus, in addition to our primary focus on understanding the “orderly heterogeneity” (Weinreich, Labov, & Herzog, Reference Weinreich, Labov and Herzog1968) of English sibilants, we add to the growing body of work on AAL by providing a description of sibilant variation and change.
BACKGROUND
Defining the sibilant space
Sociolinguistic studies of /s/ have tended to examine either phonetically motivated changes related to /stɹ/ (e.g., Durian, Reference Durian2007; Gylfadottir, Reference Gylfadottir2015), or socioindexical variation of the entire /s/ category (e.g., Campbell-Kibler, Reference Campbell-Kibler2011; Levon & Holmes-Elliott, Reference Levon and Holmes-Elliott2013; Podesva & Van Hofwegen, Reference Podesva, Van Hofwegen, Levon and Mendes2015; Stuart-Smith, Reference Stuart-Smith, Cole and Hualde2007). These approaches have thus treated each category as a distinct “variable” (e.g., either /stɹ/ singularly or /s/ as a whole), without reference to the larger sibilant system that has been well-characterized in other areas (e.g., Newman, Clouse, & Burnham, Reference Newman, Clouse and Burnham2001). We discuss that system here as the sibilant space, in analogy with the familiar term vowel space, common to much sociophonetic work considering the positions and distributions of individual vowels in acoustic space alongside other vowels. The voiceless sibilants /s/ and /ʃ/ occupy the same axis of front-back articulation (alveolar to postalveolar), which correlates with several acoustic properties (center of gravity, spectral peak, etc.). Thus, sibilant categories’ realizations can be characterized in terms of their central tendencies and variability within the acoustic range of [s] to [ʃ] (see also Newman et al., Reference Newman, Clouse and Burnham2001; Smith, Mielke, Magloughlin, & Wilbanks, Reference Smith, Mielke, Magloughlin and Wilbanks2019). That sibilants are not phonetically independent, showing structured variability (e.g., Chodroff & Wilson, Reference Chodroff and Wilson2020), is further motivation for our examination of multiple sibilant categories together.
Variation in /s/
A wealth of literature demonstrates that /s/ is variable both in terms of its socioindexicality (Campbell-Kibler, Reference Campbell-Kibler2011; Levon, Maegaard, & Pharao, Reference Levon, Maegaard and Pharao2017; Munson, McDonald, DeBoe, & White, Reference Munson, McDonald, DeBoe and White2006; Podesva & Van Hofwegen, Reference Podesva, Van Hofwegen, Levon and Mendes2015; Stuart-Smith, Reference Stuart-Smith, Cole and Hualde2007; Zimman, Reference Zimman2017) and phonological conditioning (Baker, Archangeli, & Mielke, Reference Baker, Archangeli and Mielke2011; Stevens & Harrington, Reference Stevens and Harrington2016), which likely underlies the general observation that /s/ shows a large degree of interspeaker variation (e.g., Newman et al., Reference Newman, Clouse and Burnham2001; Kraljic & Samuel, Reference Kraljic and Samuel2007; Stuart-Smith et al., Reference Stuart-Smith2020). Few prior studies have examined both socioindexical and phonetic factors as sources of /s/ variability together, so here we consider each in turn, followed by a closer examination of /stɹ/.
Studies examining socioindexical variation in /s/ have established evidence for its social stratification. Sexual orientation is an often-discussed social pattern of /s/ (e.g., Crist, Reference Crist1997; Munson et al., Reference Munson, McDonald, DeBoe and White2006; Podesva, Roberts, & Campbell-Kibler, Reference Podesva, Roberts and Campbell-Kibler2002; Podesva & Van Hofwegen, Reference Podesva, Van Hofwegen, Levon and Mendes2015). For example, Munson et al. (Reference Munson, McDonald, DeBoe and White2006) found that male speakers identified by listeners as sounding gay had fronter and narrower /s/ production compared to those identified as sounding straight. Additionally, and as central focus to this paper, much of this work has examined gender as a primary axis of variation, demonstrating that women generally show fronter /s/ than men (Fuchs & Toda, Reference Fuchs, Toda and Zygis2010; Holliday, Beckman, & Mays, Reference Holliday, Beckman, Mays, Kobayashi, Hirose and Nakamura2010; Stevens & Harrington, Reference Stevens and Harrington2016; Stuart-Smith, Reference Stuart-Smith, Cole and Hualde2007; Stuart-Smith et al., Reference Stuart-Smith, Sonderegger, Macdonald, Mielke, McAuliffe, Thomas, Calhoun, Escudero, Tabain and Warrent2019). Gender differences for /s/ have also been observed to interact with social class, with women of lower socioeconomic strata showing /s/ positions closer to men in their communities (Levon et al., Reference Levon, Maegaard and Pharao2017; Levon & Holmes-Elliott, Reference Levon and Holmes-Elliott2013; Stuart-Smith, Reference Stuart-Smith, Cole and Hualde2007, Reference Stuart-Smith2020). The interaction between gender and social class, moreover, has been fundamental in identifying the social variability of /s/, refuting earlier claims that the fronter /s/ of women is solely the result of physiological differences driven by sex differentiation (Fuchs & Toda, Reference Fuchs, Toda and Zygis2010; Stuart-Smith, Reference Stuart-Smith, Cole and Hualde2007). Recent work by Calder and King (Reference Calder and King2020) has demonstrated that race and locale interact in conditioning gender variation, with African American speakers in Bakersfield, California showing less gender differentiation in /s/ production than comparable white speakers as well as African Americans in Rochester, New York. Additionally, African American men in their study show fronter /s/ than white males in comparable studies.
The literature on /s/-retraction as a sound change points to phonetic sources of variability in /s/ that are not often considered in studies focusing on socioindexical variation. These studies have highlighted a cline of retraction across complex onsets: /s/ retracts slightly before consonants (/sC/) relative to vowels, /s/ retracts more in consonant clusters with an /ɹ/ present (/sCɹ/), and /s/ retracts most in /stɹ/ contexts (/sV/ > /sC/ > /sCɹ/ > /stɹ/, Baker et al. [Reference Baker, Archangeli and Mielke2011]). This cline of retraction is taken to be evidence of coarticulatory effects that are responsible for the widespread change in /stɹ/. Accordingly, lab-based studies find no evidence of socially conditioned variability along the cline (Baker et al., Reference Baker, Archangeli and Mielke2011; Stevens & Harrington, Reference Stevens and Harrington2016), but other work, examining conversational speech, has found that gender plays a role in retraction rates for some environments, especially /sCɹ/ (Stuart-Smith et al., Reference Stuart-Smith, Sonderegger, Macdonald, Mielke, McAuliffe, Thomas, Calhoun, Escudero, Tabain and Warrent2019). In addition to consonantal environments, there is evidence that prevocalic /s/ may be sensitive to the following vowel such that nonfront vowels result in slight retraction of /s/ (Jongman, Wayland, & Wong, Reference Jongman, Wayland and Wong2000; Podesva & Van Hofwegen, Reference Podesva, Van Hofwegen, Levon and Mendes2015; Soli, Reference Soli1981), but the social distribution of such factors is unexplored.
Since /s/ in /stɹ/ clusters tends to exhibit a larger degree of retraction than other contexts, so much so that /stɹ/ retraction has been labeled as a change in progress across many varieties, several studies have specifically examined variation and change in /stɹ/. Factors such as word position and following vowel have been claimed to condition retraction at earlier stages of the change (Durian, Reference Durian2007; Janda & Joseph, Reference Janda, Joseph, Blake and Burridge2001). For example, /stɹ/ retraction is thought to occur first in word-medial positions and then to spread to word-initial positions as the change advances. In these studies, when /stɹ/ productions fall within speakers’ acoustic distributions for [ʃ], this is taken as evidence that the change is complete within a community (Lawrence, Reference Lawrence2000; Rutter, Reference Rutter2011; Stuart-Smith et al., Reference Stuart-Smith, Sonderegger, Macdonald, Mielke, McAuliffe, Thomas, Calhoun, Escudero, Tabain and Warrent2019). In addition to these linguistic factors, several studies have examined the social distribution of /stɹ/ retraction, with inconsistent findings across communities. In particular, the role of gender is largely contradictory across studies, with either men (Bass, Reference Bass2009; Durian, Reference Durian2007; Hinrichs et al., Reference Hinrichs, Bergs, Axel, Brozovsky, Hodge, Meeman and Schultz2015) or women (Wilbanks, Reference Wilbanks2017) demonstrating greater retraction, or no gender effect (Gylfadottir, Reference Gylfadottir2015). Finally, some work has suggested that speakers in lower socioeconomic strata exhibit greater /stɹ/-retraction (Durian, Reference Durian2007; Labov, Reference Labov2001), but not enough systematic investigation of social class has been undertaken to provide strong evidence for social stratification of /stɹ/.
Variation in /ʃ/
While studies on /s/ have added to our general knowledge of sibilant variation and change, there are still many open questions about the conditioning of variation in the production of voiceless sibilants, especially for /ʃ/. Largely, /ʃ/ has been observed to be more stable and less variable than the more studied /s/ (Behrens & Blumstein, Reference Behrens and Blumstein1988; Romeo, Hazan, & Pettinato, Reference Romeo, Hazan and Pettinato2013; Stuart-Smith et al., Reference Stuart-Smith2020; Yu, Reference Yu2019). Beyond this work, however, it is unclear whether a paucity of research on /ʃ/ variation is because speakers do not make as much use of it for socioindexical meaning, because it is relatively stable over time, or, more simply, because of an omission on the part of researchers to fully investigate these issues. For example, the sound-change literature observes that change in voiceless sibilants is asymmetrical such that /s/ retracts to(ward) /ʃ/, but that /ʃ/ does not appear to front to(ward) /s/ (Stevens, Harrington, & Schiel, Reference Stevens, Harrington and Schiel2019). There are no claims in sociolinguistics that /ʃ/ is used for the same type of identity work as /s/, though of course this may be due simply to the absence of research examining /ʃ/ variation in the first place. Recent work by Stuart-Smith (Reference Stuart-Smith2020) demonstrated that /ʃ/ is changing over time for adolescent girls in Glasgow alongside changes in their /s/ category. Thus, while /ʃ/ appears to be less variable than /s/, researchers should not assume invariance in /ʃ/. Understanding variation and change at the endpoints of the sibilant space is important in its own right and can also help to contextualize changes in /stɹ/ specifically.
Variation and change across the sibilant space
From this background, it is evident that variation and change can occur throughout the sibilant space. More specifically, there are three ways change has been observed: (1) /stɹ/ retracts over time with no indication of change in /ʃ/ and /s/ in other contexts (e.g., Gylfadottir, Reference Gylfadottir2015; Rutter, Reference Rutter2011); (2) a general retraction of /s/ accompanies the change in /stɹ/ with (possible) stability in /ʃ/ (Smith et al., Reference Smith, Mielke, Magloughlin and Wilbanks2019); and (3) as /s/ retracts (across contexts), /ʃ/ may retract as well (Stuart-Smith, Reference Stuart-Smith2020). These scenarios result in potentially three different distributional outcomes for the sibilant space: reduction, increase, or maintenance of the distance between categories. The distributional differences may be observed at the community level, or different social categories may differ in sibilant space distributions. For example, prior work has observed greater degree of category distance for women than men, largely due to the fronter /s/ of women (Hazan, Romeo, & Pattinato, Reference Hazan, Romeo and Pettinato2013; Romeo et al., Reference Romeo, Hazan and Pettinato2013; Stuart-Smith et al., Reference Stuart-Smith2020). However, there has been limited examination of within-community differences with respect to the sibilant space.
This paper
Our exploration of variation and change in /stɹ/, /s/, and /ʃ/ among AAL speakers from Washington DC proceeds as follows. We first examine /stɹ/-retraction and its potential linguistic and social conditioning factors based on prior work. Then, we consider /s/ more generally, expecting from prior literature effects of gender and social class as well as phonological environment on variation. We then consider /ʃ/, asking the same questions about phonological environment, social conditioning, and change. Finally, we consider variation in the configuration of the entire sibilant space across time and social groups.
METHODS
Data
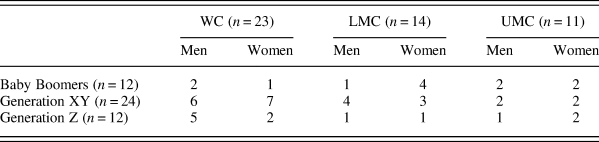
The data for this study come from the forty-eight speakers available in the Corpus of Regional African American Language's DCB component (Kendall, Quartey, Farrington, McLarty, Arnson, & Josler, Reference Kendall, Quartey, Farrington, McLarty, Arnson and Josler2018), which includes sociolinguistic interview recordings, collected between 2016–2018, of African American speakers born and currently living in Washington DC ranging in year of birth from 1948 to 2005. The corpus includes time aligned transcriptions and audio files, as well as rich metadata. Here we focus on gender and social class, as well as generational cohort based on speakers’ year of birth. As detailed in CORAAL's User Guide (Kendall & Farrington, Reference Kendall and Farrington2020), social class assignments are included in the corpus for each speaker, using three categories that roughly correspond to: Working Class (WC), Lower Middle Class (LMC), and Upper Middle Class (UMC); see Table 1 for numerical breakdown. The social class assignments were based on the fieldworker's judgment, using her knowledge of the individuals, their occupations and background, and the larger community context. Based on speakers’ years of birth, generational cohorts were defined here as Baby Boomers (1948–1961), Generation XY (1966–1992), and Generation Z (1996–2005), following Farrington (Reference Farrington2019). Throughout the paper, we use generation as a categorical factor in our analyses rather than year of birth or age. Generation captures meaningful social cohorts among speakers and allows our statistical analysis to model nonlinearities in the relationships between speaker age and sibilant realization. Empirically, generation also provided a better fit than year of birth as a continuous predictor in our assessments of statistical models for the data in the paper.
Demographic breakdown for CORAAL:DCB by Generation, Social Class, and Gender

Acoustic analysis and data processing
Several acoustic properties correlate with articulations of sibilants’ front-back dimension. We use spectral center of gravity (COG) as our dependent measure due to its observed capacity to characterize /s/ variation in prior sociolinguistic studies (e.g., Levon & Holmes-Elliott, Reference Levon and Holmes-Elliott2013; Podesva & Van Hofwegen, Reference Podesva, Van Hofwegen, Levon and Mendes2015; Stuart-Smith, Reference Stuart-Smith, Cole and Hualde2007), and its use in many studies of /stɹ/ retraction (e.g., Gylfadottir, Reference Gylfadottir2015; Wilbanks, Reference Wilbanks2017). COG values were extracted using the Integrated Speech Corpus Analysis (ISCAN; McAuliffe, Coles, Goodale, Mihuc, Wagner, Stuart-Smith, & Sonderegger, Reference McAuliffe, Coles, Goodale, Mihuc, Wagner, Stuart-Smith and Sonderegger2019) software. Stuart-Smith et al. (Reference Stuart-Smith, Sonderegger, Macdonald, Mielke, McAuliffe, Thomas, Calhoun, Escudero, Tabain and Warrent2019, Reference Stuart-Smith2020), discussed above, were cross-corpus sibilant studies that also used ISCAN.
CORAAL was prepared for ISCAN by force aligning the audio and time-aligned transcripts using the Montreal Forced Aligner (MFA; McAuliffe, Socolof, Mihuc, Wagner, & Sonderegger, Reference McAuliffe, Socolof, Mihuc, Wagner and Sonderegger2017) with a custom dictionary,Footnote 1 based on a version of the CMU pronouncing dictionary (Weide, Reference Weide1998) edited for CORAAL. Both audio and aligned transcripts were then added to the ISCAN database. The audio was high pass filtered at 1kHz. Then, measurements were taken for all instances of /s/ and /ʃ/ in word-initial and word-medial position. Since word final /s/ and /ʃ/ are sensitive to other phonological processes (e.g., consonant cluster reduction), we excluded word-final tokens. Acoustic measures (COG and duration) were computed and extracted with Praat and ISCAN by scripts developed and used in Stuart-Smith et al. (Reference Stuart-Smith, Sonderegger, Macdonald, Mielke, McAuliffe, Thomas, Calhoun, Escudero, Tabain and Warrent2019). Each token was measured at the 50% point of the sibilant interval (based on the MFA aligned transcript) using a 10ms Hamming window. Word frequency (using SUBTLEXus; Brysbaert & New, Reference Brysbaert and New2009), following environment (see individual analyses below), and word position (as word-initial or word-medial) were also coded for each token. Any instances of words without frequency counts were given a value of one, and word frequency was log-transformed for analyses. Finally, utterance speech rate, calculated as the number of syllables per utterance divided by duration of the utterance (i.e., syllables per second), was measured for each token using an ISCAN-internal syllable-counting algorithm. The resulting data were trimmed to remove any tokens with COG or peak values below 2400 Hz (following Stuart-Smith et al., Reference Stuart-Smith, Sonderegger, Macdonald, Mielke, McAuliffe, Thomas, Calhoun, Escudero, Tabain and Warrent2019, Reference Stuart-Smith2020). Any words that were not in the pronouncing dictionary were also removed before analysis (i.e., false start tokens).
A total of 27,880 tokens of /s/ (including 904 tokens of /stɹ/) and 5,549 tokens of /ʃ/ across word-initial and word-medial contexts were extracted from the recordings. For analyses, the COG measurements were z-score normalized on a by-speaker basis, where means and standard deviations were computed across all voiceless sibilants (all /s/ and /ʃ/), following prior work (e.g., Ahlers & Meer, Reference Ahlers and Meer2019; Gylfadottir, Reference Gylfadottir2015). In the modeling below, we take a primary interest in social factors and following environment but include the additional factors described above—speech rate, duration, word frequency, and word position—as control variables to avoid overestimating social effects, as they are factors that have been suggested to affect sibilant realization.
RESULTS
Descriptive results
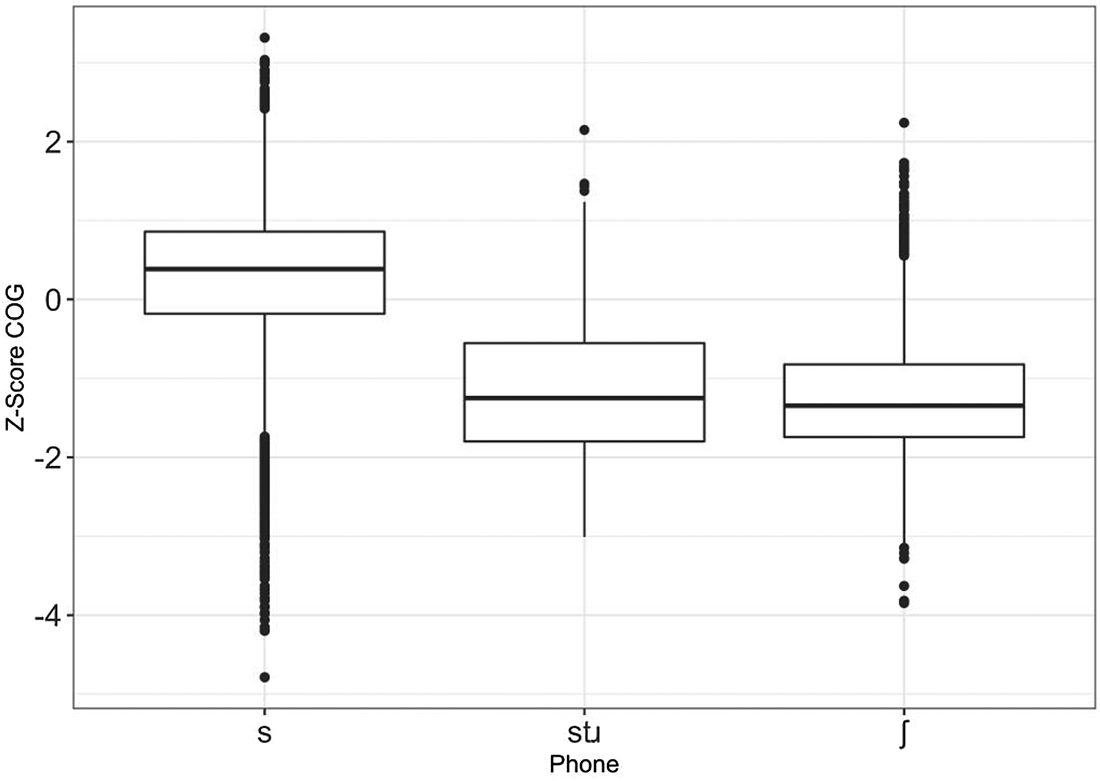
We begin with brief group-level observations about the degree of /stɹ/ retraction in this community to better contextualize the statistical analyses to follow. Table 2 provides summary statistics of sibilants’ COG in raw Hz across three contexts (/s/, /stɹ/, /ʃ/) by social factors of interest; findings for the remainder of the paper are represented in z-scored space. Figure 1 represents the sibilants’ z-scored COG positions in three contexts (/s/, /stɹ/, /ʃ/) across all speakers, and shows evidence of retraction in /stɹ/ contexts. That is, the overall distribution for /stɹ/ COGs is similar to speakers’ /ʃ/ distributions, in line with observations in communities where the change is near completion (e.g., Lawrence, Reference Lawrence2000; Rutter, Reference Rutter2011; Smith et al., 2020). Following Baker et al.'s (Reference Baker, Archangeli and Mielke2011) definition of retracted tokens, where /stɹ/ COG is ≥ 75.5% of the distance from the speaker's /s/ to /ʃ/, thirty-four out of forty-sevenFootnote 2 speakers (72.3%) show retracted mean /stɹ/ values. Interestingly, 67.6% of the retracted speakers have mean /stɹ/ COGs actually below their mean /ʃ/ (n = 23; 48.9% of all speakers). Finally, Baker et al. (Reference Baker, Archangeli and Mielke2011) identified that the “nonretractors” in their data have /stɹ/ COGs at 48.6% of the distance between their /s/ and /ʃ/ categories; all speakers here exceed this benchmark, meaning that all of the CORAAL:DCB speakers show a greater degree of retraction than the nonretractors in Baker et al.'s data. Overall, we find strong initial evidence of /stɹ/ retraction within the community.
Z-scored COG by category across all speakers and tokens in CORAAL:DCB.

Mean and standard deviation (SD) COG in raw Hz for each social grouping, by singleton /s/ and /ʃ/, and /stɹ/ tokens

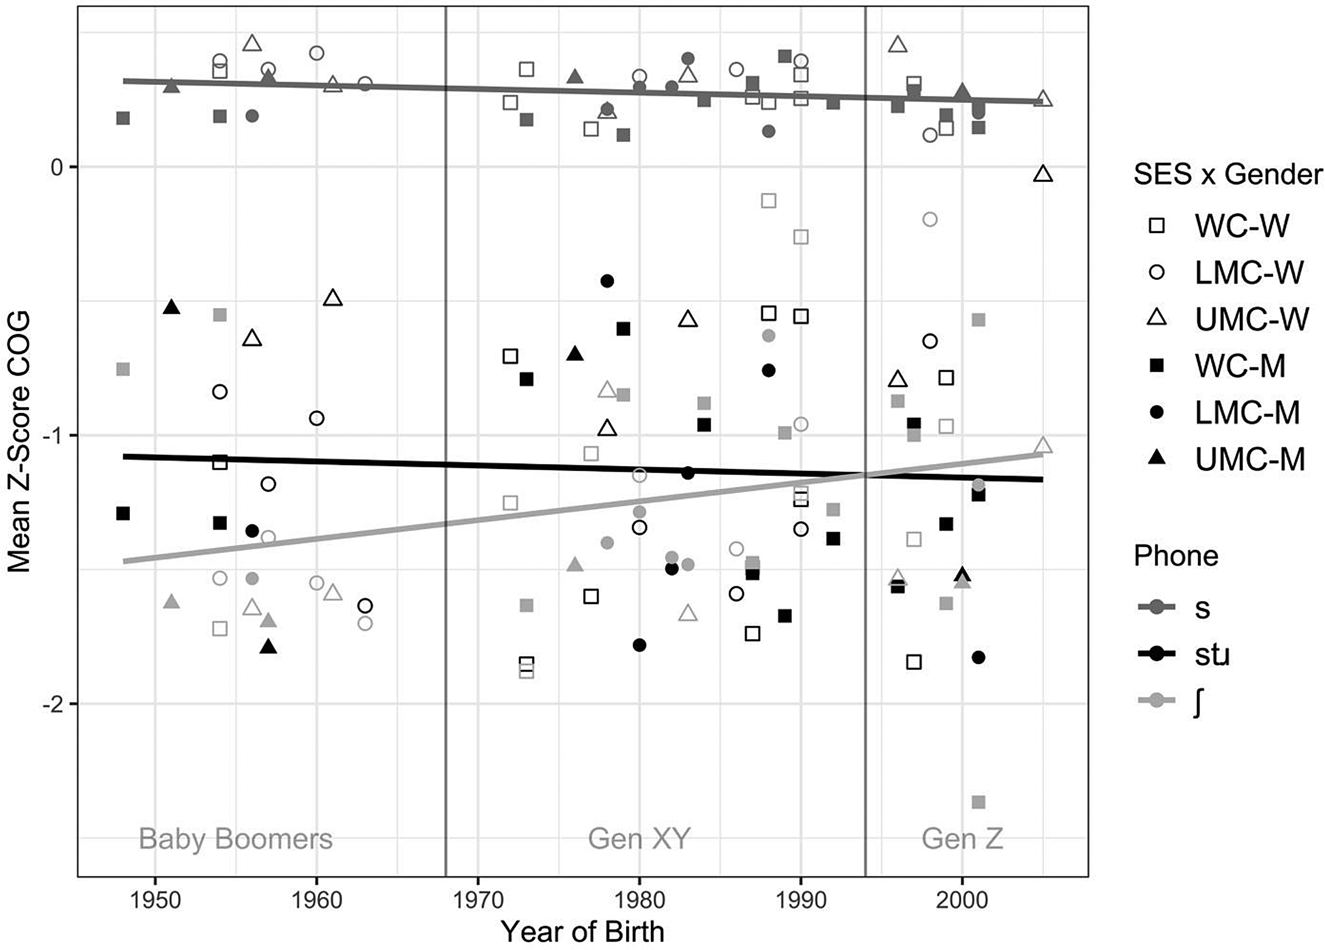
Figure 2 further illustrates /stɹ/ retraction in the data, by presenting individual speakers’ mean z-scored /stɹ/, /s/, and /ʃ/ positions. Though we use generation in the statistical analyses, individuals are plotted here by year of birth, with generational cohorts indicated with vertical lines. In addition to the overall retraction of /stɹ/, Figure 2 indicates evidence of /s/ retracting slightly and /ʃ/ fronting over time, points we explore further below, along with their social and linguistic conditioning (See section Analysis: /s/ & /ʃ/). As might be expected, we observe individual variability in sibilant spaces, including some speakers who appear to be more extreme in their productions. While a full consideration of individual speakers’ patterns is beyond the scope of this paper, we provide density plots of individuals’ sibilant spaces in the Appendix to provide a more complete picture of speaker variability, and we return to individuals briefly in the discussion.
Individual speakers’ mean z-scored COG for each phone type, illustrating speakers’ mean sibilant spaces. Each phone category (shading) is represented with a line of best fit. Social class (shape), and gender (fill) are included as the social factors of interest. Vertical lines represent breaks in YOB corresponding to generational cohorts.

Analysis: /stɹ/
We now examine more specific questions about /stɹ/ variation and change in this dataset. We specifically investigate whether /stɹ/ exhibits change in apparent time (as indicated by generation) and whether gender, social class, and linguistic factors (following environment and word position) predict /stɹ/ retraction. Since the change appears to be at (or near) completion, it may be that linguistic factors and generation will not significantly predict /stɹ/ position for this community.
To examine these factors, we used linear mixed effects regression models built in R (R Core Team, 2020) using the lme4 library (Bates, Sarkar, & Bates, Reference Bates, Sarkar, Bates and Matrix2007). Here we used only /stɹ/ tokens with z-scored COG as the dependent variable. Fixed effects of primary interest included gender, social class, word position, and following environment. Log word frequency, phone duration, and speech rate were also included as fixed effects as control variables (and are only discussed briefly below). Gender, word position, and following environment were scaled using the rescale function in the arm package (Gelman, Su, Yajima, Hill, Pittau, Kerman, Zheng, & Dorie, Reference Gelman, Su, Yajima, Hill, Pittau, Kerman, Zheng and Dorie2020), which scales binary variables by centering around a mean of zero and a difference of one between categories. Following environment was coded as either a high front vowel (stɹ + high front [n = 576]) or a nonhigh front vowel (stɹ -high front [n = 328]) based on Gylfadottir (Reference Gylfadottir2015). Social class was reverse helmert coded, testing whether the UMC was different from the LMC and whether the WC was different than the mean of the LMC and UMC. This coding scheme was used for both /stɹ/ and /s/ (Analysis: /s/ section) models. Our interest in comparing the WC against the LMC and UMC was based on previous work, which has suggested that both /stɹ/ (Durian, Reference Durian2007; Labov, Reference Labov2001) and /s/ (Levon et al., Reference Levon, Maegaard and Pharao2017; Levon & Holmes-Elliott, Reference Levon and Holmes-Elliott2013; Stuart-Smith, Reference Stuart-Smith, Cole and Hualde2007, Reference Stuart-Smith2020) show more retraction in lower socioeconomic strata, aligning roughly to WC speakers in our sample. Our comparison between the LMC and UMC is meant to assess whether even finer stratification is apparent among the higher socioeconomic speakers. Generation was treatment coded, with Baby Boomers, the oldest generation of speakers, as the reference level. All numerical factors were centered and scaled, and the model included random intercepts for word and speaker. We tested for two-way interactions of interest and then reduced to main effects when interactions did not improve model fit, based on maximum likelihood comparisons with p > 0.05. For ease of interpretation and model parsimony we did not test for three-way interactions. We tested for random slopes across all models but reduced to random intercepts only as the inclusion of random slopes led to failures in model convergence.
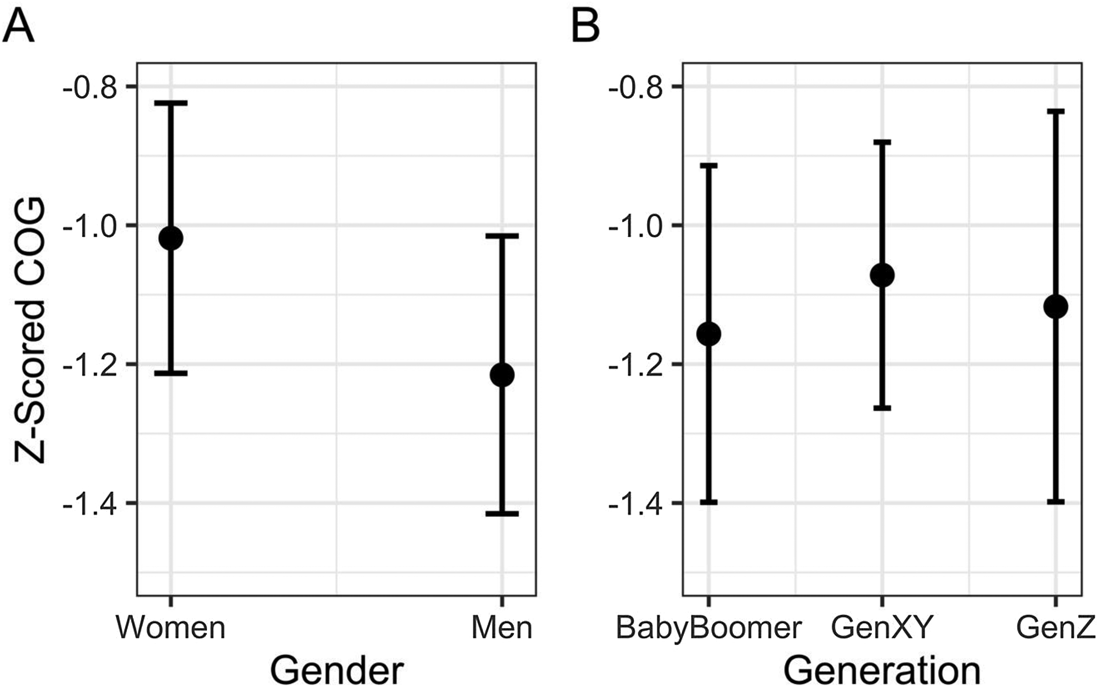
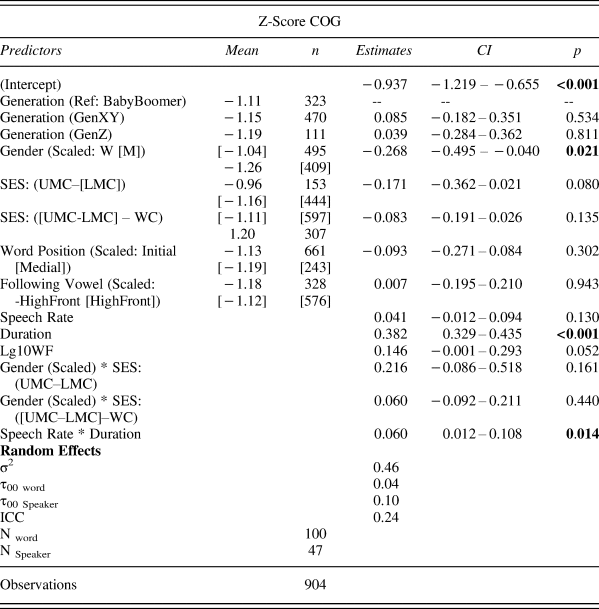
The final model included all main effects above and an interaction between speech rate and duration. There were significant main effects of gender and duration, and a significant interaction between speech rate and duration; all other fixed effects were nonsignificant. We begin with a brief description of the results for the control variables. As the duration of the phone increased, /stɹ/ became more fronted (p < 0.001); this finding is in line with prior work (Stuart-Smith et al., Reference Stuart-Smith2020). Duration interacted with speech rate such that for phones with relatively short duration, as speech rate increased, /stɹ/ maintained rates of retraction (p < 0.05). All other control variables were nonsignificant in the model. Full model output can be found in Table 3. Moving to the effects of primary interest to the study, we note the significant main effect of gender. The gender effect (Figure 3A) demonstrates that men had lower z-scored COG (i.e., more retraction) for /stɹ/ than women (p < 0.05). Notably, generation was not significant (Figure 3B), indicating that there was not a change in apparent time for /stɹ/ in this corpus, but that /stɹ/ is a stably retracted variant. Further, previously hypothesized linguistic factors, including word position and following environment, do not surface as significant predictors of /stɹ/ variability, adding evidence to the observation that /stɹ/ retraction is not an active change in this community but rather is at or near completion.
A: predicted values for Gender from LMER model of /stɹ/; Gender is significant (p < 0.05). B: Predicted values for Generation; Generation is not significant. Note that Gender is scaled in the model, but we have plotted the term categorically here for ease of interpretation.

/stɹ/ model output, p-values calculated via Wald-t test. Mean z-scored COG and n provided where appropriate with values indicated for each level of coding (brackets match bracketed level in predictors column)

Analysis: /s/
To better understand how /stɹ/ retraction is realized as part of the larger phonological system of voiceless sibilants, we consider /stɹ/ in the context of the rest of the /s/ category. Here we examine to what extent other /s/ environments show indications of variation or change.
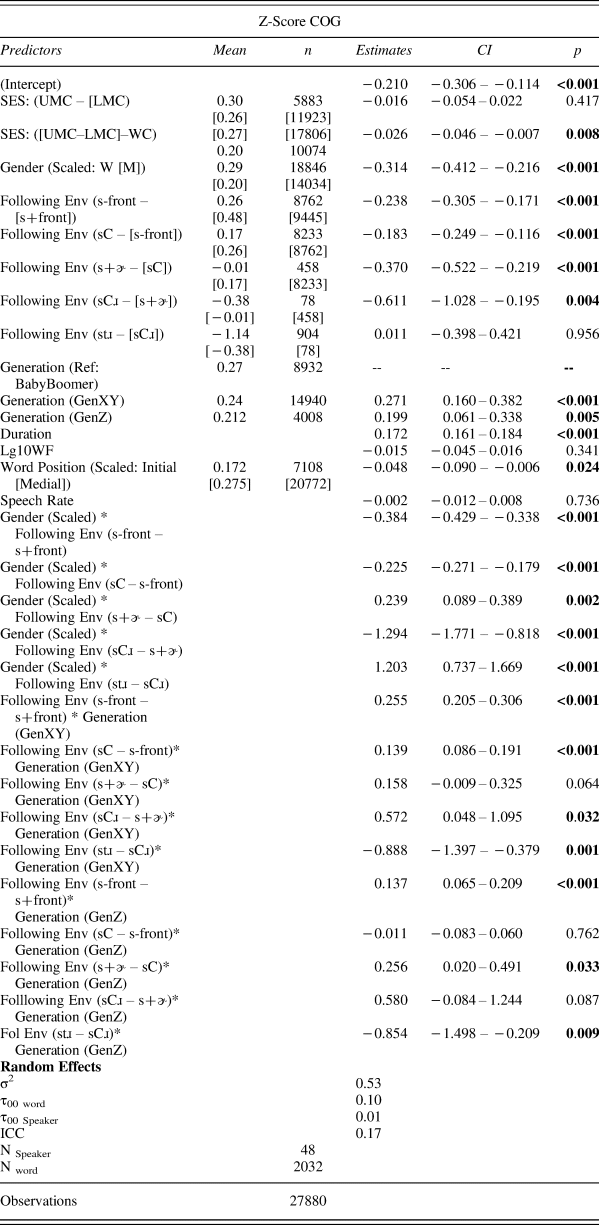
Modeling of /s/ followed methods described for /stɹ/ (see section Analysis: /stɹ/), here using all /s/ tokens as the input to the model, with different coding for following environment indicated throughout. Once again, random slopes resulted in the model's failure to converge, leaving a random intercepts only model. The model included main effects for social class, generation, and following environment, with word position, log word frequency, speech rate, and duration included as control variables in the model. Following environment was coded following prior work that observed the following cline of retraction (from least to most retraction): /s/ + front vowels < /s/ + nonfront vowels < /s/ + consonant < /s/ + consonant + r < /stɹ/ (Baker et al. [Reference Baker, Archangeli and Mielke2011] for consonant environments; Soli [Reference Soli1981] for vowel environments). To these five categories we added /s/ + r-colored vowels, not present in prior work, which we grouped alongside the other rhotic categories. Thus, we used successive difference coding to test whether each level is significantly more retracted than the previous level, with s + front as the reference level: s + front vowel [s + frontV, n = 8762], s + nonfront vowel [s-frontV, n = 9445], s + C [sC, n = 8233], s + r-colored vowel [s+ɚ; n = 458]), s + C + r [sCɹ, n = 78], and s + t + r [stɹ, n = 904]). We note here that the token count for /sCɹ/ is quite low and interpret results involving this environment with caution.
After testing for potential two-way interactions, the model included interactions between generation and following environment and between gender and following environment. Along with the two interactions, there were significant main effects for generation, gender, duration, and word position. The significant interactions are illustrated in Figures 4–5, and the full model output is provided in Table 4. First, results from the control variables indicate significant effects of duration (p < 0.001) and word position (p < 0.05). The duration effect followed /stɹ/ patterning, whereby tokens that were longer in duration had a more fronted position. The word position effect demonstrates that word-medial tokens showed significantly more retraction than word-initial tokens. The remaining control variables, word frequency and speech rate, were not significant.
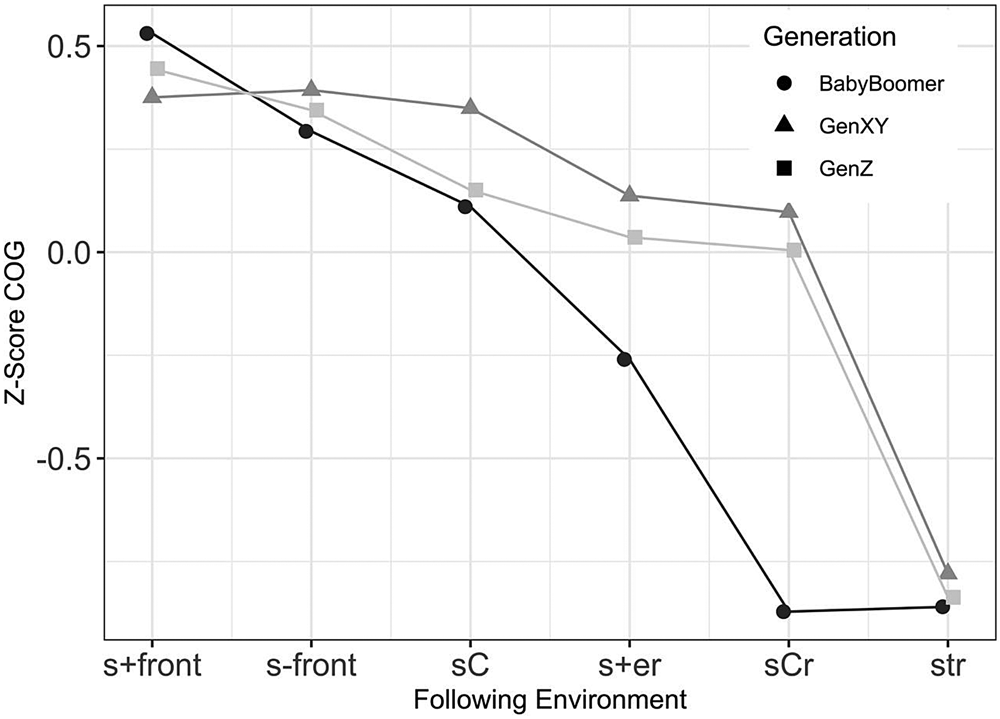
Predicted values of significant interaction term for Generation and Following Environment from /s/ LMER model.

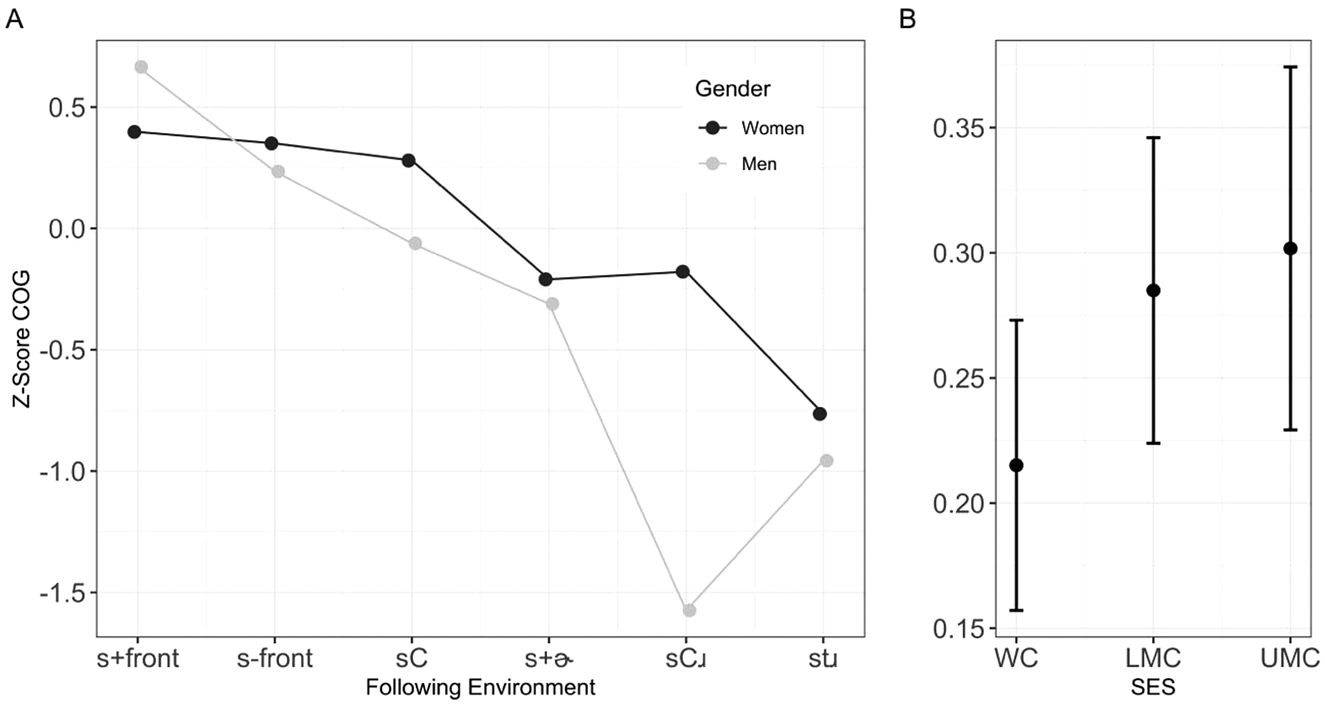
A: Predicted values of the significant interaction between gender and following environment from /s/ LMER model; B: Predicted values for significant main effect of social class from /s/ LMER model.

/s/ model output, p-values calculated via Wald-t test. Mean z-scored COG and n provided where appropriate, with values indicated for each level of coding (brackets match bracketed levels in the predictors column)

Considering the effects of primary interest, we begin by examining whether /s/ is changing over time. Although there was no evidence of change of /s/ in /tɹ/ contexts, for /s/ across all contexts there is a main effect of generation showing a curvilinear pattern, where /s/ was most retracted for Baby Boomers (lowest COG values in Figure 4), followed by a fronting in Generation XY (p < 0.05, highest values), and then a retraction for Gen Z, similar to the Baby Boomers (p < 0.01). The significant interaction between generation and following environment, however, provides more clarity about changes occurring in the realization of /s/. Generation XY and Generation Z showed significantly less retraction than Baby Boomers across most phonological context contrasts (p < 0.05 for both; except contrasts s+ɚ – sC for Gen XY, and sC – s+front and sCɹ – s+ɚ for Gen Z). Notably, retraction was variable by context and generational cohort. For example, Generation XY and Generation Z resisted retraction in /sCɹ/ and /s+ɚ/ contexts compared to Baby Boomers. Additionally, /s/ + r-colored vowels behaved similarly to /sCɹ/ contexts, except for Baby Boomers where /sCɹ/ (n = 20) aligns with /stɹ/ contexts, though again we note the low n. Overall, these results demonstrate that not all phonological contexts of /s/ are stable in apparent time, and in fact most of the /s/ changes in this community have been in contexts other than /stɹ/.
We used the same model to examine the extent to which gender and social class condition /s/ variability. In terms of gender, the model showed a significant main effect such that men tended to have more retracted /s/ across contexts (p < 0.001). The model also identified a significant interaction between gender and following environment (Figure 5A). The interaction again demonstrates that men in the community tended to retract more across contexts, with the exception of high front vowels, where women retracted more (p < 0.05). Generally, women adhered more closely to the cline of retraction observed in prior work, while men demonstrated a reversal from Baker et al.'s (Reference Baker, Archangeli and Mielke2011) observations in one point on the cline, with greater retraction particularly in /sCɹ/ (n = 46) contexts whereby /sCɹ/ is lower than /stɹ/, though again we note the low token count in the /sCɹ/ environment. That gender differences are observed in /s/ across any phonological contexts suggest that socioindexicality may differ by phonological context.
There was also a significant main effect of social class (Figure 5B), indicating that LMC and UMC speakers showed fronter /s/ than the WC (p < 0.05), but UMC speakers’ /s/ was not significantly different from LMC (p = 0.417). Overall, we see social stratification in productions of /s/, with the WC speakers and men showing greater retraction.
Analysis: /ʃ/
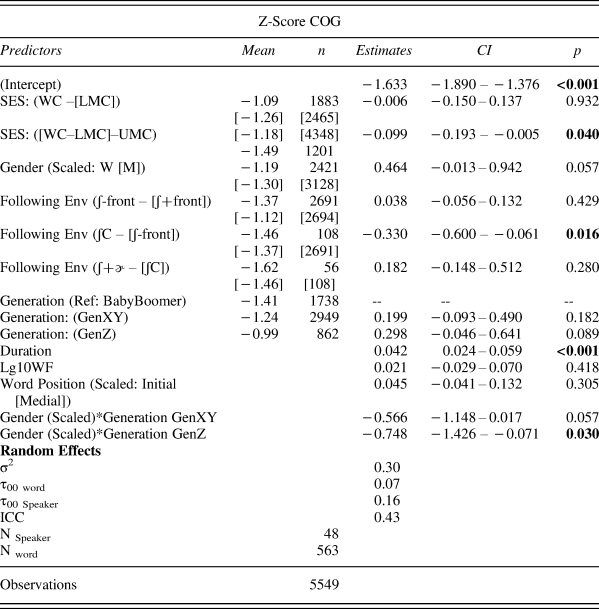
We now report on our analysis of /ʃ/. Modeling of /ʃ/ also followed most of the same methods described in the analysis section for /stɹ/ but with /ʃ/ tokens as input. Once again, random slopes resulted in the model's failure to converge, so the model only included random intercepts. The model included main effects for gender, social class, and following environment, with word position, logged word frequency, speech rate, and duration included as control variables. Unlike the treatment of social class in the previous models, for our analysis of /ʃ/, social class was helmert coded, testing the comparison between the WC and the LMC, and then the UMC against the mean of the WC and LMC. This decision was based on an interest in probing preliminary observations in the data that the UMC speakers may be realizing different patterns for /ʃ/ than the other socioeconomic groups (see Figure 2 and the Appendix). Following environment was coded with 4 levelsFootnote 3: ʃ + front vowels (ʃ+frontV, [n = 2694]), ʃ + nonfront vowels (ʃ-frontV, [n = 2691]), ʃ + following consonant (ʃC [n = 108]), ʃ + r-colored vowels (ʃ+ ɚ, [n =56]). Due to limited tokens of /ʃɹ/ (n = 2), we include them in the ʃC category. While prior literature does not indicate a clear cline of /ʃ/ retraction as it does for /s/, we anticipate similar phonetic contexts may exert similar pressures on /ʃ/. Therefore, the four levels of following environment were also successive difference coded here, in the order listed above. After testing for two-way interactions, the model included an interaction between generation and gender. There were significant effects of duration and social class, along with the significant interaction between gender and generation. Beginning with control variables, duration again shows the same trend as previous models whereby tokens longer in duration showed more fronting (p < 0.001). All other control variables were not significant, including word position, word frequency, and speech rate. Additionally, there was not a significant main effect of following environment on /ʃ/. The significant interaction and main effects are presented in Figure 6, and the full model output is provided in Table 5 below.
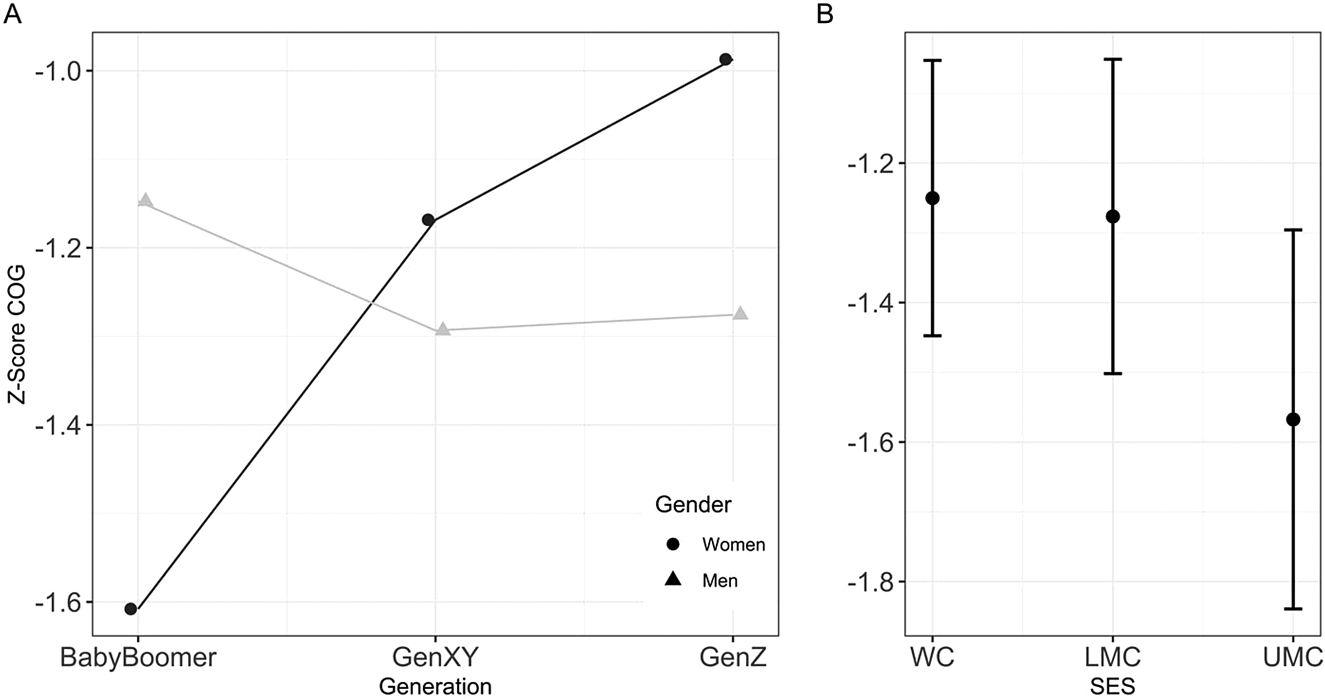
A: Predicted values of significant interaction term of Gender and Generation from /ʃ/ LMER model; B: Predicted values for significant main effect of social class.

/ʃ/ model output, p-values calculated via Wald-t test. Mean z-scored COG and n provided where appropriate. Means and ns indicated for contrast coded levels. Bracketed values align with the bracketed levels in the predictors column

We first examine whether /ʃ/ production has changed over time. There was not a significant main effect of /ʃ/ by generation. However, there was a significant interaction between generation and gender indicating that /ʃ/ is fronting over time for women, as visible in Figure 6A. In particular, Generation XY showed fronter /ʃ/ realizations than the Baby Boomer women (though not reaching statistical significance; p = 0.057), and Generation Z women showed significantly fronter /ʃ/ than Baby Boomer women (p < 0.05). We also observed a significant main effect for social class (Figure 6B), in which UMC speakers showed more backed /ʃ/ than the WC and LMC speakers together (p < 0.05). There was no significant difference between the LMC and WC speakers (p > 0.05).Footnote 4 That is, for /ʃ/, WC and LMC speakers tended to pattern together, and UMC speakers pattern distinctly (Figure 6B). In contrast, for /s/, LMC and UMC speakers exhibited more fronting, while WC speakers showed more retraction (Figure 5B). Overall, then, WC speakers appear to have more proximal sibilant categories (more retracted /s/ and more front /ʃ/), while the UMC speakers’ categories are more distant (fronter /s/ and more retracted /ʃ/), with LMC falling somewhere in between.
Analysis: The sibilant space as a whole
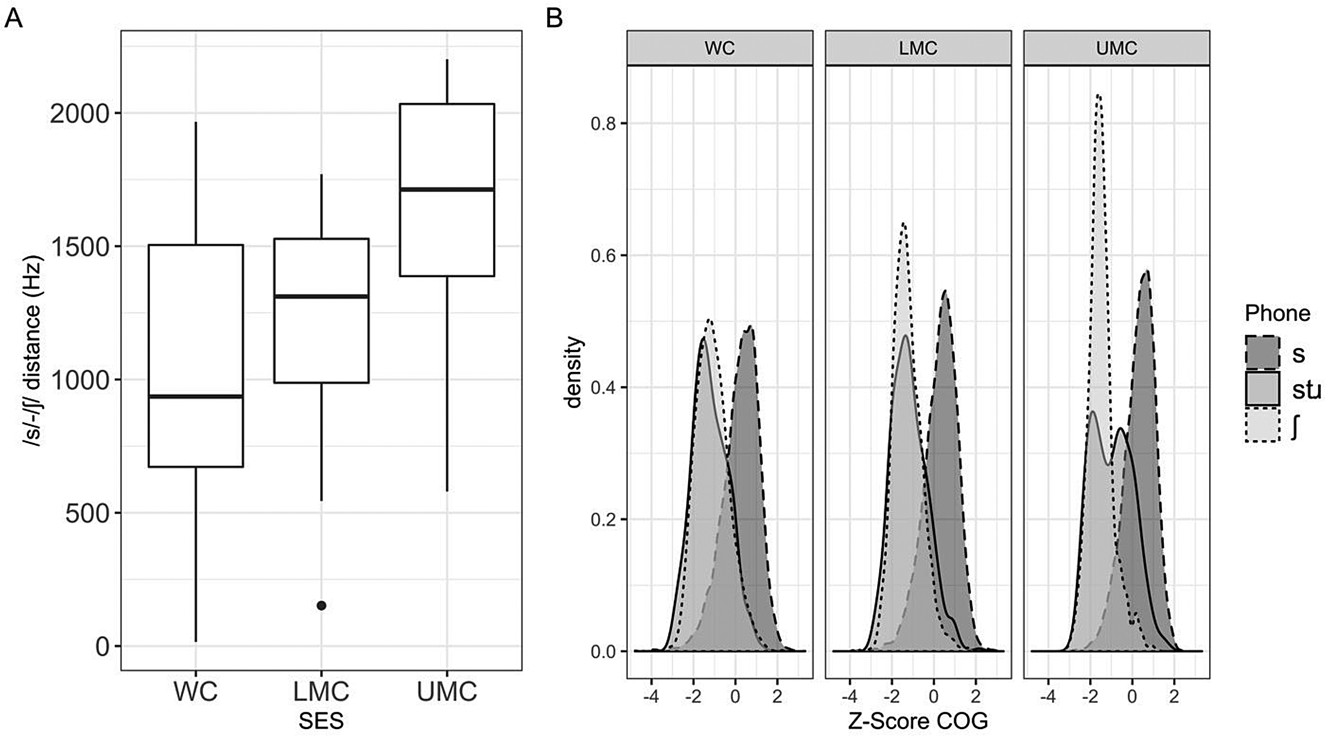
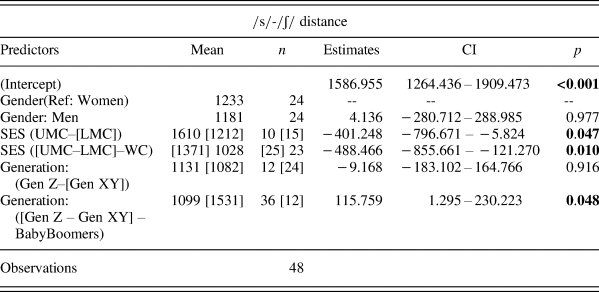
Altogether, the patterns uncovered for /s/, /stɹ/, and /ʃ/ suggest variation in the positional distribution of the sibilant space across different social categories and over time. To test for the significance of these differences, we ran a linear model with speakers’ COG of /s/-/ʃ/ distance in Hz as the dependent variable, and main effects of gender, social class, and generation.Footnote 5 Raw Hz was used here rather than z-scored COG to capture individuals’ differences in sibilant space, which otherwise may be normalized out in z-scored space. The results showed that Generation was a significant predictor of /s/-/ʃ/ distance (p < 0.05), confirming observations from previous models indicating a narrowing in the sibilant space over time with Generation XY and Generation Z having smaller sibilant spaces than Baby Boomers (p < 0.05). There was also a significant difference in /s/-/ʃ/ distance between UMC speakers and LMC speakers (p < 0.05) as well as a significant difference between the middle classes (UMC and LMC) and WC (p < .05; full model output presented in Table 6; results summarized in Figure 7A). We also note here that, although social class was not a significant predictor of /stɹ/ retraction specifically, overall narrower sibilant spaces associated with lower social classes appear to also involve more /stɹ/ retraction (Figure 7B), with the UMC demonstrating a wider range of (and perhaps bimodal) variation in /stɹ/ productions. This observation has implications for /stɹ/ as a sound change, which we discuss in more detail below.
A: Raw /s/-/ʃ/ distance per speaker (n = 48) in Hz grouped by social class; B: Density plot of /s/ and /ʃ/ z-score COG across all tokens and speakers grouped by social class.

/s/-/ʃ/ distance (Hz) linear regression model output. Mean /s/-/ʃ/ distance and n for each level of the predictors included. Bracketed values align with the bracketed levels in the predictors column

DISCUSSION AND CONCLUSION
Overall, our findings indicate that /stɹ/ retraction appears to be a stable presence in Washington DC African American Language. Additionally, these data exhibit that the retraction of /stɹ/ is at an advanced stage in this community, with the loss of initial linguistic conditioning factors, and evidence of many speakers retracting /stɹ/ even beyond their mean /ʃ/ positions. In addition, we observed that variation and change in voiceless sibilants is not limited to /stɹ/. For example, men realized more retracted /s/ than women overall, but working class women showed /s/ positions in line with men. The overall retraction of /s/ in Baby Boomers and the working class suggests that /s/ retraction may be indexing a local and older vernacular form in Washington DC AAL. These findings, coupled with the patterns uncovered in Calder and King's (Reference Calder and King2020) analysis of two AAL communities, invite additional research on sibilants across varieties of AAL in particular.
We also observe differences in the degree of retraction among different phonological contexts. In particular, /sCɹ/ contexts were also retracted for Baby Boomers and for men. While limited /sCɹ/ token counts prevent us from making more definitive conclusions, the socioindexical potential of /sCɹ/ has also been observed in other work. Stuart-Smith et al. (Reference Stuart-Smith, Sonderegger, Macdonald, Mielke, McAuliffe, Thomas, Calhoun, Escudero, Tabain and Warrent2019) also found men retracting in /sCɹ/ contexts and suggested it may have a socioindexicality linked to gender identity. This is further supported by Phillips and Resnick (Reference Phillips and Resnick2019), who proposed that listeners use concepts of masculinity and toughness when categorizing retracted /sCɹ/ but not /stɹ/ tokens. These findings suggest that more work on the community-level socioindexicality of /s/ retraction, across different phonological contexts and social categories, is warranted.
The data here also demonstrate changes in /ʃ/, suggesting that /ʃ/'s reduced variability relative to /s/ observed in prior work (e.g., Romeo et al., Reference Romeo, Hazan and Pettinato2013; Stuart-Smith et al., Reference Stuart-Smith2020) does not necessitate invariance or stability across varieties of English. For example, we observed that /ʃ/ is fronting over time for women in this dataset. Stuart-Smith (Reference Stuart-Smith2020) observed changes in /ʃ/ in Glasgow, as well. However, Glasgow /ʃ/ changes largely coincided with /s/ changes such that as /s/ became more [ʃ]-like, speakers’ /ʃ/ also retracted. In our data, working-class speakers exhibiting retraction in /s/ also show fronting of /ʃ/, resulting in a narrower sibilant space. Thus, importantly, sibilant space organization is not only a function of a speaker's fronter /s/, as some work has observed (e.g., Romeo et al., Reference Romeo, Hazan and Pettinato2013), but rather may involve contributions from both /s/ and /ʃ/ categories. That is, /ʃ/ is not necessarily a stable lower bound but may also vary.
We suggest that the way that analysts characterize patterns in /stɹ/ retraction may largely depend on how they conceptualize the rest of the system. When we focus solely on changes in /stɹ/ by assuming /s/ and /ʃ/ endpoints (i.e., normalizing out varying distributions of /s/ and /ʃ/), we may be obscuring which categories are changing or varying and how /stɹ/ relates to the overall distributions of sibilants. We find, for example, that the working-class speakers in our study had the smallest distance between /s/ and /ʃ/ and also more /stɹ/ retraction. Although there are many remaining questions to ask about the nature of this relationship, this observation has implications for our understanding of the sound change. For example, Stevens et al. (Reference Stevens, Harrington and Schiel2019:11) suggested that an individual's split of /stɹ/ from /s/ (e.g., an intermediate /stɹ/ form), or merger of /stɹ/ with /ʃ/, is more likely to occur if speakers have more proximal /s/-/ʃ/ in acoustic space (as is the case for our working-class speakers). Therefore, the distributions of the rest of the sibilant space are relevant for examinations of /stɹ/ retraction across communities and social groups within communities. However, in our data, the apparent bimodality of the upper middle class /stɹ/ distribution (Figure 7B) suggests that smaller sibilant spaces alone are not completely responsible for greater /stɹ/ retraction, as an initial inspection of the distributions of individual upper middle- class speakers reveals that many of these speakers who appear to have /stɹ/ merged with /ʃ/ do not have particularly narrow sibilant spaces.
Although examining intraspeaker variation was not the goal of this study, we believe that distributional patterns of individual speakers warrant investigation in future work. As can be seen in the plots of the individual speakers’ distributions in the Appendix, the bimodality in the upper middle class /stɹ/ category appears to be based both on the fact that some individual speakers show bimodality in their /stɹ/ productions (and others show a less bimodal but quite wide distribution), and on the fact that upper middle-class speakers with more unimodal distributions vary whether their /stɹ/ category is more or less retracted. Our preliminary analyses found no clear word-level or linguistic factors conditioning the distributions, including for those speakers who are most extreme in their productions. Additionally, the bimodality of individual speakers is not completely restricted to the upper middle class, as several speakers across the lower middle and working class also demonstrate similar distributional properties. Thus, we observe many ways that the sibilant space is instantiated among speakers, and we encourage future work on sibilant variation and change to consider intraspeaker variation across the sibilant space.
To conclude, we find socially conditioned variation and change in Washington DC AAL in voiceless sibilants beyond just /stɹ/. This work demonstrates that the sibilant space may show different configurations and distributions within a community, and that research should consider the larger phonological system when examining phonetically motivated changes like /stɹ/ retraction. Our closer examination of gender and social class suggests that mechanisms of change in /stɹ/ should be considered relative to the distributions of /s/ and /ʃ/ categories across individuals and groups. That is, beyond /stɹ/, the larger sibilant system exhibits complex patterns of variation and change.
ACKNOWLEDGMENTS
We would like to thank the SPADE research team, especially Michael McAuliffe, whose technical support and skill contributed to our data extraction in ISCAN. We also want to thank Charlie Farrington for feedback and helpful discussion, as well as the audience at NWAV 48. Finally, thank you to Volya Kapatsinski, Melissa Redford, and the anonymous reviewers. The Corpus of Regional African American Language (CORAAL), the source for our data, was developed with support from National Science Foundation grant # BCS-1358724.
APPENDIX
Density plots of individual speakers’ z-scored Center of Gravity of /s/, /ʃ/, and /stɹ/. Vertical lines represent individual means for each category, aligning with the line type of the density curve. (Speaker DCB_se1_ag1_m_05 does not have any tokens of /stɹ/ and is not included in the /stɹ/ model. Two other speakers, DCB_se1_ag1_f_02 and DCB_se1_ag1_m_04, do not have enough observations to fit a probability curve, but their mean /stɹ/ category is nonetheless indicated by a vertical line and both speakers were included in the /stɹ/ modeling.)