

Introduction
The design, implementation and evaluation of social policies require valid and reliable tools to monitor achievements and setbacks in the complex processes of social intervention with people experiencing or at risk of social exclusion.
Since the end of the 1970s, when Lenoir (Lenoir, Reference Lenoir1974) published his work L’exclus. Un français sur dix, the term social exclusion has been extended to refer to the process by which individuals or groups are excluded from participation in societal well-being. It seeks to capture a multidimensional reality that goes beyond the economic dimension of poverty.
The use of the term social exclusion began from its institutionalisation in the European Economic Community (EEC) with the “Community action programme concerning the economic and social integration of the economically and socially less privileged groups in society: Poverty 3 (1989-1994)”. This was a qualitative leap, aimed at a multidimensional approach that brought complexity to the concept of poverty, although without clearly stating the dimensions that make up exclusion (Arriola, Reference Arriola2014).
Shared objectives for the fight against social exclusion were approved at the Nice European Council in December 2000, calling on Member States to develop policies and national action plans for social inclusion. Following the reports evaluating this type of programme, the Council of Europe (2001) noted a wide range of factors affecting poverty and social exclusion: employment, social protection, housing, education, health, information and communication, mobility, security and justice as well as leisure and culture.
The EU’s fight against poverty and social exclusion is pursued through structural funds, in particular the European Social Fund, with the aim of promoting a high level of employment, gender equality, sustainable development, economic growth and EU competitiveness. It is articulated through the Operational Programmes at the national or regional level. These programmes provide financial support to projects that are aligned with regional priorities for social inclusion.
Within the framework of this line of action, the Regional Government of Castilla-La Mancha, one of Spain’s seventeen Autonomous Communities, with a population of 2,035,000 people, is promoting the design of a tool for diagnosing situations of social exclusion, as it has noted the difficulty of establishing common criteria for the assessment of such situations by professionals in primary care teams within social services. The objectives of this initiative are: (a) To support the diagnosis of situations of exclusion and the monitoring of social interventions, identifying progress towards changing the situation and the life domains in which it occurs; (b) To adjust criteria for improved access to specific benefits in the social services, housing and employment system; (c) To produce indicators to guide policies, programmes and resource allocation at the regional, provincial and local levels.
In this way, the aim is to provide technical instruments for social intervention and social policy management processes, providing valid and reliable information on the social conditions of people who are experiencing or are at risk of exclusion and who are being assisted by social services. Within this research context, the objective of the work was to design a new tool called the SiSo Scale, an acronym for “Social Situation Scale” in Spanish, and to analyse its metric properties. Having measurement tools that allow social service professionals to analyse a family’s situation of social difficulty in terms of inclusion and exclusion is an essential aspect for decision making and optimization of management of social policies.
This article presents the process of validating the SiSo Scale as a diagnostic tool that provides a synthetic index of Social Position. The scale was designed and implemented in the Regional Government of Castilla-La Mancha through a collaboration agreement between the Department of Social Welfare and two Spanish universities, financed by the European Social Fund, through the Operational Programme of Castilla-La Mancha 2014-2020 within the line aimed at promoting social inclusion and fighting poverty and any form of discrimination. This project has been presented as a good practice at the 3rd European Social Fund Forum organised by the European Social Fund Administrative Unit of the Spanish Ministry of Labour, Migration and Social Security.
Measurement of social exclusion
Poverty and social exclusion are complex phenomena and their measurement requires a multidimensional approach (Alkire and Foster, Reference Alkire and Foster2011; Arndt et al., Reference Arndt, Distante, Hussain, Østerdal, Huong and Ibraimo2012; European Commission, 2017). However, in the operationalisation of the concept, since the first European Commission reports in 2001 and 2003, measurement has focused on material deprivation and labour market participation rather than on social, political or cultural dimensions (Silver, Reference Silver2007). While the 2005 report stressed the need to better capture the multidimensional nature of exclusion, the AROPE (At Risk of Poverty and/or Exclusion) indicator maintains the predominance of the economic-employment dimension, through three sub-factors closely linked to the economic dimension. Thus, what is measured is poverty from a multidimensional perspective, but not social exclusion, based on income level (poverty line), participation in production (working hours) and consumption (severe material deprivation). The confusion is widened by the adoption of the expression “at risk of poverty” to refer to the situation of people with an income under 60% of a national median of equivalised income. This “entails a political solution to the conflict of whether or not to identify this group as poor” (Zugasti and Laparra, Reference Zugasti and Laparra2017, p. 121). It is intended to point out that the operational definition of AROPE lacks precision insofar as it is not able to differentiate between poverty and exclusion. Hence the need to build more precise instruments.
While poverty is at the centre of the official European Union social indicators, academia and consultancy tend to broaden the dimensions of analysis and incorporate aspects such as the progressive breakdown of social relations, exclusion from public services, perception of neighbourhoods, psychological well-being, as well as a wide range of possibilities for exclusion from social relations, measured in terms of participation in community activities, isolation, lack of social support, political commitment and civic disconnection. These are studies based largely on cross-sectional microdata that capture a diverse set of dimensions of social exclusion and then examine their interrelationships (Silver, Reference Silver2007).
It is worth noting the various analytical works on the methodology for measuring poverty and exclusion (Chakravarty and D’Ambrosio, Reference Chakravarty and D’Ambrosio2006; Besharov and Couch, Reference Besharov and Couch2009, Reference Besharov and Couch2012; Burkhauser, Reference Burkhauser2009; Treanor, Reference Treanor2014). In general, the economic aspect of the former and the multidimensional aspect of the latter are recognised. However, there is no consensus on the aspects to consider in the study of exclusion. Hence, some works focus on the economic dimension (Johnson, Reference Johnson2009; Bavier, Reference Bavier2009; Alkire et al., Reference Alkire, Foster, Seth, Santos, Roche and Ballon2015) while others touch on different aspects related to exclusion.
Social exclusion has been approached from several perspectives. On the one hand, there are those who analyse access (or lack of access) to institutional resources as a measure of social exclusion. Along these lines, Yoshikawa et al. (Reference Yoshikawa, Godfrey and Rivera2008) analyse the effects of social exclusion on minors through a sample of undocumented immigrant parents in New York City. These authors highlight how the concept of social exclusion makes it possible to go beyond poverty to include aspects related to lack of access to the political, social and health system (2008, p. 64). On the other hand, there are those who study the effects of exclusion through transport: accessibility and physical barriers to public transport, economic limitations in paying for it, time availability, perception of security and trust when using different means of transport, and diversity of activity spaces accessed (Schönfelder and Axhausen, Reference Schönfelder and Axhausen2003; Suhl and Carreno, Reference Suhl and Carreno2011; Kamruzzman, Yigitcanlrar, Yang and Mohamed, Reference Kamruzzman, Yigitcanlrar, Yang and Mohamed2016). Several studies focus on analysing the impact of exclusion on certain population groups, such as the elderly (Smith and Hancock, Reference Smith and Hancock2004); people with disabilities (Désesquelles, Reference Désesquelles2002); long-term unemployed people (Mateo and Penalva, Reference Mateo and Penalva2000); minors (Gross-Manos, Reference Gross-Manos2015), and the immigrant population (Gingrich and Lightman, Reference Gingrich and Lightman2015).
The study of social exclusion has led to research on the phenomenon, along the lines defined by the European Commission (2003), in most countries. Of the works referenced in the bibliography consulted, through the Scopus database, one that implemented an instrument called SPC to measure the multidimensional concept of social exclusion from data extracted from a public health survey in the Netherlands is noteworthy. It is composed of fifteen variables grouped into four dimensions: social participation, material deprivation, access to social rights, and normative integration. Although the latter could not be measured because the relevant data were not available, the results support the multidimensionality of the concept (van Bergen et al., Reference van Bergen, Hoff, van Ameijden and van Hemert2014). In Canada, Gingrich and Lightman (Reference Gingrich and Lightman2015) carried out a longitudinal study on a sample of ethnic minorities and immigrants, also using secondary data, by creating an economic exclusion index composed of nine dimensions: individual wages, economic family earnings, household income, transfer income, home ownership, job security, employment adequacy, multiple job holdings, and non-wage benefits. Meanwhile, Scutella and Wilkins (Reference Scutella and Wilkins2010) proposed a system for measuring social exclusion in Australia from data originating from different sources: material resources, labour market outcomes, education, health, social support and interactions, community engagement, and personal safety. In Latin America, studies have also been published on Argentina (Gacitúa-Marió et al., Reference Gacitúa-Marió, Siaens and Wodon2001), Chile (Clert and Wodon, Reference Clert and Wodon2001) and Uruguay (Baker, Reference Baker2001), using qualitative and quantitative data collection techniques and sponsored by the World Bank (Gacitúa-Marió and Wodon, Reference Gacitúa-Marió and Wodon2001). The authors define the social exclusion framework as a “heuristic device to understand the linkages and interactions between different risk factors (economic, social, cultural, political and institutional) that generate poverty and inequality (Clert and Wodon, Reference Clert and Wodon2001, p. 3).
Focusing on Spain, it is worth noting that several studies on social exclusion have been carried out since the end of the 20th century and the beginning of the 21st, in some cases linked to the development of national or regional plans for social inclusion. During this period, Observatories for the analysis of social exclusion were also created (Sartu Federación, Reference Sartu2002; Hernández, Reference Hernández2008); and various research projects were carried out (Subirats, Reference Subirats2004; Raya Reference Raya2006, Laparra and Pérez, Reference Laparra and Pérez2008). In general, these studies take a multidimensional approach, looking at both the economic and employment dimensions, as well as those related to housing and education. That is, they consider the structural forms of social integration (Raya, Reference Raya2006) and they differ in that they consider other aspects, such as health, participation, social and family relations. The operationalisation of the concept leads to greater diversity in terms of the indicators used, which may be due to both divergences in the definition of the concept and in the origin of the data (Raya, Reference Raya2006). Recent studies on social exclusion for the whole of Spain are based on two types of sources. On the one hand, the study carried out by EAPN, using the AROPE, which has been carried out annually since 2011, and, on the other hand, the FOESSA studies (2014 and 2019a) based on a telephone survey of households. Along with these, several studies for other geographical areas can be mentioned (Hernández, Reference Hernández2008; Gómez, Reference Gómez2010; Parrilla Fernández, Reference Parrilla Fernández and Fundación Juan Muñiz2010).
Method
In this section, we describe the process of designing, implementing and validating the SiSo Scale, the instrument obtained, the characteristics of the population to which it has been applied and, finally, the analyses conducted.
Process
The SiSo Scale was designed on the basis of a literature and documentary review of texts relating to social exclusion (Laparra, Reference Laparra1999; Subirats, Reference Subirats2004; Raya, Reference Raya2006; Silver, Reference Silver2007; Hernández, Reference Hernández2008, FOESSA Foundation, 2019a). The design was developed by members of the working group made up of staff from the Department of Social Welfare of the Castilla-La Mancha Regional Council and members of the collaborating universities’ research team. A first version of the document was developed, as is described in the following subheading, and reliability and validity tests were conducted, as described below.
The validation process was performed by means of different information collection techniques. One of these techniques was open consultation with a group of social workers from primary care social services, by collecting information in face-to-face working sessions after presenting the conceptual framework and the first design of the scale. In this consultation, the professionals sent their written contributions by e-mail, giving their opinion and providing suggestions for improvement in terms of the wording of the items, the weighting of the variables or the general structure of the tool. Subsequently, experts in research and/or intervention in social exclusion were supplied an online questionnaire in which they had to assess each item through three criteria: suitability, clarity and weighting or specific weight within the scale, grading each criterion from 1 to 5 (1 = not very suitable/light/low weight and 5 = very suitable/heavy/high weight).
The obtained results allowed the research team to refine the instrument to avoid redundancies between the items. Later, a pilot test was conducted with a sample composed of 78 cases, selected by the research team, with different social exclusion profiles (cases of mild exclusion and cases of severe exclusion; new cases and old cases).
After obtaining acceptable results in the reliability of the scale using Cronbach’s alpha and the judgment of the professionals, it was implemented as a data logging tool. The Department of Social Welfare determined that, as part of their diagnostic function, social workers in the primary care social services should include information from the SiSo Scale in applications for welfare.
Since May 2018, social workers in primary care social services have registered information using a specific electronic application of the SiSo Scale. The professional, in the course of the intervention with the service user, gathers information linked to the different key areas contained in the tool. Afterwards, they register the information in the database. The estimated entry time is ten minutes.
Instrument
The scale’s first design had eight life domains and twenty-nine variables. The scale was refined to its current version following a process of validation and comparison with external judges – experts in research and/or intervention in social exclusion – as well as through the implementation of a pilot test. The SiSo Scale is composed of 25 variables related to social position, grouped into six life domains linked to social exclusion: economic, employment, education, residential, social and healthcare and relational (Appendix 1). The scale is designed as a descriptive rubric for evaluating the social situation of family units. Once the professional becomes more familiar with the case in question, they should identify the description that best defines the household’s situation with respect to the case study. To do so, it indicates its assessment of the situation analysed for the 25 social position variables, using a scale ordered into four positions: a lot of difficulty, quite a lot of difficulty, some difficulty and little or no difficulty. These variables as a whole make it possible to obtain an index of the person’s social position on the inclusion-exclusion axis.
The scale is complemented by the collection of information on personal aspects through three variables: social skills, perception of the situation and improvement strategies, all of which are of interest for the intervention processes. Likewise, a set of socio-demographic data is collected that provides information on the persons who use social services (type of household, size, number of minors) and variables relating to the main breadwinner.
Finally, a variable called “Technical assessment” is included, where social service professionals who know each case score the degree of social difficulty from their professional perspective. This variable serves to contrast the results obtained through the application of the scale with the professional’s own assessment.
Participants
The scale is applied to users of social services in the Autonomous Community of Castilla La Mancha. The validation process was carried out with the involvement of different participants. Firstly, professionals from the region’s social inclusion programmes were involved, made up of 33 professionals with the following profiles: 15 social workers; 10 social educators; 4 programme social workers; 2 inclusion technicians; and 2 technicians from provincial directorates. This group was called the contrast group, providing feedback to the tool design team from the beginning of the project.
Secondly, for content validity, the tool was checked with a group of experts (validation by external judges). In this case, the individuals consulted were, on the one hand, the 33 professionals mentioned above, and, on the other hand, 31 experts in research and/or intervention with people experiencing exclusion, with the following characteristics: 6 researchers specialised in social exclusion issues; 5 professionals from public administrations from various regions; 15 professionals from social entities; and 5 university professors specialised in social work and social diagnosis.
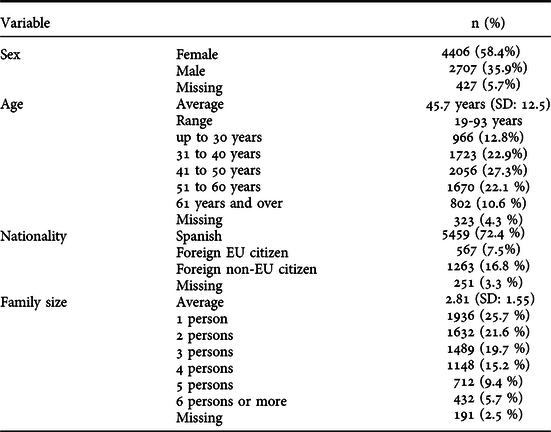
The population studied is the total number of families that were cared for in the region’s primary care social services between January and September 2018. The socio-demographic characteristics of the person in charge of each family, to whom the scale was applied (n=7540), in October 2018 are shown in Table 1:
Descriptive data of the person in charge of each family (n = 7540)

Data analysis
First, expert judges -experts in research and/or intervention in social exclusion- were consulted and asked through a lickert scale their opinion regarding the suitability, clarity and weighting of the items. The coefficient of variation (Canavos, Reference Canavos1990; Peña, Reference Peña2001) was calculated to identify the degree of convergence or divergence with respect to the items analysed.
The second step was to examine the metric properties of the scores obtained on the SiSo Scale. In order to analyse the internal structure several exploratory factor analyses (EFA) were performed. Thirdly, the reliability of the construct was calculated. Data analysis was performed with the programme IBM SPSS Statistics 24 and JASP 0.11.1.0 and Excel.
Ethical issues
The study is based on data assessing the social situation of the people served by social services. At the time of the interview they are informed of the processing of the information, following the guidelines of the Law on the Protection of Personal Data (Organic Law 3/2018). The information is processed online, without any written record on paper. No personally identifiable information is included in the data matrix for statistical analysis, so that cases are dissociated from personal data and registered with a specific code.
Results
The results of the scale validation process are presented below. Those relating to the content validity are presented first and those relating to the construct validity are presented second.
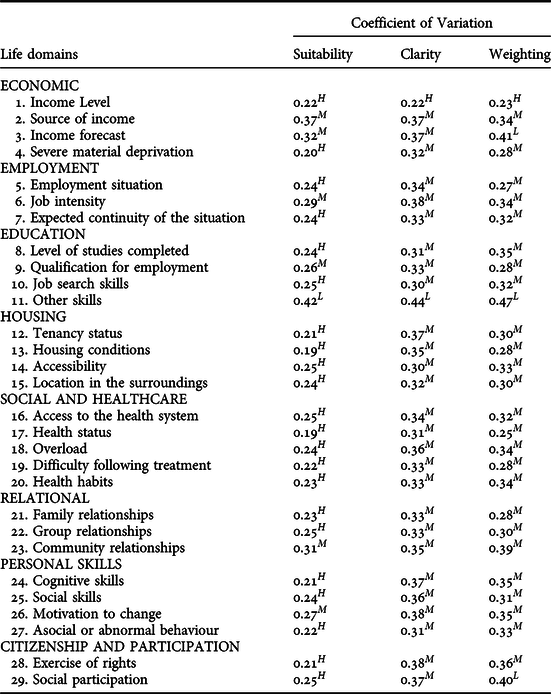
The results of the Coefficient of Variation (CV) are presented in Table 2. As criteria for interpretation by the research team, a high level of consensus has been considered for CV values equal to or less than 0.25; moderate consensus for values between 0.26 and 0.39; and low level of consensus for values of 0.40 or more (Raya, Reference Raya2006).
Level of consensus of the experts regarding the SiSo Scale variables

H High level of consensus; M Moderate level of consensus, L Low level of consensus.
Based on expert testing and the application of a pilot test to a reduced number of cases, the scale was revised. The indicators relating to the relational, personal skills domains and corresponding to citizenship and participation were redefined; a new ‘relational’ domain was created that included the aspects defined in indicators 21, 22, 23, 27, 28 and 29, grouped into five indicators. Meanwhile, indicators 25 and 26 corresponding to personal skills are considered to be useful information for the social intervention process, but are not considered as an indicator to assess social exclusion, due to its structural character. In addition, indicator 24 was removed and indicator 11 was redefined, as it presented high coefficients of variation and, therefore, a low level of consensus between the expert judges consulted.
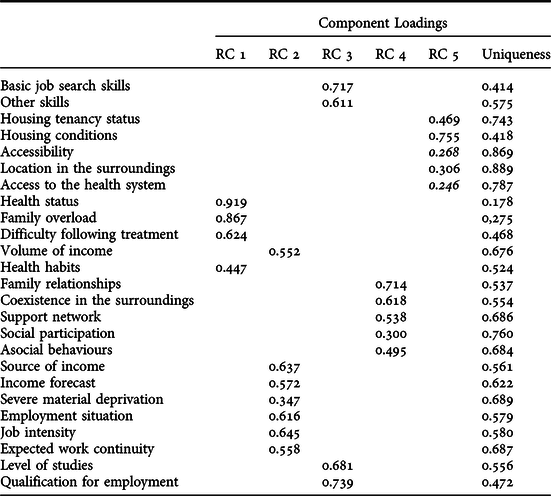
Once the scale was implemented, its metric properties were analysed with information available from 7540 families. The internal structure was analysed through various exploratory factor analyses (EFA). The suitability of the sample was checked, with a KMO coefficient of .84 and Bartlett’s test of sphericity with p = .000. The solution aims to group the items into five factors (Rotated Component), as shown in Table 3.
Exploratory Factor Analysis

Extraction method: Maximum likelihood.
Rotation method: Varimax standardisation with Kaiser.
The scale is well-suited to five factors related to the dimensions set out in the theoretical framework. The first factor relates to the social and healthcare variables; the second factor groups together the economic and employment variables; the third factor relates to the variables linked to education and job-seeking skills; the fourth factor relates to social relationships and participation variables; and the fifth factor relates to those linked to the residential domain. In the latter, two variables with a very low factorial weight for RC .5 are observed (below .30, see Table 3), but their suppression has a very slight effect on the reliability of the scale as a whole.
In any case, it was decided that six life domains would appear in the design for the application of the tool by social service professionals, differentiating between the strictly economic dimension and the employment dimension, since the diagnosis and intervention strategies differ depending on the profile of users in situations of vulnerability and/or social exclusion.
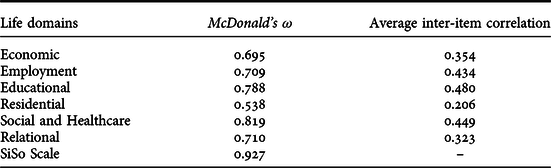
Thirdly, the results of the reliability of the construction are presented using the Composite Reliability Coefficient. In this respect, the SiSo Scale as a whole shows a good internal consistency of .92 by means of McDonald’s (1999) coefficient ω. The coefficients for each life domain have acceptable values, around .70 – with the exception of the residential domain (Table 4), whose value is 0.538; although the average correlation between the items is within the acceptable values.
Reliability Analysis

The results show internal consistency in each of the life domains and their satisfactory contribution to the whole of the multidimensional scale.
Discussion
The SiSo Scale is in line with evidence-based policy, which requires data to understand the complexity of social facts and enables “policymakers to establish social success indicators for their policies, understand the causal relationships between those policies and social outcomes, and more effectively carry out policies that best achieve future social successes” (Burkhauser, Reference Burkhauser2009, p. 715).
The implementation of social policies requires reliable and valid instruments that provide standardised information and allow comparisons to be made at the longitudinal and spatial levels. The debate on the quality of measurements for approaching a complex phenomenon has been the subject of several publications (Besharov and Couch, Reference Besharov and Couch2009; Gilbert, Reference Gilbert2009; Vrooman and Hoff, Reference Vrooman and Hoff2013; Treanor, Reference Treanor2014). The authors highlight the need to go beyond measurements based on strictly economic criteria to incorporate new dimensions that affect the living conditions of vulnerable population groups.
The SiSo Scale is a tool for diagnosing situations of social exclusion constructed with the different life domains detected in the scientific literature (Laparra, Reference Laparra1999; Gilbert, Reference Gilbert2009). In order to delimit the life domains and indicators, the review carried out by Raya (Reference Raya2006) on the research related to social exclusion undertaken in the period 1999-2005 has been taken into account (Laparra, Reference Laparra1999; Government of Navarre, 1999; Sartu Federación, Reference Sartu2002; Aguilar et al., Reference Aguilar, Navarro and Eransus2003; Subirats, Reference Subirats2004). In addition, for the subsequent period, the evaluation tools for exclusion developed by the Basque Government (2013), the Social Exclusion Observatory of the University of Murcia and the FOESSA Foundation Report Questionnaire (FOESSA, 2019a) were also considered.
The study was carried out using data from Case Management in Social Services. In this way, it provides up-to-date information on the target population of programmes and services – as opposed to survey-based research, such as the PSE-UK research project (Dermott, E. and Main, Reference Dermott and Main2018; Bramley, G. and Bailey, Reference Bramley and Bailey2018), the Dutch public health survey by van Bergen et al. (Reference van Bergen, Hoff, van Ameijden and van Hemert2014), the reports of the FOESSA Foundation in Spain (2019a) or those proposed for surveys at the European level (Vogel et al., Reference Vogel, Boelhouwer and Veenhoven2003); or those from secondary sources (Townsend, Reference Townsend1987; Silver, Reference Silver2007; Hirsch et al., Reference Hirsch, Concialdi, Math, Padley, Pereira, Pereirinha and Thornton2020). However, the different ways of approaching social reality are complementary for the management of public policies. The experience developed with the SiSo tool shows that it is possible to generate aggregate information on established indicators in social intervention from the data records. This provides social policy managers with continuous and updated information to aid decision-making based on data on the population affected by the policies.
In this study, a validation procedure was followed in its design and implementation, through consultation with judges and experts (content validity) and the assessment of metric properties (construct validity). In the specialised literature there are few references to the process of validating instruments for measuring social exclusion. van Bergen et al. (Reference van Bergen, Hoff, van Ameijden and van Hemert2014) present the metric properties of an instrument called SPC: however, this study does not calculate the reliability coefficient of the scale, as the authors did not obtain enough public health records to complete the information analysed.
In the case of Spain, Giménez et al. (Reference Giménez and Domenech2016) published the results of the Escala de Diagnóstico de la Exclusión Social-Modelo Universidad de Alicante (Social Exclusion Diagnosis Scale-University of Alicante Model – ESS-UA). This is a scale to support individual diagnoses, composed of eight areas of exclusion and four degrees of intensity (none, mild, moderate and severe). At first, Giménez et al. published the results of its application to people who use the primary care social services of the municipality of Alicante, although the statistics on the reliability, validity and dimensionality of the tool were not included. Statistics presented later (Giménez et al., Reference Giménez, Domenech, Mateo and Alfonseti2018) showed poor results for the reliability of the scale as a whole (Cronbach’s α = 0.4), although they improved within each dimension considered separately.
On the other hand, other tools implemented in social service systems have not passed a validation process, as is the case of the Instrumento de Valoración de la Exclusión Social el Gobierno Vasco (Social Exclusion Assessment Tool of the Basque Government – Spain), which requires improvements guided by basic and applied research to provide results on its effectiveness, reliability and validity (Fantova, Reference Fantova2017).
In the SiSo Scale, the content validity proved to fit the main sources of evidence (Sireci, Reference Sireci2003): the definition and representation of the construct. The contents of social exclusion have been defined operationally, through the selection and analysis of the different dimensions of the construct that can be found in the scientific literature. In addition, the high consensus on suitability among the experts consulted shows the relevance of each of the dimensions on social exclusion, especially those relating to housing and social and healthcare, followed by those relating to the economic situation, employment status and education. Meanwhile, the relational dimension is relevant for considering the position of the person in the process of social disaffiliation and social disqualification arising from the loss of links to integration and other life domains.
The results show adequate levels of construct validity and internal consistency for the scale. In terms of construct validity, the EFA results point to five factors that we call “life domains”, because they cover basic aspects for a dignified human life. The residential domain is the weakest, followed by the economic domain. In any case, this exploratory model supports the factorial validity of social exclusion as a multidimensional construct. For the application of the SiSo Scale by social service professionals, we have chosen to present six life domains, differentiating between the strictly economic dimension and the employment dimension, since the diagnostic and intervention strategies differ depending on the family profile. The internal consistency of the SiSo Scale as a whole is good (ω = .92) and that of each life domain is acceptable, around .70, with the exception of the residential domain.
Limitations
An initial difficulty that arises in measuring social exclusion is the complexity of the variables, due to their number and the diversity of areas they comprise (income, work, housing, education, health, etc.). Their operational definitions, as well as the techniques for obtaining the data, are subject to constant change and social debate. In this interaction, a second level of difficulty appears – as the scientific approach to the issue is compromised by the tensions between the different ways of guiding social policies on poverty and social exclusion, which are increasingly diverse and nuanced (Raya, Reference Raya2007; Besharov and Couch, Reference Besharov and Couch2009), requiring continuous adjustments to the precision of the language to be used (for example, in residential exclusion, the diversification of typologies: roofless, houseless, insecure housing, inadequate housing) as well as in the techniques for obtaining valid data (e.g. income from the black economy).
In this paper, an attempt has been made to reduce ambiguity as much as possible through operational selection and delimitation of the variables, respecting the time available and the data protection of the families to which the scale is applied and benefiting social intervention professionals without, however, renouncing the fact that data integration is useful for making decisions on social policy measures. However, the SiSo Scale still requires further experimentation before it can become a tool that determines access to specific services.
On the other hand, Castilla-La Mancha is one of the few Autonomous Communities in which the main dimension related to exclusion is employment and not housing, as is the case in the rest of Spain (FOESSA Foundation, 2019b). This data leads us to consider the convenience of analysing the internal structure of SiSo with data obtained in other regions, to observe the impact of the residential domain.
Conclusion
Social exclusion is a complex and dynamic process involving multiple factors that drive individuals, families, groups and communities into areas of vulnerability and/or exclusion. The analysis of social exclusion points to the consideration that it is a structural and heterogeneous phenomenon that can be tackled through various public policies. Furthermore, social exclusion is also seen as multifactorial, dynamic and multidimensional. In practice, exclusion is a concept that is difficult to define and therefore difficult to quantify. Nevertheless, despite the concept’s complexity, it is possible to approximate it through the operationalisation of its dimensions; this is one of the main contributions of the present work.
In this area, as with other aspects of social intervention, there is a need for tools at the service of social intervention and social policy management that offer indicators for the follow-up and monitoring of programmes and services. Through the lessons learned from previous experiences, the SiSo Scale provides a synthetic index of Social Position, which provides the administration and social services with a tool for monitoring their interventions with people, “given that social exclusion is a structural phenomenon, but is suffered on a personal level” (Raya, Reference Raya2010, p.135). Having valid and reliable information is one of the principles of good governance and a condition for making decisions to guide the successful implementation of social policies aimed at improving living conditions and social well-being.
Acknowledgements
Different professionals from Castilla-La Mancha and other Autonomous Communities have participated during the design and implementation phase of the SiSo scale, contributing to the improvement of the tool. We extend our most sincere thanks for their collaboration.
Appendix 1. Dimensions and variables of the SiSo Scale according to the intensity of the situations of social difficulty