I. INTRODUCTION
Graphene, a two-dimensional (2D) nanomaterial composed of sp 2-hybridized carbon atoms, has become one of the most exciting research topics since its discovery in 2004.Reference Rao, Sood, Subrahmanyam and Govindaraj1 Due to its unique structure and excellent physical properties such as mechanical properties, electrical conductivity, mobility of charge carriers, specific surface area, and fascinating transport phenomena, graphene has been intensively used as novel functional materials for a wide range of applications.Reference Meyer, Geim, Katsnelson, Novoselov, Booth and Roth2, Reference Dreyer, Park, Bielawski and Ruoff3 Among them, one of the most promising applications of graphene is in the polymer composites, where the mechanical, electrical, or thermal properties of resultant polymer composites can be largely improved by just adding a small amount of graphene.Reference Zhou, Chen, Tang, Bai, Zhang, Deng and Fu4–Reference Zhang, Zheng, Yan, Yang, Wang, Lu, Ji and Yu7
Graphene is usually prepared via the reduction of graphene oxide (GO), which is considered as the most possible large-scale method for the production of graphene. A main challenge for realizing the preparation of graphene/polymer composites is to homogeneously disperse single graphene sheets within polymer matrix. However, graphene would undergo irreversible aggregations due to strong π–π interactions during reduction. Thus, low dispersibility of graphene in bulk matrices or organic solvents is a major obstacle in the fabrication of graphene/polymer composites by melt compounding or solution mixing since graphene tends to form aggregates in polymer melt or solvents. Many efforts, e.g., chemical functionalization, have been made to achieve homogeneous dispersion of graphene throughout the matrices or media. Ruoff et al.Reference Stankovich, Dikin, Dommett, Kohlhaa, Zimney, Stach, Piner, Nguyen and Ruoff8 used chemically reduced isocyanate-functionalized graphene to electrically enhance polystyrene (PS). A fine dispersion of the functionalized graphene in organic solvent paved the way to good dispersion of graphene in the PS matrix. However, large amounts of organic solvents are usually used in the functionalization process, such as esterification, amidation, and epoxidation reactions. Such organic solvents are toxic and environmental unfriendly.Reference Stankovich, Dikin, Dommett, Kohlhaa, Zimney, Stach, Piner, Nguyen and Ruoff8–Reference Stankovich, Piner, Nguyen and Ruoff10
An organic solvent-free approach based on latex technology has been developed to fabricate many carbon materials-based composites, such as carbon blackReference Peng, Li, Chen and Zheng11 and carbon nanotubes.Reference Grunlan, Mehrabi, Bannon and Bahr12 Recently, this technology has also been applied to the preparation of graphene-based polymer composites. Typically, the graphene/polymer composites are synthesized by simply mixing polymer microspheres with aqueous graphene suspension.Reference Ju, Kim, Kim and Lee13–Reference Zhang, Liu and Choi16 The resultant composites show improved electricalReference Tkalya, Ghislandi, Alekseev, Koninga and Loos15 and electrorheologicalReference Zhang, Liu and Choi16 properties. This latex concept enables to incorporate nanofillers into any kinds of highly viscous polymer such as PS, poly(methyl methacrylate), and other polymers, which can be synthesized via emulsion polymerization or similar processes.
On the other hand, the technology of layer-by-layer (LBL) assembly has been widely used to fabricate graphene-containing ultrathin films or graphene-based polymer composite films.Reference Kulkarni, Choi, Singamaneni and Tsukruk17–Reference Zhao, Zhang, Hao, Li, Fang and Chen19 The as-prepared LBL thin films have high nanofiller loadings and a uniform distribution or highly oriented nanofillers within polymer matrix, thus exhibiting dramatically improved physical properties when being compared with neat polymers. Meanwhile, graphene capsules are also prepared by assembling multilayered graphene shells on the surface of colloidal microspheres.Reference Hong, Char and Kim20, Reference Tang, Qin, Wang and Guo21
Based on the above scenario, it is reasonable to suppose that the combination of latex technology and LBL assembly will give polymer composites with an improved dispersion of nanofillers and controllable nanofiller contents in polymer matrix. In this study, graphene/PS composites are prepared by hot pressing graphene-wrapped PS microspheres, which are prepared by LBL assembly of oppositely charged GO onto PS microspheres followed by reduction. It can be expected that PS latex will prevent graphene aggregations and the graphene networks thus formed will remain in the matrix when the as-obtained graphene-wrapped PS microspheres are hot pressed into films. In fact, during the preparation of this manuscript, a study on the effective coating of PS microspheres with graphene nanosheets (GNSs) was reported.Reference Li, Wang, Yang, Gua and Xue14 However, they only proposed the concept of designing either GNSs network-embedded polymer nanocomposites or GNSs–polymer bicontinuous nanocomposites. Therefore, more detailed study is needed to investigate the performance of the specially designed nanocomposites. Results that demonstrate thermal and electrical properties of graphene/polymer composites with different nanofiller contents are also presented and discussed.
II. MATERIALS AND METHODS
A. Materials
Styrene was supplied by Sigma-Aldrich (St. Louis, MO) and distilled to remove the inhibitor and any polymeric residues. 2,2′-azobisisobutyronitrile (AIBN) was purchased from Sigma-Aldrich and purified by recrystallization from methanol. Sodium dodecyl sulfate (SDS), poly(vinyl pyrrolidone) (PVP, Mw = 10,000–70,000), polyethylenimine (PEI), 1-ethyl-3-(3-dimethylaminopropyl)carbodiimide hydrochloride (EDC), N-hydroxysuccinimide (NHS), and phosphate buffer saline (PBS) were purchased from Sigma-Aldrich and used as received. Natural graphite power (325 mesh) was purchased from Alfa-Aesar (Ward Hill, MA) and used without further purification. 98% H2SO4, 50% hydrate hydrazine, 30% H2O2, KMnO4, NaNO3, NaOH, NaCl, and 37% HCl were supplied by China Medicine Co. (China) and used as received. Ultrapure Milli-Q water (China) was used throughout all the experiments.
B. Synthesis of PS microspheres
The PS microspheres were prepared by a dispersion polymerization method.Reference Tang, Qin, Wang and Guo21 Typically, 50 mL ethanol, 2.5 mL H2O, 1.75 g PVP, and 0.037 g SDS were charged into a 250 mL flask. The reaction solution was deoxygenated by bubbling nitrogen gas at room temperature for 30 min and subsequently heated to 70 °C under a stirring rate of 180 rpm for 30 min, followed by addition of 25 mL styrene and 0.25 g AIBN. The reaction was continued for 12 h at 70 °C. Finally, the resulting mixture was cooled to room temperature and 37.5 mL of 5 wt% NaCl solution was added under stirring. The PS microspheres were collected by repeated centrifuging and washing with ethanol, followed by drying under vacuum at 60 °C for 24 h.
C. Preparation of negatively and positively charged GO sheets
Graphite oxide was synthesized by the Hummers methodReference Hummers and Offeman22 and exfoliated to give a brown dispersion of GO under ultrasonication. The resulting GO suspension is negatively charged over a wide pH condition since the GO sheet has functional groups such as carboxylic acids. Positively charged GO was synthesized by formation of an amide bond between PEI and GO in the presence of EDC and NHS. Briefly, 0.5 mg/mL negatively charged GO suspension was mixed with 1 mg/mL PEI in PBS at pH = 7.4. After ultrasonication for 30 min, 0.015 M EDC and 0.03 M NHS were added, and the suspension was stirred under ambient condition for 24 h. After the reaction was completed, the product was repeatedly washed with water and filtered for at least three cycles. Finally, the obtained GO-g-PEI was dispersed in water to form a stable and positively charged solution (0.5 mg/mL GO-g-PEI).
D. LBL assembly and reduction of charged GO sheets
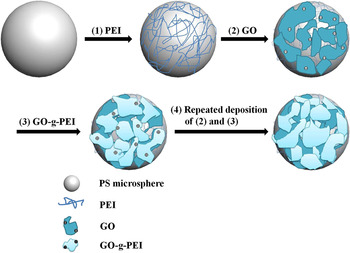
Before the alternating deposition of GO and GO-g-PEI on the PS microsphere template via LBL assembly, one layer of PEI was first assembled on the microspheres to provide a uniformly and positively charged surface. Briefly, PS microspheres in 2 mg/mL aqueous solution of PEI were stirred for 2 h before the removal of excess PEI by repeated centrifugation and water washing. The resulting product was added to 0.5 mg/mL negatively charged GO suspension and stirred for 30 min. Excess GO was removed by three repeated centrifugation and water washing cycles. The microspheres covered by a layer of negative GO were immersed in 0.5 mg/mL positively charged GO-g-PEI solution for 30 min followed by the same washing process as described above. Thus, one bilayer of oppositely charged GO sheets was obtained via LBL assembly. The above procedures were repeated until three bilayers of oppositely charged GO were deposited onto PS microspheres. To simplify, the GO-wrapped PS microspheres were denoted as (GO)n/PS, where GO represents the oppositely charged GO and n is the number of bilayers. The assembly process to construct (GO)n/PS microspheres is illustrated in Fig. 1. The (GO)n/PS microspheres were then reduced by hydrazine at 90 °C for 4 h. The PS microspheres deposited with reduced GO [denoted as (RGO)n/PS] were collected by centrifuging and water washing, followed by drying under vacuum at 60 °C for 24 h. For the control, the oppositely charged GO was deposited onto a quartz substrate by using similar procedure.
Schematic illustration of oppositely charged GO onto PS microspheres via LBL assembly.

E. Preparation of conductive (RGO)n/PS composite films
To obtain the composite films for the electrical measurements, the (RGO)n/PS powder was placed into a metallic mold (40 × 50 mm, 0.2 mm in thickness), heated to 180 °C, and then hot pressed at about 10 MPa for 10 min in a compression molding press. The mold was then transferred into another compression molding press and pressed at room temperature to about 5 MPa until cool.
The mass fraction of graphene loading was converted to a volume fraction using the following equationReference Pham, Cuong, Dang, Hur, Kong, Kim, Shin and Chung23:
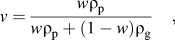 $$v = {{w{\rm{\rho }}_{\rm{p}} } \over {w{\rm{\rho }}_{\rm{p}} + (1 - w){\rm{\rho }}_{\rm{g}} }}\quad,$$
where v and w are the volume fraction and mass fraction of graphene, respectively. ρp and ρg are the density of PS and graphene, whose value can be set to be 1.05 and 2.2 g/cm3, respectively.
F. Characterization
The surface charge of the oppositely charged GO sheets synthesized was measured using a ζ-potential analyzer (Zetasizer NanoZS; Malvern). Tapping mode atomic force microscopy (AFM) images were taken using a Scanning Probe Microscope Nanoscope IV (Digital Instruments, Veeco, Plainview, NY). Fourier transform infrared (FTIR) spectra were recorded with a 4 cm−1 spectral resolution on a Nicolet Nexus 470 spectrometer (Perkin Elmer, Waltham, MA) equipped with a DTGS detector (Perkin Elmer, Waltham, MA). Ultraviolet (UV)–vis absorption spectra were recorded on a Lambda 35 spectrometer (Perkin-Elmer, Waltham, MA). The thickness of GO and GO-g-PEI multilayers on silicon wafers was measured by ellipsometry [EC-400 and M-2000V, J.A. Woollam Co. (Lincoln, NE), Inc.]. The average values of the thickness after three measurements were obtained. Raman spectra were measured on LabRam-1B French Dilor Com (France) (λex = 632.8 nm). Transmission electron microscopy (TEM) observation was performed with a JEOL 2100 TEM (Tokyo, Japan) under an accelerating voltage of 200 kV. Scanning electron microscopy (SEM) characterization was conducted with a TS 5136 MM scanning electron microscope (Tescan, Czech Republic) at an accelerating voltage of 20 kV. Thermogravimetric analysis (TGA, Pyris 1, Perkin Elmer, Waltham, MA) was performed under nitrogen flow from 100 to 700 °C at a heating rate of 10 °C/min. For the characterization of electrical properties, the film samples were cut into rectangle with a size of 20 × 10 × 0.2 mm3. All conductivity measurements were made using a Keithley 4200 semiconductor characterization system (Cleveland, OH) in ambient condition with standard four-probe technique with a threshold detection limit of 0.1 GΩ. Silver paint was applied to both ends of the samples to ensure good contact. The bulk conductivity was calculated with the following equationReference Zhou, Chen, Tang, Bai, Zhang, Deng and Fu4, Reference Liu, Chen, Chen, Wu, Zhang, Chen and Fu5:
 $${\rm{\sigma }} = L/(RS)\quad,$$
where L, R, and S are the length, resistance, and cross-sectional area of the specimen, respectively.
III. RESULTS AND DISCUSSION
The suspension of GO in water was prepared by exfoliation of graphite oxide into single layer via ultrasonication. The as-obtained GO suspension was intrinsically negatively charged due to the introduction of functional groups such as carboxylic acids (–COOH) on the surface of graphene sheets. As determined by the ζ-potential measurements, the prepared GO suspension exhibits a good colloidal stability (with ζ-potential of −40 mV). Positively charged GO was prepared by covalent linking of PEI to GO through formation of an amide bond using EDC and NHS.Reference Zhang, Lu, Zhao, Huang, Shen and Zhang24 This leads to a positively charged GO suspension (GO-g-PEI) whose ζ-potential was determined to be +55 mV. The chemical conjugation of PEI to GO was confirmed by FTIR results. As shown in Fig. 2, a broad absorption peak at 3400–3600 cm−1 is observed for both GO and GO-g-PEI samples, which can be attributed to the presence of hydroxyl groups. A strong absorption peak appearing at 1730 cm−1 is assigned to carbonyl stretching of the COOH groups on the surface of GO. After PEI is grafted to GO, the peak at 1730 cm−1 almost vanishes and a new prominent peak at 1635 cm−1 appears, which can be attributed to the stretching mode of amide groups. Furthermore, two strong peaks at 2854 and 2925 cm−1, which are due to the symmetric and asymmetric stretching modes of methylene groups of PEI molecules, respectively, are clearly seen in the FTIR spectrum of GO-g-PEI.
FTIR spectra of GO and GO-g-PEI.

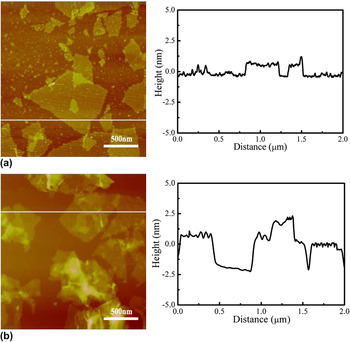
Figure 3 is the typical AFM images of GO and GO-g-PEI, prepared by depositing their aqueous suspensions on a freshly cleaved mica surface via a drop casting method. As seen in Fig. 3(a), negatively charged GO sheets show a perfect platelet structure with a thickness of about 1 nm. Unlike the original GO sheets, the as-prepared GO-g-PEI deforms into folded or textured structures [Fig. 3(b)]. The average thickness of GO-g-PEI, measured from the height profile of the AFM image, is about 2.6 nm. In comparison with the well-exfoliated GO sheets, the thickness of GO-g-PEI is much larger. Therefore, it is reasonable to conclude that the increase in thickness of the as-prepared GO-g-PEI is due to the chemical attachment of PEI on both planes of the GO sheets.
AFM images and the corresponding height profiles of (a) GO and (b) GO-g-PEI deposited on mica.

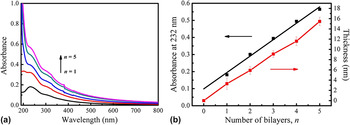
On the basis of the electrostatic interactions, multilayer architectures can be assembled by repeatedly depositing the suspension of oppositely charged GO onto a substrate, such as quartz slides, silicon wafers, and microspheres. To facilitate the investigation and monitoring of the LBL assembly process, the GO and GO-g-PEI were first deposited alternately onto a planar substrate (here quartz slide). The subsequent growth of multilayer films was monitored after each deposition cycle [shown in Fig. 4(a)] by UV–vis spectroscopy, which is an efficient method to monitor and confirm the LBL assembly process. The absorbance at 232 nm was the typical absorption peak of GO attributed to the π–π* transitions of aromatic C = C bonds. A progressive increase in absorbance at this wave length was visible with the increase of deposition cycle number of GO/GO-g-PEI bilayers. The linear relationship between the absorbance and the number of deposition cycles, shown in Fig. 4(b), indicates a reproducible and uniform deposition of oppositely charged GO in each cycle. In consistency with the absorption spectra, the ellipsometric measurements indicated that the thickness of GO/GO-g-PEI multilayer films was linearly proportional to the number of bilayers [Fig. 4(b)].
(a) UV absorption spectra of multilayer films fabricated on quartz slides. Curves from bottom to top are the bilayer numbers of 1, 2, 3, 4, and 5, respectively. (b) Plots of absorbance at 232 nm and thickness versus the number of bilayer, n.

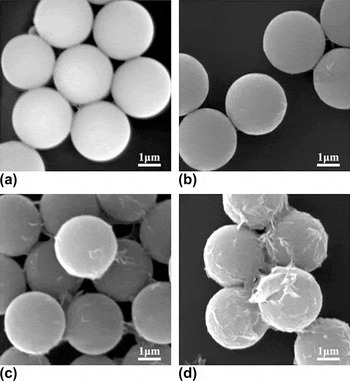
The successful LBL assembly of oppositely charged GO sheets on planar substrates makes it possible to apply similar procedure to spherical templates. It can be expected that the deposition of GO sheets will construct a stable GO shell on a spherical template, as illustrated in Fig. 1. PS microspheres were prepared by a dispersion polymerization method as previously reported.Reference Tang, Qin, Wang and Guo21 The as-prepared PS microspheres were intrinsically negatively charged, and the average size was about 2.5 μm as shown by SEM image [Fig. 5(a)]. A layer of PEI was first deposited on the PS microspheres to make its surface positively charged. Afterward, one layer of negatively charged GO and, subsequently, one layer of positively charged GO-g-PEI were deposited alternately, which complete a cycle of GO/GO-g-PEI assembly on the PS microspheres. The above procedures were repeated until a desired number of bilayers of oppositely charged GO were deposited onto PS microspheres.
SEM images of (a) PS microspheres and PS microspheres wrapped with (b) one, (c) two, and (d) three bilayers.

The morphological observations provide direct evidence for the stepwise growth of oppositely charged GO multilayers on the PS microspheres (as shown in Fig. 5). The surface of uncoated PS microspheres was clean and smooth with a diameter of about 2.5 μm [Fig. 5(a)]. Since GO is a 2D paper-like nanomaterial, which can be folded or undulated,Reference Rao, Sood, Subrahmanyam and Govindaraj1 it is supposed that GO can be uniformly wrapped onto PS microspheres, yielding a fairly smooth surface. However, it is hard to discern the adsorbed GO due to the low contrast or thickness after only one bilayer adsorption of oppositely charged GO on the PS microspheres [for n = 1, Fig. 5(b)]. With the increase number of the assembly layer, more and more GO sheets are adsorbed and tightly wrapped on the microspheres, with some ribbon-like features formed on the microsphere surfaces because of the undulation and wrinkling of GO sheets [for n = 2 and 3, Figs. 5(c) and 5(d)]. Though it is very difficult to directly measure the thickness of the GO multilayers on the PS microspheres, the average thickness of one bilayer assembled on a flat silicon wafer was estimated to be about 3.1 nm from the ellipsometric measurements.
Before the hot-pressing process, the as-prepared (GO)n/PS microspheres were first reduced to endow the graphene/PS composites with electrically conductive properties. The reduction was carried out by adding hydrazine to the (GO)n/PS suspension, and the obtained black powder of (RGO)n/PS was collected and dried. Raman spectra were used to observe the reduction process of the (GO)3/PS sample, as an example. In many cases, the Raman spectrum of graphene is characterized by two main features, the G mode from the first-order scattering of the E2g phonon of sp 2 C atoms (usually observed at 1575 cm−1) and the D mode from a breathing mode of κ-point photons of A1g symmetry (1350 cm−1).Reference Zhu, Guo, Fang and Dong25 As can be seen from Fig. 6, both the two samples [i.e., (GO)3/PS and (RGO)3/PS before and after chemical reduction] showed two typical peaks at 1300–1400 cm−1 and 1500–1600 cm−1, which were assigned as D band and G band, respectively. The intensity ratio of D band and G band (i.e., I D/I G) increased from 1.21 for (GO)3/PS to 1.34 for (RGO)3/PS sample, implying a decreased size of the sp 2 domains for the GO upon chemical reduction.Reference Jorio, Ferreira, Moutinho, Stavale, Achete and Capaz26
Raman spectra of GO-wrapped PS microspheres (a) before and (b) after chemical reduction.

After the (GO)n/PS microspheres were reduced, the obtained (GO)n/PS powder was dried and hot pressed, resulting in the reduced GO/PS composite films. The thermal stability of (RGO)n/PS composites was investigated by TGA analysis. As indicated in Fig. 7, the temperature at 5% weight loss is 402 °C for the (RGO)3/PS composites, which is almost 25 °C higher than the neat PS. The improvement in thermal stability probably indicates that the graphene sheets are well dispersed in PS with good interactions between the graphene and the matrix. Graphene-based nanofillers have been able to significantly increase the thermal stability of the host matrix due to the restriction of the polymer chain mobility near the graphene surface. During combustion or thermal degradation, graphene sheets may act as inflammable anisotropic microspheres by forming a jammed network of char layers that could effectively retard the transport of the decomposed products.Reference Pham, Cuong, Dang, Hur, Kong, Kim, Shin and Chung23 Besides, the contents of graphene in the composites were calculated according to the residual weight since PS will completely decompose after 500 °C. The weight percentage of graphene is 0.6, 1.1, 2, and 2.8 wt%, and thus, the volume fraction is 0.2, 0.6, 0.9, and 1.3 vol% for (RGO)0.5/PS, (RGO)1/PS, (RGO)2/PS, and (RGO)3/PS composites, respectively.
TGA curves of PS film and (RGO)n/PS films for n = 0.5, 1, 2, and 3, respectively.

The electrical conductivity of the composites as a function of the number of bilayers was shown in Fig. 8. Percolation in graphene/PS composites occurs with only half a bilayer (i.e., one layer of graphene) assembly when the filler concentration is near 0.2 vol%. Such a low percolation threshold for a three-dimensional isotropic case is evident due to the extremely high aspect ratio of the graphene sheets and their homogeneous dispersion in the composites.Reference Stankovich, Dikin, Dommett, Kohlhaa, Zimney, Stach, Piner, Nguyen and Ruoff8 The electrical conductivity increases dramatically from 7 × 10⁻⁷ to 0.02 S/m as the number of bilayer increases to two (i.e., 0.9 vol%). An increase in graphene sheet loading yields a more gradual increase in electrical conductivity, with a value of 0.05 S/m at 1.3 vol% when n = 3. Therefore, an effective way to fabricate electrically conductive graphene/PS composite films is demonstrated here by combining latex technology with LBL assembly approach.
Electrical conductivity of (RGO)n/PS films as a function of the deposition number of bilayers.

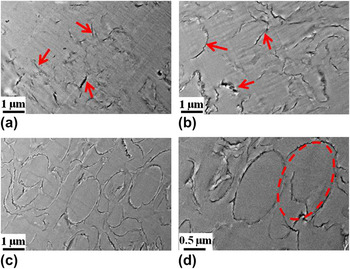
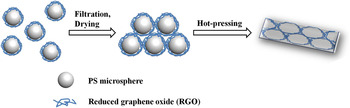
Detailed study of graphene dispersion and organization in the PS matrix is important to understand the properties and performance of the graphene/PS composites. The morphology of microtomed sections of the hot-pressed composite films was observed by TEM. As shown in Fig. 9, the RGO sheets, as indicated by red arrows, are clearly seen in the PS matrix. The distribution of RGO sheets is rather uniform and only very few agglomerations can be observed. When the bilayer number n = 1, some ribbon-like features (i.e., RGO sheets) are clearly seen in the PS matrix. These RGO sheets are noncontinuously distributed in the matrix. With the increase of the bilayer number, the noncontinuous ribbon-like features become longer and tend to intertwine together. As the bilayer number increases to 3, oval-shaped PS microspheres can still be discerned with a clear outline or “shell” of the wrapped graphene deposited on them, as indicated by the red dash circle in Fig. 9(d). The graphene network is obviously seen in this system, even though the conductive pathways can be actually formed with only 0.5 bilayers, as indicated by the conductivity measurements (Fig. 8). This may be due to the low contrast of graphene under TEM observations. The drying and hot-pressing processes of the (RGO)n/PS powder are schematically shown in Fig. 10. Once a significant amount of water is evaporated, the graphene sheets tend to aggregate together and the PS microspheres will assume a closely packed configuration. When the temperature gets above the melting or softening point of PS (i.e., hot-pressing process), these polymer chains will interdiffuse to form a coherent film. While the graphene sheets cannot penetrate the PS microspheres, a network of graphene sheets will remain in the composites. This graphene network will form conductive pathways in the insulating PS matrix, leading to an improved conductive property. At the same time, the PS microspheres could create an excluded volume and push the graphene sheets into the interstitial space between them.Reference Grunlan, Mehrabi, Bannon and Bahr12 This situation dramatically reduces the space available for graphene sheets to form conductive network, which leads to a lower percolation threshold.
TEM images of (RGO)n/PS films for (a) n = 1, (b) n = 2, (c) n = 3, and (d) high magnification TEM image for (RGO)3/PS film.

Schematic illustration of the drying and hot-pressing processes for preparing (RGO)n/PS films.

As mentioned above, our method here can be applicable to many fillers enhanced polymer–matrix composite systems. Since filler dispersion in the polymer matrix influences nearly all the relevant properties of the polymer composites, control of the filler dispersion is a critical issue in the composites science and technology. Dispersion control is more difficult to separate individual filler particles within nanoscale dimensions.Reference Grady27 The latex concept presented here enables to incorporate nanofillers into various kinds of highly viscous polymer matrices with fine dispersion. Compared with other approaches reported before, our method here of preparing graphene/PS composites has the following advantages: (i) it is an environmental friendly method because the extensive usage of toxic organic agents is greatly avoided; (ii) it is a facile route without complicated chemical functionalization reactions, which is suitable for industrial production; (iii) the nanofiller contents can be easily controlled by changing the bilayer number via LBL assembly; and (iv) it is not only applicable to polyelectrolytes but also to many thermoplastics or rubbers, such as PS, poly(methyl methacrylate), polybutadiene, and so on.
IV. CONCLUSION
In this study, graphene/PS composites were successfully prepared by hot pressing graphene-wrapped PS microspheres, which were synthesized via LBL assembly. Well-dispersed graphene sheets in the PS matrix could be visualized through TEM images. Probably, because the polymer latex prevented graphene from aggregations, the distribution and uniformity of the graphene fillers inside the polymer could be improved. The conductive graphene networks or pathways thus formed in the polymer matrix can greatly improve the electrically conductive properties of the composites. More significantly, the use of organic solvents is avoided throughout the whole experiments, including the preparation of the graphene-wrapped PS microspheres and construction of the graphene/PS composite films. Through the combination of latex technology and LBL assembly, a facile, efficient, and environmentally friendly method has been developed to fabricate electrically conductive graphene/PS composites with improved dispersion uniformity and controllable filler contents. This strategy can be anticipated to provide a platform for the preparation of graphene-based polymer composites with high performance and multifunctionality for potential applications in various areas.
ACKNOWLEDGMENTS
The authors are grateful for the financial support from the National Natural Science Foundation of China (Grant No. 51125011) and “Shu Guang” project (Grant No. 09SG02) supported by Shanghai Municipal Education Commission and Shanghai Education Development Foundation.