


INTRODUCTION
Poor and uneven implementation of development programs is a significant problem in developing countries where governments provide essential goods and services (World Bank Reference World2004; Pritchett, Woolcock, and Andrews Reference Pritchett, Woolcock and Andrews2010). The politician-bureaucrat relationship is critical in explaining microvariation in such programs. A broad political economy literature is split as to whether the influence of politicians is a blessing or a curse. On clientelism, vote buying, and political favoritism more generally, recent literature identifies politicians as part of the problem rather than the solution.Footnote 1 Alternatively, a basic tenet of democratic theory holds that electoral accountability motivates politicians to get bureaucrats to do their jobs.Footnote 2 A more nascent literature attempts to identify conditions under which politicians, in line with their role as representatives of citizens, effectively bring public services to citizens (Fujiwara Reference Fujiwara2015; Rogger Reference Rogger2014). This article contributes to this literature by arguing that service delivery functions better when politicians are able to internalize the electoral benefits of their effort towards motivating bureaucrats.
We begin by presenting microlevel causal evidence that political incentives shape the implementation of a key large-scale development program. Unpacking the relationship between politicians and bureaucrats is ordinarily hard because well-performing politicians might be different on several important dimensions like experience (Alesina, Troiano, and Cassidy Reference Alesina, Troiano and Cassidy2015; Ferraz and Finan Reference Ferraz and Finan2011a) and motivation (Ferraz and Finan Reference Ferraz and Finan2011b). As a result, many studies identify changes in political incentives by studying differences between politicians, such as political affiliation or by using term limits (Alt, Bueno de Mesquita, and Rose Reference Alt, de Mesquita and Rose2011; Besley and Case Reference Besley and Case1995; Callen et al. Reference Callen, Gulzar, Hasanain and Khan2014; Nath Reference Nath2015). By contrast, we isolate variation in individual incentives within a politician’s constituency.Footnote 3
We focus on the Indian context, a country with a multiplicity of bureaucratic and political boundaries. Electoral and bureaucratic boundaries overlap in a haphazard fashion, which not only creates challenges for the smooth implementation of government schemes, but also an opportunity to study how politicians influence the service delivery process. We leverage this haphazard overlap of boundaries, whereby some politicians have undivided influence over a bureaucratic area (unsplit), while others oversee a bureaucratic area that spills over into multiple politicians’ constituencies (split).
We use this setup to study the implementation of the world’s largest public employment program: the National Rural Employment Guarantee Scheme (NREGS) (Zimmerman Reference Zimmerman2014). NREGS, with an annual cost to the government of approximately US$6 billion, is a social protection scheme designed to guarantee 100 days of minimum-wage employment, every year, for each rural household in the country. Despite its promise, government implementation of NREGS is dramatically irregular, as shown in Figure 2.
We argue that politicians face strong incentives to motivate bureaucrats to improve the implementation of local development schemes, like NREGS, when they can internalize the electoral benefits of doing so. We build on existing research on politician-bureaucrat relations, often theorized through a principal agent framework. In our setting, when bureaucratic areas are wholly contained within political constituencies, politicians enjoy the full return on their efforts motivating bureaucrats. By contrast, when bureaucratic areas fall into more than one constituency, politicians are less likely to gain electoral support from motivating their local bureaucrat to improve service delivery. Our simple prediction is consistent with a growing theoretical literature on multiple principals (or common agency) problems (Dixit Reference Dixit1997; Gailmard Reference Gailmard2009; Martimort Reference Martimort1996).
To test our prediction, we compare within politician variation in NREGS implementation in split and unsplit bureaucratic areas, using Ordinary Least Squares (OLS) and geographic regression discontinuity models. We find statistically precise evidence that villages located in bureaucratic areas under a single political constituency experience substantially better NREGS outcomes in employment opportunities as compared to villages located in bureaucrat areas that are split across multiple political constituencies. In bureaucratic blocks wholly contained within a single state assembly constituencies, we find that (1) the number of days people work under NREGS is 9% higher, and (2) the total number of people employed in NREGS is 7% higher. We show that these results are not driven by imbalance between split and unsplit blocks on a large number of covariates from a pretreatment census, including differences in unemployment, social and economic factors, or government infrastructure. Additionally, we show that the magnitude of the effect increases as the number of politicians with whom the block is split increases. Put another way, service delivery worsens as the number of principals increase.
Guided by literature, we unpack how and why the multiple principal institutional setting may lead to worse development outcomes. We develop three mechanisms linking politician incentives to bureaucrat behavior in the multiple principal versus single principal case. First, politicians are motivated to pressure bureaucrats if they are better able to claim credit from any changes in service delivery. They are able to do this better when a bureaucrat is under their sole influence. According to this logic, development program implementation improves when politicians internalize the electoral benefit of their monitoring effort. Second, in multiple principal settings, politicians have an incentive to free ride on the monitoring of other politicians as the benefits of monitoring, in terms of bureaucratic effort to implement development programs, spill over between constituencies. Third, development program implementation is better in the single principal case because the politician enjoys greater bureaucratic control without the competition or interference of other politicians.
To adjudicate between these three mechanisms we conduct three additional empirical tests. First, focusing on bureaucrats split between two politicians, we find that NREGS outcomes worsen when the two politicians belong to different parties. This finding is consistent with both the credit claiming and bureaucratic control mechanisms, but not the free riding mechanism. Second, we examine the difference in outcomes between split and unsplit blocks as the political value of the block increases. We find that as the political importance of an area increases, the difference in development outcomes between split and unsplit blocks attenuates. We find this test to be consistent with only the credit claiming mechanism. Third, we examine politicians belonging to the Indian National Congress (INC), a party credited with the introduction of NREGS. We find that NREGS performance is better when an INC politician barely wins an election. We also show that the effect of a split bureaucrat attenuates significantly when the politician belongs to INC. This test shows that INC politicians are better able to claim credit for successful program implementation. We then explore if INC politicians in INC states further attenuate the effect of split, which would provide evidence of the bureaucratic control mechanism, but find only weak evidence in support of this channel.
Finally, we evaluate four alternative explanations for why we observe worse NREGS performance in split blocks. First, we compare our main outcome of interest—employment records—with NREGS financial flows. This comparison allows us to assess the possibility that better performance in unsplit areas in fact reflects collusion between politicians and bureaucrats in split blocks which does not leave beneficiaries better off. Second, we examine whether the strategic manipulation of electoral boundaries explains our results. Third, we consider the possibility that politicians selectively transfer poorly performing bureaucrats to split blocks. Fourth, we probe whether the impact of split is driven by rural, peripheral, areas where the Indian state may struggle to exert its influence. We do not find support for any of these alternate explanations.
EXISTING LITERATURE AND THEORETICAL PREDICTIONS
Despite the expectation that bureaucrats regularly shirk (Brehm and Gates Reference Brehm and Gates1997), researchers have identified conditions under which politicians are able to both delegate to bureaucrats and hold them accountable (Huber Reference Huber2000; Lupia Reference Lupia, Müller and Bergman2003; Lupia and McCubbins Reference Lupia and McCubbins2000; Strøm Reference Strøm2000). In this section we review relevant extant literature to answer the following question: Under what conditions do politicians motivate bureaucrats to improve the implementation of development programs? To answer this question, we study variation in political influence over bureaucrats, as this affects both the efficiency with which political effort translates into bureaucratic action and also how effectively politicians extract electoral benefits. In this sense, our view contrasts with a Weberian notion of the bureaucracy where political interference is seen as an efficiency undermining phenomenon (Andrews and Montinola Reference Andrews and Montinola2004; Knott and Miller Reference Knott and Miller2006; Miller Reference Miller2000).
Consider two actors: politicians and bureaucrats. Politicians exert effort to monitor bureaucrats, subject to the cost they bear from that effort. More bureaucratic effort translates into better development program implementation, which increases votes for incumbent politicians. Politicians monitor bureaucrats until the marginal benefit of monitoring equals the marginal cost. Bureaucrats are agents who dislike exerting effort towards their jobs, but are motivated to work by politicians who may take punitive action against them (Becker and Stigler Reference Becker and Stigler1974).
Politicians either have sole influence over a bureaucrat, or share influence with other politicians. Our objective is to compare the implementation of development programs under these two institutional arrangements illustrated in Figure 1. There are several reasons to expect outcomes to be worse in the multiple principal case: politicians may share the benefits of each others’ monitoring effort leading to free-riding problems, they may find it harder to claim credit for bureaucratic effort in such common jurisdictions, or they may face coordination problems with other politicians to exert sufficient influence over bureaucrats to make them work. Given these reasons, politicians working under a budget constraint will prefer to exert greater effort towards bureaucrats under their sole influence. They will continue to do so until the net marginal return from monitoring that bureaucrat equals the net marginal return from monitoring a bureaucrat with divided influence. As a result, bureaucrats with divided influence receive less political monitoring, leading to worse program implementation.Footnote 4
An Illustration of the Multiple Principal Setting

This claim is supported by a growing body of formal theoretical research in political science and economics that links the multiple principal institutional arrangements with worse governmental performance. Dixit identifies “common agency” or multiple principal institutional arrangements as an obstacle for politicians who aim to provide incentives to agents (Dixit Reference Dixit1997, 378).Footnote 5 Analyzing the case of two regulatory agencies overseeing a firm, Martimort argues that the presence of multiple regulatory agencies can decrease societal welfare because agencies free ride on each other’s effort (Martimort Reference Martimort1996, 677). Gailmard (Reference Gailmard2009) develops a similar intuition and argues that the overlap of political oversight for a bureaucrat will not necessarily increase the effectiveness of that oversight, as each individual politician faces collective action problems when monitoring the bureaucrat. Finally, comparing parliamentary and presidential institutions that oversee bureaucratic performance, Strøm (Reference Strøm2000) discusses the “problem of diverted accountabilities” in parliamentary systems where a multiplication of principals makes political accountability harder. Given this literature, we can make the following prediction for empirical analysis:
-
• Prediction: Development program implementation is worse where multiple politicians oversee the local bureaucrat.
Existing research points to several channels that can explain how multiple principal institutional arrangements lead to worse service provision. We discuss three: (1) credit claiming, (2) free riding, and (3) bureaucratic control.
Credit Claiming
The ability to claim credit for services provided to constituents is important for politicians (Grimmer, Messing, and Westwood Reference Grimmer, Messing and Westwood2012; Weaver Reference Weaver1986). When bureaucrats report to multiple politicians, it is harder for politicians to claim effort for the work that bureaucrats put in towards development program implementation. This can be for several reasons. Voters may find it harder to attribute credit when multiple politicians oversee the bureaucrat. Politicians may also find it difficult to convince voters that the effort of bureaucrats is determined by the amount of effort politicians put in. Therefore, relative to areas under their sole control, politicians will have weaker incentives to motivate bureaucrats to perform when they also report to other politicians. This logic is consistent with a substantial body of research covering the United States and Europe on the conditions under which politicians will more easily claim credit for improving access to government services (Cain, Ferejohn, and Fiorina Reference Cain, Ferejohn and Fiorina1987; Fiorina and Noll Reference Fiorina and Noll1978a; Reference Fiorina and Noll1978b; Golden Reference Golden2003).
Free Riding
Martimort (Reference Martimort1996) shows that when multiple principals oversee a single agent, there exist incentives to free ride on the monitoring effort of other principals when the benefits of monitoring spill over between principals. Gailmard (Reference Gailmard2009) explains a similar logic when monitoring of bureaucrats can lead to information spillovers between politicians. Under such circumstances, each politician prefers to monitor the bureaucrat to a lesser degree, relying on the monitoring of other bureaucrats to provide them information about the bureaucrat. In our case, when the electoral benefits of bureaucratic effort are shared across multiple politicians, politicians will face an incentive to free ride on the monitoring of other politicians. This means that politicians will instead prefer to exert more effort towards bureaucrats under their sole influence.
Bureaucratic Control
Dixit shows that if more than one principal influences the agent and the principals have different preferences, then it will be more difficult for the principals to encourage agents to respond to incentives as agents may play multiple principals against each other (Dixit Reference Dixit1997, 378). The notion that politicians will be likely to control the behavior of bureaucrats where they are able to is consistent with a classic study from the Indian context. In it, Wade (Reference Wade1985, 467–8) argues that India’s system of bureaucratic transfers allows politicians to control bureaucrats within their jurisdictions.Footnote 6 New research on India’s bureaucratic transfer system identifies how politicians’ electoral pressures influences bureaucrats’ career investments. We will offer some original empirical analysis of this system when assessing alternative explanations below.
POLITICIANS, BUREAUCRATS, AND NREGS
This section details the context of our study. First, we provide background information on the NREGS employment program, block-level bureaucrats and their administrative boundaries, as well as state parliamentarians and their electoral constituencies. Second, we explain why politicians care about implementing NREGS, and how they are able to motivate bureaucrats who are critical to improving NREGS implementation.
A National Employment Guarantee
NREGS, the worlds largest employment program, is designed to respond to villagers’ needs for minimum-wage employment in rural areas.Footnote 7 The program is specifically designed as a social protection program for rural areas across India. It does this by hiring unemployed laborers in rural communities for up to 100 days per annum at minimum wage to work on building public goods like wells, ponds, gravel roads, and dams. The program has succeeded in increasing rural wages, created opportunities for women to work outside the home, reduced (economic) distress migration, and smoothed economic insecurity during drought or other economic downturns (Dutta et al. Reference Dutta, Murgai, Ravallion and van de Walle2014; Khera Reference Khera2011; MoRD 2013, 2014; Muralidharan, Niehaus, and Sukhtankar Reference Muralidharan, Niehaus and Sukhtankar2016). Despite these meaningful impacts, NREGS implementation is extremely uneven (Ministry of Rural Development 2013; Planning Commission of India 2014). According to our data from across India, the top decile of households work 98 days per year while the bottom decile work 17. As shown in Figure 2, NREGS implementation exhibits tremendous variation across regions, states, but also very small areas.
Implementation of NREGS varies Tremendously in India

Administrative Boundaries and Bureaucrats
Successful implementation of NREGS depends critically on bureaucrats and politicians. India’s administrative divisions divide the country into states, which contain districts, blocks, village clusters, and villages. Within the states, rural development policy is led by the Chief Minister and the Minister of Rural Development. Locally, District Collectors and Block Development Officers (BDOs) (who head districts and blocks respectively) are the critical bureaucrats for the implementation of development schemes. Note while elsewhere in this article we refer to the block-level “bureaucrat,” this is shorthand for the combined efforts of bureaucrats at the block level, who are led by the BDO.
This article focuses on BDOs who are the most important bureaucrat at the local level in rural areas. The BDO position was established across India with the commencement of the Community Development program in 1952. The creation of development blocks was intended to facilitate agricultural production and the implementation of welfare schemes in rural areas (Arora and Goyal Reference Arora and Goyal2005; Karunaratne Reference Karunaratne1976). BDOs are responsible for implementing development programs for an average of 150,000 residents. They also oversee government schemes including old age pension, housing programs for the poor, and public distribution of food.
BDOs influence the quality of NREGS implementation not simply by approving documents, but by generating new projects and selecting where they will be located.Footnote 8 These duties include selecting public works to be completed, publicizing the opportunity for work, verifying applications and maintaining a register of villagers desiring work, monitoring worksites, scrutinizing and approving payroll records for completed work, as well as accepting and addressing the grievances of scheme participants (Aiyar and Samji Reference Aiyar and Samji2009; Datar Reference Datar2007; Dutta et al. Reference Dutta, Murgai, Ravallion and van de Walle2014; Khera Reference Khera2011). Online Appendix Figure A2 shows a flowchart of NREGS operational implementation.Footnote 9 In addition, BDOs also retain significant discretion regarding 30% of NREGS funds that are allocated for use at the block level (Raabe, Sekher, and Schiffer Reference Raabe, Sekher and Schiffer2010). This makes BDOs responsible for roughly US$1.9 billion in NREGS funds in 2012–13.Footnote 10 Researchers have also signaled towards the importance of BDOs in NREGS implementation by citing frequent transfer and absence of block officials as a important variable explaining variation in NREGS implementation (Chathukulam and Gireesan Reference Chathukulam and Gireesan2008, 101). Finally, BDOs also play a critical role in the extent to which they choose to safeguard NREGS from corruption. While BDOs are tasked with maintaining program safeguards, they have also been identified as part of a corruption nexus implicating both bureaucrats and local politicians (Khera Reference Khera2011). Previous studies have identified cases where politicians have protected corrupt BDOs (Bhatia and Dreze Reference Bhatia and Dreze2006, 3201).
Electoral Boundaries and Politicians
India is the world’s most populous democracy, with more than 700 million voters. The Indian electoral system was put in place by the 1950 constitution, which initiated both a national Parliament of India (Lok Sabha) as well as State Assemblies (Vidhan Sabha). Members of Parliament are elected to the central government’s most powerful lower house chamber, while Members of the Legislative Assembly (MLAs) are elected to the state parliaments. Elections are conducted by the nonpartisan Election Commission, staffed by career bureaucrats who are required to be politically neutral (for example, they may not be affiliated with political parties) (Iyer and Reddy Reference Iyer and Reddy2013).
The boundaries of both national and state parliamentary constituencies are determined by India’s Delimitation Commission. These boundaries have been drawn and redrawn through Delimitation Acts in 1952, 1963, and 1973 following each decennial census, before a halt in 1977. Boundaries were again redrawn by order of the Delimitation Act of 2002, began in 2004 by the Delimitation Commission and was completed and implemented in 2008 (Alam Reference Alam2010, 65). The Delimitation Commission adjusts the boundaries of parliamentary and assembly constituencies to account for change in population growth. As directed by the Indian Census (Article 81(b)), the Delimitation Commission’s primary objective is to divide territory into constituencies with equal populations (within states) (Alam Reference Alam2010). Iyer and Reddy (Reference Iyer and Reddy2013) conducted a detailed analysis of this redistricting process for the states of Andhra Pradesh and Rajasthan and found little evidence of systematic political manipulation over the redistricting process.
India state-level parliamentarians, Members of the Legislative Assembly (MLAs), care about NREGS because they can use the program to win votes. MLAs are elected to five-year terms from typically highly competitive single member districts (that contain, on average, 400,000 individuals). MLA elections are typically hotly contested, and researchers have noted an incumbency disadvantage throughout the country (Ravishankar Reference Ravishankar2009; Uppal Reference Uppal2009). For MLAs, NREGS and welfare schemes function as “election winning devices” (Maiorano Reference Maiorano2014, 95). This is because NREGS is funded jointly through central and state government budgets but projects are implemented at the village level, where local politicians have an opportunity to claim credit for the quality of the program’s implementation.
By manipulating the implementation of NREGS, MLAs can redirect relatively large sums of money towards their voters. To see the relative monetary value of NREGS, consider the states of Andhra Pradesh, a NREGS success story, and Jharkhand, a relative failure. A simple comparison of MLAs in two states makes clear the few resources typically at an MLA’s disposal and the vast resources available through NREGS. In Jharkhand, MLAs have access to discretionary funds of US$480,000 and in Andhra Pradesh only US$180,000. By contrast, NREGS expenditure in 2013 was US$3.2 million per constituency in Andhra Pradesh and US$1.4 million per constituency in Jharkhand. In other words, NREGS expenditure amounted to three times the discretionary funds in Jharkhand and 20 times in Andhra Pradesh (MoRD 2013).
NREGS and the Politician-Bureaucrat Link
Politicians value how bureaucrats can help them win votes (Aiyar and Samji Reference Aiyar and Samji2009; Maiorano Reference Maiorano2014), while bureaucrats value the protection and benefits a politician can provide to their employment (Khera Reference Khera2011; Murray Reference Murray2015; Wade Reference Wade1985). Though politicians officially play little to no role in NREGS implementation, in practice their pressure may dramatically improve service delivery. Theoretically, villagers demand work as desired, local bureaucrats promptly assign villagers to nearby worksites, and villagers have their earnings automatically deposited into bank accounts. In practice, however, villagers’ access to NREGS dependents on whether or not local state machinery functions to provide opportunities for villagers, which in turn depends on the motivation of local politicians (Datar Reference Datar2007, 3457).
MLAs affect NREGS operations in several ways. MLAs influence the appointment of field officers (hired on a contract basis), who implement NREGS at the village level. MLAs pressure the local administration to provide work in their constituencies, and even target certain blocks rather than others within that constituency (Maiorano Reference Maiorano2014, 97, 103). MLAs may manipulate the selection of works (Aiyar and Samji Reference Aiyar and Samji2009, 35), lobby for certain projects that are more visible, or target politically valuable communities. In addition to generating work, BDOs may shelve projects in specific local areas if considered undesirable to an MLA they support (Maiorano Reference Maiorano2014, 98–101).
MLAs work with BDOs to influence NREGS and other welfare schemes. For instance Murray (Reference Murray2015) shows how MLAs in India influence BDO implementation of India’s Public Distribution System, a food subsidy program. Historically, MLAs ally with bureaucrats and local contractors in a “corruption nexus” where valuable development contracts are exchanged for local support and votes (Witsoe Reference Witsoe2012, 116). In exchange for assisting MLAs, Block officials gain a powerful political ally. MLAs can protect BDOs from an unwanted transfer, a bottom-up social audit, or fines for violations of the NREGS Act (Khera Reference Khera2011, 267).
A NATIONAL, VILLAGE-LEVEL DATASET
In this section we describe the process we undertook to build a village-level dataset for all of India by combining village-level census and village-cluster level data on NREGS with electoral constituency boundaries. The principal building blocks of the data are the 2001 Indian Census, the post-2008 delimitation electoral boundaries and NREGS employment data for 2013.
Spatial Data on Census Blocks and Villages
We obtained spatial data on the state assembly constituencies, blocks, and villages from the Indian Census. These data contain the geographic borders of all state assembly constituencies (
 $N=\text{4,122}$
) and blocks (
 $N=\text{6,348}$
) in India. These files also contain information on either the spatial boundary or the centroid of all villages as reported in the 2001 census of India (
 $N\approx \text{628,000}$
). Besides spatial data, we also obtained, at block and village levels, the 2001 census variables related to population, socioeconomic measures, government services, and infrastructure.
Electoral Constituencies
We collected assembly constituency-candidate level electoral records on state parliamentary elections from the Election Commission of India (2014). In the sample of state assembly elections we analyze from 2008–2012, turnout averages 70%, winning candidates gain 44% of the vote, and hold a winning margin of 11% over the runner-up candidate.
NREGS Work
We obtained NREGS data at the most micro level from the official website of NREGS.Footnote 11 We downloaded these gram panchayat (village cluster) level data for the total number of days worked per individual per year, as well as data on general employment generation through the program. Our main two outcomes are the number of villagers who worked in the program (“worked”) and the average number of days worked by individuals who took part in the program (“workdays”). We also study the sum of deposits made to the workers’ bank and post office saving accounts. NREGS uses these two modes send direct payments to workers (Muralidharan, Niehaus, and Sukhtankar Reference Muralidharan, Niehaus and Sukhtankar2016).
Building an All-India Village Dataset
Our objective was to combine spatial information on villages, block, and assembly constituencies, with outcome data from NREGS. This exercise is not straightforward for several reasons: first, census data are from 2001, and NREGS data are from 2013. This means that several new administrative units, especially districts, but more recently also states, have been formed during this period. Second, NREGS data are reported at village cluster level, with corresponding information about blocks. Census data, however, are reported at the village level, with no information about the village cluster within which they are contained. Third, transliteration of proper nouns from local languages into English can be done in several ways. This makes string matching across datasets hard.
We address these challenges by (1) identifying a new dataset that serves as a matching directory for village and village-cluster data, (2) using fuzzy matching methods, and (3) spatially joining villages to electoral constituencies using Geographic Information Systems (GIS). The resulting dataset, combining NREGS, census, and election data sources, successfully matches approximately 465,000 of India’s 628,000 villages (74%).Footnote 12 Additionally, we successfully match 93% of all blocks (5,458 of 5,845). Because NREGS is a program implemented exclusively in India’s rural areas, we expect that the matched blocks would be systematically different from unmatched ones. We find that these areas are less populous, more vulnerable, and with a higher proportion of agricultural workers (we present additional details in Table A8 in the Online Appendix J). The mean area of villages in our sample is 4.64 sq km (median = 2 sq km), while the mean area of a block is 799 sq km (median = 449 sq km).
Identifying Split Blocks
Once the matching exercise is complete we begin the process of identifying split blocks. We first identify all villages in a block. If these villages belong to more than one political constituency, we code that block as split. If all villages lie within one political constituency, we code the block as unsplit. Figure 3 shows all split blocks in India. We can see that the blocks are fairly well spread across the country. In Figure 4, we focus on the state of Jharkhand to provide a visual presentation of split and unsplit areas across a single state. We add political constituency boundaries on top of the split block map to show how the political constituency boundaries (in black) cut across the split block boundaries (in white).
Split Blocks in India

Split Blocks in Jharkhand

Summary Statistics
The analyses in this article rely primarily on two datasets. The first is a village-level dataset where each observation represents a village that is contained within a village cluster, a block, and a political constituency.Footnote 13 Second, we collapse these village data at the polygon level as illustrated in Figure 5. This dataset represents the unique intersections of each politician and bureaucrat jurisdictional area. For instance, the unsplit block represented by Polygon 1 falls in the jurisdiction of one politician and one bureaucrat, but the split block falls in the jurisdiction of two politicians (hence, two polygons). Collapsing at this level allows us to create polygon level variables and trace mean outcomes at the polygon level.
Polygon Level Data

Table A2 in the Online Appendix I presents summary statistics for this new dataset. We retain 5,460 blocks and 3,441 constituencies in 8,660 polygons. We also create a new variable which measures the number of citizens in a polygon as a share of total population in the constituency that polygon belongs to. On average, a polygon represents 35 percent of the constituency’s population. Similarly, because they are smaller geographic units, a polygon accounts for 62 percent of a block’s population on average. We check to see if split polygons look similar to unsplit polygons in Table A5 in the Online Appendix, and find that again the balance on pretreatment variables is very good. We include imbalanced variables as controls in polygon dataset analysis below.
RESEARCH DESIGN
Our empirical objective is to compare NREGS implementation for villagers under bureaucrats whose jurisdiction is split across multiple political constituencies, with NREGS implementation for villagers whose bureaucrat’s jurisdiction is wholly contained within a single political constituency. We illustrate this research design in panel A of Figure 6, where each dot refers to a village cluster, the unit at which NREGS outcomes data are available. Panel A illustrates a simple ordinary least squares regression, where village clusters in the unsplit block are compared with village clusters in the split blocks.
Illustration of Empirical Strategies

Simple comparisons of split and unsplit blocks however, may yield biased estimates of the Split coefficient. For example, Figure 3 shows that there are more split blocks in some states than others. It might be the case that the politicians with more split blocks are different than politicians in unsplit blocks. Our estimation strategy should therefore account for sources of bias of these sorts. We adopt two strategies to account for such potential bias—politician fixed effects and a geographic regression discontinuity design.
Ordinary Least Squares with Politician Fixed Effects
First, we use ordinary least squares with politician fixed effects to study within-politician differences between split blocks and unsplit blocks. Panel B of Figure 6 illustrates that adding political constituency fixed effects restricts the comparison village clusters to those lying within the same political constituency. This holds constant all shocks at the constituency or a higher level.Footnote 14
We begin by using a simple ordinary lease squares estimation strategy presented in the following equation:
 $$\begin{eqnarray}
y_{g, b, c} = a_c + \gamma {\rm SPLIT}_{b} + Z_{v,g,b,c}^{\prime} \phi + \epsilon _{v, g, b, c}
\end{eqnarray}$$
where y
g, b, c
is NREGS outcomes at the gram panchayat level g which is located in both block b and assembly constituency c. Political constituency fixed effects, ac
, account for any common shocks at the constituency level.
 $\text{SPLIT}_b$
is the block-specific treatment variable that equals 1 if a block is split between more than one political constituency, and zero otherwise. We include a vector of all unbalanced village-level control variables, Z
′
v, b, c
, which we describe in the following section. As a split block is split simultaneously for more than one political constituency, we cluster standard errors at the block level.
Geographic Regression Discontinuity
Controlling for common shocks at the constituency level may still yield biased results if split blocks are systematically different from unsplit blocks. Consider a thought experiment where two villages are observably identical on pretreatment covariates, but lie on opposite sides of a border that separates a split and an unsplit block. If the villages are sufficiently similar on observable characteristics, we can say that the only differences that remain between the two types of villages is that they lie in different blocks. We approximate this thought experiment with a geographic regression discontinuity empirical design that restricts attention to villages geographically proximate to a boundary dividing a split and unsplit blocks. Panel C of Figure 6 illustrates this geographic RD design, which we estimated as follows:
 $$\begin{eqnarray}
&&y_{g,b,c} = a_c + \gamma {\rm SPLIT}_{b} + f(X_{v,g,b,c},Y_{v,g,b,c}) + B_{b^S, b^{US},c}\nonumber\\
&&\quad + \,Z_{v,g,b,c}^{\prime} \phi + \epsilon _{v,g,b,c} \, \forall \ {v,g,b,c} \ \ s.t. \ \ X_{v,g,b,c},Y_{v,g,b,c}\nonumber\\
&& \quad\in\, (-h,h),
\end{eqnarray}$$
where f(X v, g, b, c , Y v, g, b, c ) is a flexible function in two dimensions, latitudes (X) and longitudes (Y) for every village v in gram panchayat g, block b, and assembly constituency c. We include boundary fixed effects B bS , bUS , c , where each boundary refers to the border that is shared by a split block bS and an unsplit block bUS . We assign the closest block boundary to each village in our data so that we compare units that provide the closest approximation to random assignment. We follow Michalopoulos and Papaioannou (Reference Michalopoulos and Papaioannou2011) and Dell (Reference Dell2010) in including a smooth function in longitudes X and latitudes Y.Footnote 15 Adding these geographic controls in a flexible way helps the regression absorb spatial trends that might be superfluously driving the results. Again, we add constituency fixed effects to absorb common shocks at the politician level. Finally, in the analysis that follows, we show the robustness of our results at varying bandwidths (h). For each village in the data, h refers to the distance to the nearest block boundary in kilometers.
Analysis of Balance with Census Data
We study pretreatment covariates, to examine potential differences between split and unsplit blocks that may confound the identification strategies introduced above. With census data at the village level from the Indian Census of 2001, we are able to analyze the extent to which split blocks observably resemble unsplit blocks—our empirical counterfactual of interest.
For instance, one general issue in studying changes in employment, is the challenge of potentially simultaneous changes in supply and demand (Angrist and Krueger Reference Angrist and Krueger2001). While we have presented, in the theoretical section above, predictions linked to supply, villagers might in fact have greater demand for NREGS in unsplit areas. While we cannot measure demand directly, we individually select a group of variables from the census we expect to be highly correlated with villager demand for NREGS. We expect villages to have greater demand for NREGS if they have higher (a) level of unemployment, (b) higher percentage of economical marginalized populations such as Scheduled Castes and Scheduled Tribes, (c) proportion of the population that is not literate, (d) proportion of agricultural laborers, (e) proportion of marginal workers, (f) proportion of cultivators who are sensitive to rain-fed agricultural, and (g) if there are no education facilities.
As shown in Table 1, we find very little imbalance across split and unsplit areas with regards to these proxies for demand. For the OLS specification we observe statistically significant differences at the five percent level for Percentage Illiterate. However, substantively this is a small difference of 0.003 standard deviations. For the RD specification we observe only one marginally statistically distinguishable covariate, Percentage Unemployed (p = 0.07), and again this variable is substantively similar in split and unsplit blocks (a difference of only 0.003 standard deviations).
Balance Table: Demand Hypothesis

Notes: This table presents balance between treated and untreated units using the OLS specification in panel A, and the geographic RD specification in panel B. In panel A, the “Difference” column represents the treatment effect of split on each index in rows. This regression includes area of block as a control, as well as constituency fixed effects. Standard errors are clustered at the block level. Panel B reports the treatment effects from a similar regression but also includes boundary fixed effects and a flexible function in village centroid longitudes (x) and latitudes (y). This is of the form x + y + x 2 + y 2 + xy + x 3 + y 3 + x 2 y + xy 2.
Beyond examining these correlates of demand, we take a more systematic approach to analyzing balance across more than 140 census variables with the following procedure. To manage the vast number of census variables and make the comparison substantively meaningful, we collapse these census variables into 14 categories by taking the simple mean of their standardized values, and then standardizing the means—a process described in Online Appendix U. Table A1 in the Online Appendix presents summary statistics for these indices. We analyze balance across split and unsplit blocks in Table A4. We can interpret the coefficient as standard deviation differences between split and unsplit blocks.
Overall, we find very little substantive imbalance across split and unsplit blocks for both the OLS and geographic regression discontinuity models. In Table A4, we observe no more than 0.01 standard deviations imbalance across all of the 14 census indices for both the OLS and RD models. Nevertheless, in the following analyses we always include any imbalanced index as a control in our regressions. Additionally, we find strong evidence of balance for the Geographic RD specifications in Figure A4 in the Online Appendix, where we present p values for differences between split and unsplit blocks for all 14 indices over bandwidths of 3–50 kilometers around the threshold boundary.
MAIN RESULTS
We examine two NREGS outcomes: the total number of workdays and the total number of people who worked on NREGS projects. We add one and take the natural log of these outcomes so that the coefficient on split can be interpreted as the percentage difference in outcomes between split and unsplit blocks.
Table 2 presents the main results. In column (1) we use the OLS specification and find a negative and statistically significant relationship between a block being split and the logged number of workdays. In split blocks we observe 10.6 percent fewer NREGS workdays. In column (2), we use the geographic RD design to compare villages within a 25 kilometer bandwidth and observe 8.8 percent fewer workdays for split block villages. Column (3) shows that split places have about 8.4 percent fewer individuals who worked on a NREGS project in 2013. This results is robust to the geographic RD identification strategy as shown in column (4), with a treatment effect of 7.1 percent. Table 2 shows that not only are fewer people employed in NREGS in split blocks, those individuals who do work under NREGS receive fewer workdays.
The Effect of a Split Bureaucrat on NREGS Implementation

Notes: *p < 0.1, **p < 0.05, ***p < 0.01. Standard errors are clustered at the block level. All models include a control for area of block. Census controls for columns (1) and (3) include Population and Non-Agricultural worker indices. Geographic RD models include boundary fixed effects and a flexible function in village centroid longitudes (x) and latitudes (y) of the form x + y + x 2 + y 2 + xy + x 3 + y 3 + x 2 y + xy 2.
Online Appendix M shows these results are robust across several tests: Table A10 in the Online Appendix replicates the OLS specification after collapsing our dataset to the polygon-level; Table A11 presents results on a restricted sample where blocks are split across fewer than six constituencies; Table A12 presents results where outcomes are in levels rather than natural logs; Table A13 presents the geographic RD across several functional forms of the control function; and Figure A5 presents the same across multiple bandwidths. Finally, we use randomization inference to show that the observed treatment effect lies outside the distribution of hypothetical treatment effects in Figure A6, indicating that the actual treatment effect is not observed by chance (Gerber and Green Reference Gerber and Green2012).
Treatment Effects by Number of Splits
Next, we examine whether our treatment effects are stronger as the bureaucrat reports to an increasing number of politicians. We examine the effect of a new variable that measures the number of times a block is split on our outcomes of interest.Footnote 16 Our results, shown in Table 3, indicate that the treatment effect increases as bureaucratic jurisdictions are split across more constituencies. Taking Columns (2) and (4) as our benchmark models, the marginal effect of each additional split is 5% fewer workdays and 4% fewer individuals employed in NREGS.Footnote 17
Multiple Principal Problem Increases in the Number of Splits

Notes: *p < 0.1, **p < 0.05, ***p < 0.01. One split, Two splits . . . are indicators that take a value of 1 if a block is split one, two, three, or four times (respectively), and 0 if the block is unsplit. Standard errors are clustered at the block level. Census controls for columns (1), (3), (5), and (7) include Population and Non-Agricultural worker indices. Geographic RD models also include boundary fixed effects and a flexible function in village centroid longitudes (x) and latitudes (y) of the form x + y + x 2 + y 2 + xy + x 3 + y 3 + x 2 y + xy 2.
MECHANISMS
Above, we discussed three mechanisms that help explain why NREGS delivery is worse in split bureaucratic areas: credit claiming, free riding, and bureaucratic control. In this section, we conduct three tests to determine if we find support for any of these mechanisms. As we lack the ability to experimentally manipulate each mechanism in a controlled setting, we focus primarily on the heterogeneous effects of our main results, utilizing additional causal identification strategies where possible. Taken together, these tests allow us to assess the extent to which multiple tests reveal consistent evidence on a mechanisms while holding others constant.
Party Coordination and Politician Effort
The degree to which politicians are able to coordinate should affect the performance of split bureaucrats. When costs increase, politicians should exert less effort, and bureaucratic performance should decrease. We postulate that the cost of political effort is higher when two politicians from different parties monitor a bureaucrat, compared to instances where they belong to the same party.
This may be so for several reasons: (1) Voters in blocks split across multiple politicians will have an easier job giving credit to politicians if they both belong to the same party. (2) Politicians from different parties may also have more difficultly controlling the local bureaucrat when they are from different parties. For instance, if politicians are from the same party they may learn from each other how to most effectively motivate the local bureaucrat. (3) Politicians from different parties are more likely to send conflicting messages due to differing party platforms. More generally, politicians may want to be sure that a neighboring politician from another party does not benefit from their effort towards monitoring the local bureaucrat.
We develop a test to isolate exogenous variation in whether blocks are split between politicians from the same or different parties. We analyze close elections in constituencies that share a split block. We compare outcomes in a politician’s area when the neighboring politician barely wins an election and belongs to a different party, with outcomes when the neighboring politician barely wins and belongs to the same party. We illustrate this empirical strategy in Figure 7. For this test we restrict our sample to blocks that are split between two politicians.
The Effect of a Neighboring Politician Belonging to a Different Party

We follow Hahn, Todd, and der Klaauw (Reference Hahn, Todd and Van der Klaauw2001) and use a local linear function as an estimate of this control function. To reduce bias in this estimation, such that we estimate the “as-if” random assignment of party affiliation, we focus on narrow victory margin bandwidths of 1 and 0.5 percent differences in the margin of victory. We include state fixed effects to account for common shocks at the state level.Footnote 18
Table 4 presents the results. Columns (1) and (2) show that when a neighboring politician barely wins an election (margin of 1%) and belongs to a different party, total workdays fall. Similarly, Columns (3) and (4) examine impacts on the number of people who worked and find negative treatment effects. We plot these results graphically in Online Appendix Figure A8. Online Appendix Figure A9 plots treatments effects over several bandwidths and shows that the point estimate for both outcomes is stable around 50% treatment effect.
Different Party Wins Election in Neighboring Constituency

Notes: *p < 0.1, **p < 0.05, ***p < 0.01. Standard errors are clustered at the block level. Every model includes a victory margin in the neighboring constituency and its interaction with “Different party.” Victory margin is positive if a different party wins the election in the neighboring constituency for the same block, and negative if the same party wins. All models include controls for the area of the block as well as Communications, Bank, and Urbanization indices.
Compared to politicians belonging to the same party, when different party politicians concurrently monitor a block, we observe worse NREGS outcomes. As we only compare blocks that are split once, we can rule out free riding as an explanation for this result. However, this finding is consistent with the other two mechanisms. First, assuming that party affiliation figures in citizens’ voting decision, it should be easier for politicians to claim credit for better NREGS performance ex-post when politicians of the same party control the bureaucrat. Second, politicians of the same party should face fewer transaction costs in monitoring bureaucrats. Therefore, our results are also consistent with the bureaucratic control mechanism.
Treatment Effects by Political Importance
Next, we explore if the relative political importance of the bureaucrat’s area matters for NREGS outcomes. For each polygon—a unique politician-block area—in our data, we define the political importance as the proportion of the constituency’s population which lives in that area. As political importance increases the politician’s incentive to motivate the bureaucrat, we expect to observe differential increases in development program implementation in split versus unsplit bureaucratic areas.
Empirically, we test for this within a given politician’s constituency by comparing bureaucratic performance in split and unsplit blocks when we vary the proportion of the population contained in that area. We interact the treatment variable (Split) with three indicator variables—“Low Proportion” for polygon areas with a population representing less than or equal to 1/3 of the population of the entire constituency, “Medium Proportion” for a proportion between 1/3 and 2/3, and “High Proportion” for a proportion above 2/3.Footnote 19 The proportion of the population in a constituency proxies the number of voters, as we expect politician effort to increase in the number of voters in a given polygon.
Two key results emerge from our analysis presented in Table 5: First, as an area becomes more politically important, the difference between politician behavior in split and unsplit areas diminishes. For low proportion areas, that are politically less important, there are 17.4% fewer workdays in split areas, and NREGS workers in these areas work 22.6% fewer days compared to unsplit areas with similar proportions. By contrast, for high political importance areas, there is no statistically significant difference between split and unsplit polygons. Second, even within split places, politicians seem to focus on places that carry the most rewards. This is shown by low p values that test the difference between high proportion and low proportion areas within split blocks. Critically these results support only the credit claiming mechanism. To rule out free riding, we include number of split fixed effects in columns (3) and (4), and find consistent effects. The bureaucratic control mechanism is held fixed for this test because we exploit only within politician variation across blocks with more or less voters.
Political Importance Mitigates the Effect of Split

Notes: *p < 0.1, **p < 0.05, ***p < 0.01. Standard errors are clustered at the block level. Census controls include Population, Minority and Non-Agricultural worker indices. Proportions refer to share of the constituency’s population represented by the polygon in fractions of thirds.
Treatment Effects by Indian National Congress Winners
To test for credit claiming more directly, we focus on the Indian National Congress (INC), India’s national party best able to claim credit for the NREGS. Congress has leveraged NREGS even before it was passed as a populist tool when it was in the minority as a tool to fight its main rival, the Bharatiya Janata Party (BJP) (Chopra Reference Chopra2011, Reference Chopra2014). After its enactment Congress was rewarded by the electorate for the program (Jaffrelot and Verniers Reference Jaffrelot and Verniers2009; Dasgupta Reference Dasgupta2015). If INC politicians are able to claim more credit for the implementation of NREGS, we should expect (1) INC politicians to exert more effort to ensure successful NREGS implementation, and (2) INC politicians to exert more effort in split areas relative to non-INC politicians.
To investigate the first claim, we study close elections that quasi-randomly allocate an INC or non-INC politician to a constituency from the previous elections. We compare NREGS outcomes in constituencies where an INC politician barely won the previous election with those constituencies where the INC politician barely lost. To reduce bias in this estimation, such that we estimate the as-if random assignment of party affiliation, we focus on narrow victory margin bandwidths of 1% and 0.5%. We include state fixed effects to account for common shocks at the state level.Footnote 20
Table 6, panel A, columns (1)–(4), shows that NREGS performance is significantly better on average when an INC politician narrowly wins an election.Footnote 21 Next we investigate if the main effect of a split block is smaller in constituencies where the politician belongs to INC.Footnote 22 As shown in columns (5)–(8) by the coefficient on the interaction terms, we observe that the difference between split and unsplit blocks is smaller in INC constituencies versus non-INC constituencies. This effect becomes statistically significant in narrow margin of victory bandwidths in columns (6) and (8).
The Effect of an INC Politician

Notes: *p < 0.1, **p < 0.05, ***p < 0.01. Standard errors are clustered at the constituency level in columns (1)–(4), and at the block level in columns (5)–(8). Columns (1)–(4) includes a victory margin and its interaction with ‘INC politician.’ Victory margin is positive if an INC politician wins the election, and negative if the same party wins. Census controls include Irrigation index, as well as block area. All models include a flexible function in village centroid longitudes (x) and latitudes (y) of the form x + y + x 2 + y 2 + xy + x 3 + y 3 + x 2 y + xy 2.
These results provide support for the credit claiming mechanism. The free riding mechanism is ruled out as we examine differences between split and unsplit blocks across INC and non-INC politicians. This holds constant the free riding incentive. To check for the possibility that INC politicians may exert greater influence over bureaucrats, we interact our effects with an indicator variable for whether the INC party also controls the state government.Footnote 23 If INC was the majority party in the state, we postulate that INC politicians should have an easier time controlling the bureaucracy.
We find mixed evidence for the bureaucratic control mechanism in panel B of Table 6. Columns (1)–(4) show that NREGS outcomes are better in INC winners’ constituencies. Outcomes are also better in places where INC controls the state, though only the Workdays outcome is statistically significantly. Columns (5)–(8) show that the negative effect of a split bureaucrat is lower in INC politicians’ areas, and that it is further weakened in INC states. These final effects however, are not statistically significant. Overall, these results provide support for the explanation that INC politicians are able to better claim credit for NREGS outcomes, which reduces the overall negative effects of split bureaucrats. However, we find only weak evidence for the bureaucratic control mechanism.
Summary of Mechanisms
In Table 7, we summarize our analysis of mechanisms. We find evidence consistent with the credit claiming mechanism across three separate mechanism tests, with weak evidence in support of the bureaucratic control mechanism.
Mechanisms Summary

ALTERNATIVE EXPLANATIONS
A number of alternative explanations could explain why we observe worse program implementation in split blocks. In this section, we evaluate four such explanations.
Collusion Between Politicians and Bureaucrats
One alternative interpretation of our main results is that collusion between politicians and bureaucrats drives worse NREGS performance in split blocks. Indeed, the literature on NREGS examines how elite capture, leakages and corruption are central challenges to successful program implementation (Raabe, Sekher, and Schiffer Reference Raabe, Sekher and Schiffer2010; Shankar and Gaiha Reference Shankar and Gaiha2013). This is a concern for our design if, relative to split bureaucrats, politicians find it easier to influence unsplit bureaucrats to artificially report higher NREGS performance. This can allow the politician to steal earmarked funds generated by this inflation of workdays. One way this may happen is if bureaucrats report workdays for “ghost” workers (who exist only on paper), and then transfer a part of this money to the politicians (Bhatia and Dreze Reference Bhatia and Dreze2006; Muralidharan, Niehaus, and Sukhtankar Reference Muralidharan, Niehaus and Sukhtankar2016).
To test if this is the case, we examine the flow of money in NREGS, presented in Table 8. First, if the observed treatment effects are driven entirely by reported workdays instead of the money paid to NREGS laborers, we should find no relationship between split and deposits. However, we do in fact find a statistically significant relationship between split and deposits to workers’ bank accounts. This analysis however, is limited to the subsample for which we have data on deposits. One potential concern here is that data are systematically missing across split and unsplit blocks, which may signal collusion in instances where data is missing. To address this concern, we examine if the missing data is systematically correlated with the treatment in Online Appendix S. We find that that split only increases the likelihood of data being missing by 0.7 percentage points (0.007 on a scale of 0 and 1, the scale of the outcome variable). This accounts for 126 observations in the geographic RD model, out of the total 215,002 observations. We interpret this as a precisely estimated yet negligible amount of missingness, allaying concerns that missingness of data is correlated with the treatment.
Deposits and Ratio of Workdays to Deposits

Notes: *p < 0.1, **p < 0.05, ***p < 0.01. The outcome for columns (5) and (6) is the ratio of unlogged workdays to unlogged deposits (see Online Appendix D). Standard errors are clustered at the block level. All models include a control for area of block. Census controls for columns (1), (3) and (5) include Population and Non-Agricultural worker indices. Geographic RD models also include boundary fixed effects and a flexible function in village centroid longitudes (x) and latitudes (y) of the form x + y + x 2 + y 2 + xy + x 3 + y 3 + x 2 y + xy 2.
Second, we measure the mismatch between workdays and money paid to workers by calculating the ratio of reported workdays to amounts deposited in laborers’ accounts. If the effect of split on implementation is driven by changes in leakages, we would expect split to predict a negative and statistically significant ratio, however we find no statistically discernible effect of split on the ratio between Workdays and Deposits.
Additionally, we note that workday and worker outcome variables are approved by village and block-level bureaucrats, while data on financial disbursements are sent and recorded by state-level government officers. This relatively independent generation of data lends support to the conclusion that financial collusion does not differ systematically across split and unsplit bureaucrats.
Political Manipulation of Boundaries
The second alternative explanation is that politicians are able to influence the delimitation process of electoral boundaries in such a way that explains the effect of split blocks on NREGS implementation. This could be the case if the eventual split areas were initially less politically important, and politicians preferred to keep important areas under their sole influence. We first note that split and unsplit blocks look very similar on census covariates. This should allay concerns that the ex ante political importance of areas determines the main effects we observe in this article.
Next, consider the possibility that politicians on the 2001 Delimitation Commission altered their own constituencies boundaries, a possibility raised by (Iyer and Reddy Reference Iyer and Reddy2013), thereby leading to worse outcomes in split blocks. As Associate Members on the Delimitation Commission included Members of Legislative Assembly, we investigate the possibility that their actions in fact drove the effect of split on service delivery. To complete this analysis, we identified the assembly constituency for each of the 77 of the 135 MLAs who were Associate Members of the Delimitation Commission in our data. As shown in Table 9, we find no evidence that having a delimitation commission member as the constituency’s politician affects the probability that a post-delimitation block becomes split. We also find no evidence that the effect of split on NREGS workdays is driven by constituencies whose MLAs were members of the commission.
The Effect of Membership in the Delimitation Committee

Notes: *p < 0.1, **p < 0.05, ***p < 0.01. Standard errors are clustered at the block level. All models include a control for area of block. Census controls in columns (1), (3) and (5) include Population and Non-Agricultural worker indices. Geographic RD models include boundary fixed effects and a flexible function in village centroid longitudes (x) and latitudes (y) of the form x + y + x 2 + y 2 + xy + x 3 + y 3 + x 2 y + xy 2.
Finally, we test whether the effect of split is explained by areas where political boundaries changed using GIS (with details in Online Appendix T). Again, we find no evidence that constituencies with changed borders predicts whether a block was split, nor differential changes in our treatment effects.
Strategic Transfer of Bureaucrats
Another alternative explanation is that politicians strategically transfer poorly performing bureaucrats to split blocks. Of relevance for this study, Iyer and Mani (Reference Iyer and Mani2012) do not find robust evidence that politically induced transfers have negative impacts on development at the district level. This explanation is one of a broader set of alternatives whereby the process by which bureaucrats are transferred, endogenously selects certain types of bureaucrats to split areas.
Using the framework in Alt, Bueno de Mesquita, and Rose (Reference Alt, de Mesquita and Rose2011), we hypothesize that bureaucrats who are at the beginning of their careers, with less experience in office, and those near retirement, with weaker career-advancing incentives, are more likely to be “poor quality” bureaucrats. If selection of bureaucrats explains our results we should expect that poor quality BDOs are disproportionately transferred to split blocks. In addition, bureaucrats who are expected to perform worse, such as those that are nearing retirement, should ask to be sent to split blocks where there is less political oversight (Chathukulam and Gireesan Reference Chathukulam and Gireesan2008).
While we found no systematic data on bureaucratic transfers across Indian states, we were able to compile a dataset of all block official transfers for the years of 2011 and 2012, for the Indian state of Kerala. We gathered these from official transfer reports. From the Kerala data we identified BDOs who were (a) transferred from existing BDO posts, (b) promoted from lower rank administrative positions, or (c) newly hired. Table 10 presents the three results: First, we find no evidence of differential BDO appointments to split blocks overall (column 1). Second, we find that newly hired BDOs are not disproportionately transferred to split blocks (columns 2–4). In addition, we find that transfers that result in a promotion, a potential indicator of “high quality” bureaucrats are just as likely for split blocks. Third, we find no evidence that BDOs near retirement disproportionately request to be transferred to split blocks (column 5), nor are BDOs near retirement more likely to be transferred to split blocks (column 6).
Transfer of Block Development Officers (BDO) in Kerala, 2011–12

Notes: *p < 0.1, **p < 0.05, ***p < 0.01. The unit of observation for column (1) is block year. The unit of observation is transfers for columns (2)–(4) and (6). The unit of observation for column (4) is choices of block development offices. The outcome for column (1) is number of transfers in a block year. The outcome for column (2)–(4) are binary measures of whether a transfer involved a transfer of an existing BDO, promotion of a subordinate to BDO status, or hiring of a new BDO. The outcome for column (5) is a binary measure of whether a BDO who was transferred expressed an interest to be transferred to a split block, where each BDO was allowed to state three choices. The outcome in column (6) is a binary measure of whether a BDO was transferred to a split block. Standard errors are clustered at the block level for columns (1)–(4), and at the Block development officer level for columns (5) and (6).
Together these results show no disproportionate transfer of BDOs overall in our data, and that the BDOs we expect to perform poorly are also not disproportionately transferred to split blocks. While this reduces concerns that the transfer of bureaucrats explains why split blocks suffer worse development implementation, these findings also suggest that the transfer of bureaucrats, a type of bureaucratic control mechanism, may explain little of the main results.
Projecting State Power into the Periphery
A final alternative explanation is the possibility that the impact of split blocks on development outcomes is driven by the difficulty of the state extending governance in peripheral and rural areas (Herbst Reference Herbst2000). If split blocks are more prevalent in peripheral areas, worse development outcomes could be caused by the state’s difficulty in projecting power in split blocks. We first estimate whether distances from villages’ geographic location to the state capital and assembly constituency centroids predict split block status. Second, we assess whether the main results are robust to controlling for several measures of these distances. As we show in Table 11, neither distance between a village and the state capital nor to the assembly constituency centroid predict split status. This finding is robust to the inclusion of a flexible function for the distances.
Split Blocks and the Periphery

Notes: *p < 0.1, **p < 0.05, ***p < 0.01. Standard errors are clustered at the block level. All models include a control for area of block. Census controls in columns (1), (3) and (5) include Population and Non-Agricultural worker indices. Geographic RD models include boundary fixed effects and a flexible function in village centroid longitudes (x) and latitudes (y) of the form x + y + x 2 + y 2 + xy + x 3 + y 3 + x 2 y + xy 2.
CONCLUSION
Bringing the Results Together
We study the relationship between politicians and bureaucrats to understand the dramatically uneven implementation of the world’s largest employment program. We show that the uneven overlap of political boundaries has a large impact on the functioning of NREGS, as measured at the village level across the whole of India. We present three pieces of evidence that villages in unsplit bureaucratic areas receive better access to state-provided employment opportunities. First, unsplit villagers are able to work 9% more workdays under NREGS. Second, unsplit areas employ 7% more individuals in NREGS. Third, we show that the magnitude of these effects increase as the number of split blocks within a single constituency increases. We argue that in blocks where bureaucrats report to more than one politician, politicians are able to claim less credit for effort they expend on motivating their local bureaucrat to faithfully implement India’s most critical development program. We support this credit claiming account with evidence from three separate empirical tests, while finding only weak evidence of a bureaucratic control mechanism.
How Large are the Effects? Back of the Envelope Calculations
Our results show a sizable negative relationship between split blocks and NREGS outcomes. An 8% decrease in workdays correspondents to approximately 1,000 fewer workdays in split village clusters in 2013. For an average working population of about 2,200 people in a given village cluster, this is about 0.45 fewer workdays per eligible household.Footnote 24 At the village cluster level, this fall in workdays amounts to a US$2,400 shortage in income injection. Note that NREGS is not desirable for affluent villagers, and as a result this rough calculation understates the effect of split for those most in need of the “minimum employment guarantee.”
Similarly, a 7% decrease in the number of people who worked in NREGS in 2013 corresponds to roughly 39 fewer people working in split blocks. If we apply the average of 6.4 workdays for NREGS laborers for the 39 individuals who did not work in split areas, we find a shortfall of 250 workdays, and a corresponding financial cost of roughly US$600 per village cluster. The joint effect of fewer people working and fewer workdays for those working is a US$3,000 penalty for village clusters that fall in split bureaucratic areas.
Contribution to Research on NREGS and India
Growing research on NREGS has examined the impact of the program on socioeconomic outcomes such as wages and employment (Dutta et al. Reference Dutta, Murgai, Ravallion and van de Walle2014, Reference Dutta, Murgai, Ravallion and van de Walle2012; Imbert and Papp Reference Imbert and Papp2015), fund allocation (Banerjee et al. Reference Banerjee, Duflo, Imbert, Mathew and Pande2014; Gupta and Mukhopadhyay Reference Gupta and Mukhopadhyay2014), and political violence (Fetzer Reference Fetzer2014; Khanna and Zimmermann Reference Khanna and Zimmermann2015). However, we know of no published research that has systematically explained the substantial microlevel variation in the quality of implementation at the local level across all of India at the village, village cluster, or block levels. We provide statistically precise and substantively meaningful evidence that the political incentives substantially affects the delivery of the government’s most important development scheme.
In addition, this article contributes an approximate 465,000-unit, village-level dataset that integrates political and administrative boundaries, more than 140 village census variables, village-cluster measures of NREGS performance, and spatial information (e.g., longitudes and latitudes, and distances to relevant political capitals) across the whole of in India. Additionally, our data locate each village spatially within development blocks, assembly constituencies, districts, parliamentary constituencies, and states. With what we believe to be a more geographically precise mapping of administrative/census units to political constituency units than exists in currently published research, we provide a dataset that we hope will be useful to other social scientists studying India (Kumar and Somanathan Reference Kumar and Somanathan2009).
Jurisdictional Overlap in India and Beyond
Our results have important implications for the design of development programs in the presence of jurisdictional overlaps—both horizontal overlaps that we explore in this article—as well as vertical jurisdictional overlaps, as developed in the broader literature (Berry Reference Berry2008). Below, we briefly discuss examples of other cases of vertical and horizontal overlap of political boundaries in India, Pakistan, the United States, and South Korea, where our findings may be relevant.
In India, overlap of the jurisdictions of state assembly politicians and block development officers has a substantial impact on service delivery. Nath (Reference Nath2015), in examining the overlap national parliamentarians and bureaucrats in the context of a different local development scheme, finds that electoral competition affects bureaucratic performance. Further, across all Indian states, citizens are represented not by a single politician but by village-level, block-level, district-level, state-level, and national-level elected representatives—often leading to vertical jurisdictional overlaps. This complicates politician-bureaucrat interactions, as bureaucrats may need to answer to several elected representatives.
In Pakistan, horizontal overlap of the sort explored in this article is present across the entire country. For instance, the jurisdictions of the Members of Provincial Assemblies (MPA) overlap imperfectly with counties (tehsils) that form the jurisdiction of many important local level bureaucrats, whose performance is critical for services delivery. Gulzar (Reference Gulzar2015) studies the impact of the election of a governing party MPA on health sector service delivery by exploiting within bureaucrat variation in rural health service delivery.
In the United States, we observe similar horizontal and vertical overlap of political boundaries. Berry (Reference Berry2008) has systematically studied vertical jurisdictional overlap, finding that as the number of local government entities increase, so too does the level of government spending. In the United States we also observe horizontal political jurisdictional overlap. For instance in the state of Pennsylvania, county political boundaries sometimes unevenly overlap with school district boundaries (Pennsylvania Legislative Data Processing Center. May 08, 2013).Footnote 25
Last, in South Korea, counties (sigungu), which elect mayors in local elections, are often divided between National Assembly (NA) districts from which Members of National Assembly are elected in the general election. These counties may (a) be perfectly contained within a single NA district, (b) be divided across multiple NA districts, as is the case for large cities—for instance, Suwon City, located within Seoul, elects both a mayor and head, but spans several legislative districts. Finally, (c) multiple counties may be contained in a single National Assembly district, as is the case in rural areas.
Implications for Jurisdictional Design
Political and bureaucratic boundaries frequently change. Beyond India, “Japan, Kenya, Lesotho, Malaysia, Mauritius, Mexico, Nepal, Nigeria, Pakistan, Papua New Guinea, Tanzania, the United States, and Yemen all have electoral laws or constitutional provisions requiring delimitation at least every 10 years” (ACE Electoral Knowledge Network 2013, 34). We provide evidence that the design of jurisdictions can have important consequences for the decision calculus of politicians and bureaucrats, which is critical to the successful implementation of such programs (Berry Reference Berry2009). Our results suggest that policymakers should pay heed to the impact these changes can have on the incentive structures facing both politicians and bureaucrats. In doing so we join a nascent literature that examines the impact of jurisdictional design on government performance (Grossman, Pierskalla and Dean Reference Grossman, Pierskalla and Dean2016).
Implications for the Design of Development Programs
Political influence in the implementation of development programs is typically viewed with suspicion (Callen et al. Reference Callen, Gulzar, Hasanain and Khan2014; Faccio, Masulis, and McConnell Reference Faccio, Masulis and McConnell2006). Politicians are seen as rent extractors who aim to pilfer money or channel development spending to a narrow group of supporters. We present evidence of substantial variation in the degree to which politicians exercise influence within their jurisdictions. We show that politicians, facing the right electoral incentives, can have a positive impact on the success of rural government programs. This finding supports a standard political accountability model where electoral incentives improve political oversight.
Given the importance of electoral incentives, we should not be surprised that many large scale development programs are named after important political figures. NREGA for instance, was renamed after Mahatma Gandhi, one of Indian National Congress’s most important founding ideological leaders. Similarly, the Benazir Income Support Program in Pakistan, a conditional cash transfer program, was started by the Pakistan Peoples’ Party and named after its late leader and former Prime Minister of Pakistan, Benazir Bhutto. Politicians realize that large development programs offer them an important opportunity to earn favor with voters. Development program designs that help politicians claim credit will strengthen democratic accountability and improve service delivery.
SUPPLEMENTARY MATERIAL
To view supplementary material for this article, please visit https://doi.org/10.1017/S0003055416000502.
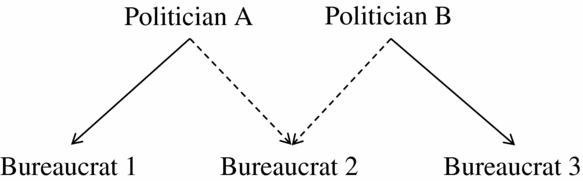
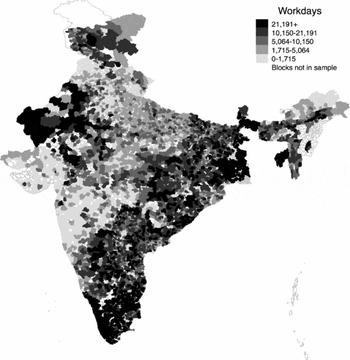
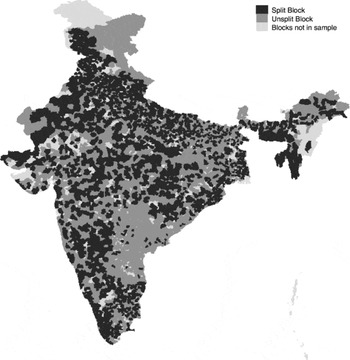
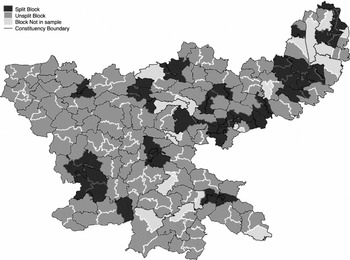
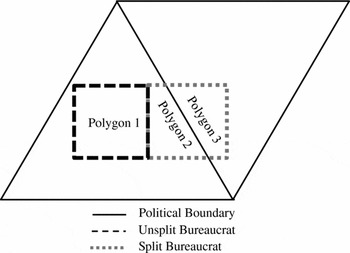
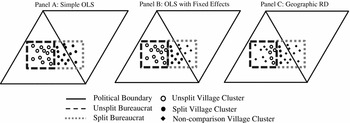
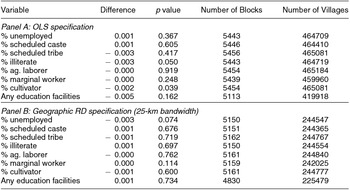
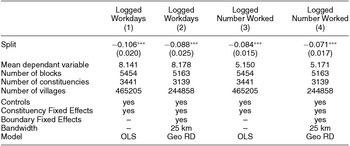
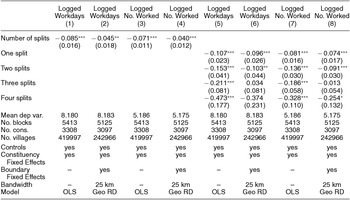
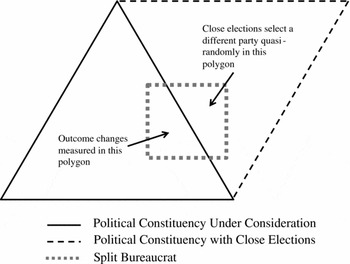
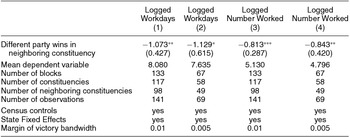
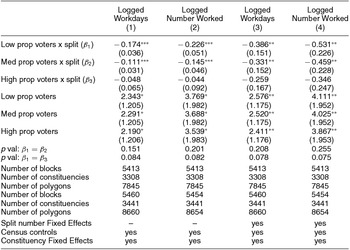
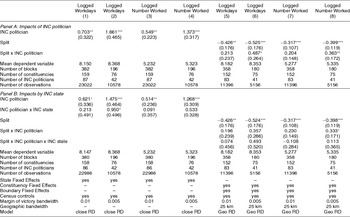

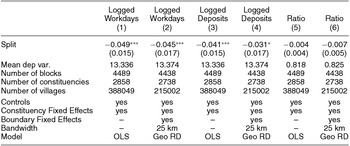
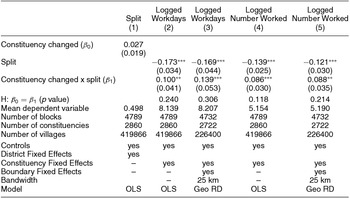
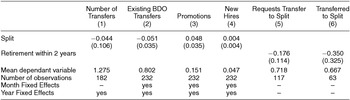
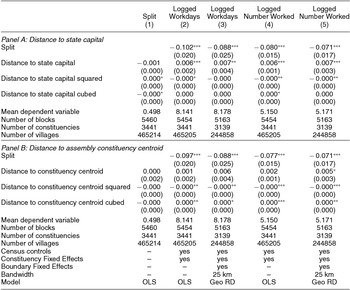




Comments
No Comments have been published for this article.