


Introduction
Assessing glacier change in the polar regions, particularly in the Antarctic, has been difficult because of the distance and expense involved in conducting the fieldwork. Fieldwork also limits the spatial scope of the measurements due to the logistics of surface movement. Monitoring glaciers in the polar regions is an important component of studying the effects of climatic change because the rate and magnitude of change are expected to be greatest in those regions (Reference SerrezeSerreze and others, 2000). To monitor glacial change efficiently over broad regions requires the use of remote-observation methods. Currently, remote monitoring includes airborne laser altimetry of alpine glacier altitude (Reference EchelmeyerEchelmeyer and others, 1997), and satellite remote sensing (Advanced Very High Resolution Radiometer and Landsat) of ice-shelf extent (Reference Scambos, Nereson and FahnestockScambos and others, 1998). An important glacial feature that can be tracked on dry polar glaciers is the position of the equilibrium line.
The equilibrium line separates the zone of net mass accumulation from the zone of net mass loss (ablation) at the end of the melt season. The equilibrium-line altitude (ELA) relative to the distribution of glacier area with altitude is an important characteristic for determining the state of the glacier’s mass balance (Reference PatersonPaterson, 1994). This presumes that the gradient of mass balance with altitude is relatively constant from year to year, but the intercept is shifted. Unlike glacier-length (terminus-position) changes, the ELA is entirely controlled by climatic processes and is not influenced by the behavior of glacier flow. In contrast to temperate or subpolar glaciers, the ELA on polar glaciers is the same as the snowline because there is nom elting. One of the most attractive techniques for tracking the ELA on polar glaciers is satellite synthetic aperture radar (SAR) since it covers broad areas, it images through clouds, and it is self-illuminating. These attributes are particularly useful for the cloudy coastal conditions and long polar nights common to polar marine environments. For dry-snow conditions, typical of polar glaciers, however, the SAR beam penetrates snow (Reference Ulaby, Moore and FungUlaby and others, 1981, Reference Ulaby, Moore and Fung1982, Reference Ulaby, Moore and Fung1986; Reference Jezek, Drinkwater, Crawford, Bindschadler and KwokJezek and others, 1993; Reference Lucchitta, Rosanova and MullinsLucchitta and others, 1995) and would displace the location of the ELA up-glacier. Maximum penetration in homogeneous snow is estimated to be about 20m (Reference Ulaby, Moore and FungUlaby and others, 1981, Reference Ulaby, Moore and Fung1982, Reference Ulaby, Moore and Fung1986; Reference Rott and MätzlerRott and Mätzler, 1987). This effect should be quite pronounced for thin snow accumulations on low-sloping surfaces, characteristics common to polar glaciers. For example, with a small mass-balance gradientwith altitude, typical of polar glaciers, we would expect roughly a 2 km shift in the apparent snowline for a glacier with a 5˚ slope. The purpose of our study was to examine the extent of ELA displacement on a polar glacier and determine a correction for the SAR-estimated ELA.
Study Site
We examined two glaciers in Taylor Valley, one of the McMurdo Dry Valleys in Antarctica (Fig. 1). This area was chosen because of ongoing glaciological investigations in the valleys on four glaciers that include measurements of mass balance, energy balances, ice velocity and ice depth. Mean annual temperature in Taylor Valley is –17°C (Reference Clow, McKay, Simmons and WhartonClow and others, 1988), and summer temperatures have not often exceeded freezing since 1993 (unpublished information from P. T. Doran). The glaciers show little or no evidence of melt except in the lowermost fringe near the glacier terminus and along the cliff face, which forms the terminus (Reference Lewis, Dana, Tyler and FountainLewis and others, 1995; Reference Fountain, Dana, Lewis, Vaughn, McKnight and PriscuFountain and others, 1998). Most of the mass loss is from sublimation, which during the summer represents 40–90% of the ablation (Reference Lewis, Dana, Tyler and FountainLewis and others, 1995).
The two glaciers we studied were Commonwealth and Howard Glaciers. In this paper we examine Commonwealth Glacier in detail, and briefly mention the results from Howard Glacier in the discussion section. Commonwealth Glacier (Fig. 2) faces south-southeast with a gentle (5°) slope.
Taylor Valley.

Fig 2
The glacier is about 2 km wide across the ELAat 350 m, with a relatively constant slope and even surface. The snow cover in the ablation zone ranges from traces to patchy, dune-like formations 4–35cm high and covering areas of 1–20m2. In the accumulation zone, dry snow exists on the surface, with thin (cm or less) ice layers and hoar crystals at depth.
Methods
Mass-balance measurements are collected over the entire surface with a network of 21 stakes on Commonwealth Glacier as part of the ongoing monitoring. The stakes are typically measured twice annually, once in the spring (October–November) and once in the autumn (mid- to late January). The measurements include surface height, and snow depth if the snow covers the ice of the ablation zone. Whenever snow is present, a snow pit is dug at every stake and the snow stratigraphy is measured, including layer thickness, density and crystal shape. To supplement these measurements with precisely located measurements relative to the SAR image, we set up a transect on Commonwealth Glacier from the ablation zone, across the snowline and into the accumulation zone.
To define the transect on the SAR image precisely, we used two corner reflectors on the glacier to provide bright spots on the SAR image (Reference TrevettTrevett, 1986; Reference Rott and DavisRott and Davis, 1993). The reflectors consisted of three triangular aluminum panels, backed with plywood and bolted to a steel frame. The opening of the reflectors forms an equilateral triangle with 2.44m per side; the depth to the inside corner was 1.22 m. The reflectors were installed on the ice-exposed ablation zone on Commonwealth Glacier because the reflection should be visible against the relatively dark ice surface (Reference Fahnestock, Bindschadler, Kwok and JezekFahnestock and others, 1993; Reference Smith, Forster, Isacks and HallSmith and others, 1997; Reference PartingtonPartington, 1998). The reflectors were placed 2.5 km apart, with the lower reflector positioned roughly in the middle of the ablation zone and the upper reflector near the edge of the snowline. The position of each reflector was determined to the cm level using a precision global positioning system (GPS) unit. The transect is oriented at an angle relative to the center line of the glacier because there was a stretch of snow down the middle of the glacier. Measurements were made along the transect intervals of 250 mand extended beyond the upper reflector by 1km into the accumulation zone. Transect sites are labeledT1–T16.
Transect measurements included surface temperature, surface roughness, local slope and aspect, and snow depth over the ice. In addition, a general description of each site included the fraction of the surface covered by snow relative to ice, and the presence of cryoconite holes and crevasses. Temperature affects liquid-water content, which absorbs the radar beam (Reference MätzlerMätzler, 1987; Reference Jezek, Drinkwater, Crawford, Bindschadler and KwokJezek and others, 1993; Reference Hall, Henderson and LewisHall, 1998). Surface temperatures ranged from –3.7˚ to –0.4°C, and no liquid water was noted during the entire data gathering (except in isolated cryoconite holes).
Surface roughness is important: if surface features are substantially larger than the wavelength of the radar beam, a significant fraction of the incident energy will be reflected back to the sensor. Roughness was estimated by laying a 2 m pole on the surface and measuring the vertical distance from the pole to the ice surface at 5 cm intervals. Two sets of measurements were collected at each site, one with the bar parallel to the SAR beam direction and a second with the bar perpendicular to the beam direction. Surface slope and orientation to an incident radar beam affects how the beam will reflect and the depth to which it will penetrate (Reference Ulaby, Moore and FungUlaby and others, 1981, Reference Ulaby, Moore and Fung1982, Reference Ulaby, Moore and Fung1986; Reference Domik, Leberl and CiminoDomik, 1986). Surface slope and orientation were measured with a Brunton compass. Snow depth was measured using a probe rod with marked intervals. Occasionally, snow pits were dug and the snow stratigraphy was examined, including the density and grain-size of each layer. Snow layers typically exhibit changes in density, which is related to the dielectric constant (Reference Glen and ParenGlen and Paren, 1975) and therefore causes reflections internal to the snow-pack. Differences in the granularity of the snow also cause changes in radar scattering (Reference Rott and MätzlerRott, 1987; Reference Shi and DozierShi, 1993; Reference Hall, Henderson and LewisHall, 1998).
Imagery
Imagery was acquired from two different C-band sensors, European Remote-sensing Satellite-2 (ERS-2) with VV polarization and RADARSAT ScanSAR with HH polarization. The images were taken on 15 and 19 January 1999, respectively, with only a small difference in azimuth (9°) to the SAR platforms. The reflectors were installed on 11January and the field measurements were taken on 19 and 26 January 1999. The weather and surface conditions of the glacier did not change between the installation of the reflectors and the last imagery acquisition.
The two SAR images were provided by the Alaska SAR Facility (ASF) in the slant range projection with the signal strength as a digital-number (DN) scale 0–255 (8-bit). We were concerned that significant changes in glacier slope and aspect, typical of alpine glaciers (in contrast to ice sheets), would affect the brightness variation of the SAR image and potentially mask the variations caused by changes in surface character. Terrain correction also has the advantage of geocoding the image to facilitate comparison with ground-based data. We corrected the image for terrain variations in the ERS-2 image using ASF’s Terrcorr program. The RADARSAT image required a different approach to correction because it was in scan mode. One of the authors (Kwok) applied his software to correct the image. Terrain correction requires a digital elevation model (DEM), and we used one produced by the U.S. Geological Survey (USGS) from 1:50 000 scale maps based on 1970 aerial photography (personal communication from C. Hallam, 1998).
Results
The terrain-corrected SAR imagery for Commonwealth Glacier is shown in Figure 2c. Because the pixel size of the ERS-2 is smaller (30 m) than that of RADARSAT (50 m), we examine the ERS-2 results in detail. Variations in surface brightness along the transect shown in Figure 2c are displayed in Figure 3. Clearly, the ERS-2 and RADARSAT brightnesses are similar (r2 = 0.84). In the ablation zone, the brightness (except for the reflectors) is rather flat. The range of brightness is 65 and 73 for ERS-2 and RADARSAT, respectively. The difference between the two sensors is largest in the ablation zone and smallest in the accumulation zone of the glacier. This variation in difference is likely due to the difference in polarization: RADARSAT has an HH polarization, and ERS-2 has a VV polarization. Laboratory measurements of radar backscatter from sea ice, the difference in HH and VV polarization, were greatest for bare ice and less for ice covered with frost (Reference KwokKwok and others, 1998).
Corrected brightness comparison (along the transect) between RADARSAT (HH) and ERS-2 (VV). The black line is RADARSAT, and the gray line is ERS-2; the correlation coefficient is 0.84. The black triangles are percentage of snow cover. The vertical dashed line is the location of the snowline, the ablation area is to the left, and the accumulation zone is to the right.

The standard deviation of ice roughness measured in the field was 0.7–3 cm, well below the wavelength of 5.6 cm (C-band) of the SARs, and imaged mostly smooth. Patches of snow cover the surface ice in the ablation zone and provide some roughness, 15 cm or so. There is no relationship between SAR brightness and the observed percentages of snow cover: all are 550% (Fig. 3). SAR brightness compared to snow depth over ice, however, exhibited a good (r2 =0.77) correlation (Fig. 4). The snow pits dug on Commonwealth Glacier display multiple snow layers (Fig. 5). The grain-sizes were typically 1–2mm, with rare occurrences of 6–10mm. At the measured snowline, the brightness dramatically increases for both sensors (Fig.3). The increase of RADARSAT brightness is steeper because it was originally darker than ERS-2 and brightens to values closer to those of ERS-2. The two brightness spikes observed in the RADARSAT curve in the brightest part of the snow zone are absent in the ERS-2 data. The cause of this difference is presumed to be polarization, although the scattering features are unknown.
ERS-2 SAR brightness to snow depth over ice.

Commonwealth Glacier snow stratigraphy, measured 19–20 January 1999. Scale to the far left indicates depth of layers. Grain-size (mm) to the immediate left of layer. SAR brightness on top of each layer: first number is the exact location; second number is a four-pixel average. T12–T16, stake 12 and stake 14 show layers to glacier ice; all other locations to previous year’s snow surface. Mechanical structure to the right of layer: f, facets; ∘, rounds; w, wind crust; h, honeycomb; bs, broken stella; H, hoar; i, ice.

In this paper, we refer to the snowline inferred from the SAR images as the SAR snowline, and the actual snowline onthe glacier as the actual snowline. The actual snowline on Commonwealth Glacier, as on most glaciers, is ambiguous. Ascending the glacier, snowpatches on the ice become more frequent, merging until snow isolates patches of ice, eventually covering the surface completely in snow. Thus, the snow line is more a transition zone. Above the upper reflector, the transition from ice- to snow-covered surface is <100m, but to the northeast of the upper reflector the transition enlarges to 100–250m. We defined the snowline positionwhere the snow covers>90% of the glacier surface. Based on this definition, the snowline was located 5 mbelow T13. The snowline transition is gradual along the stakes, and we interpolate from the stake measurements a location of 485 mbelow stake 12, giving the snowline a maximum range of 235–735mbelow stake 12.
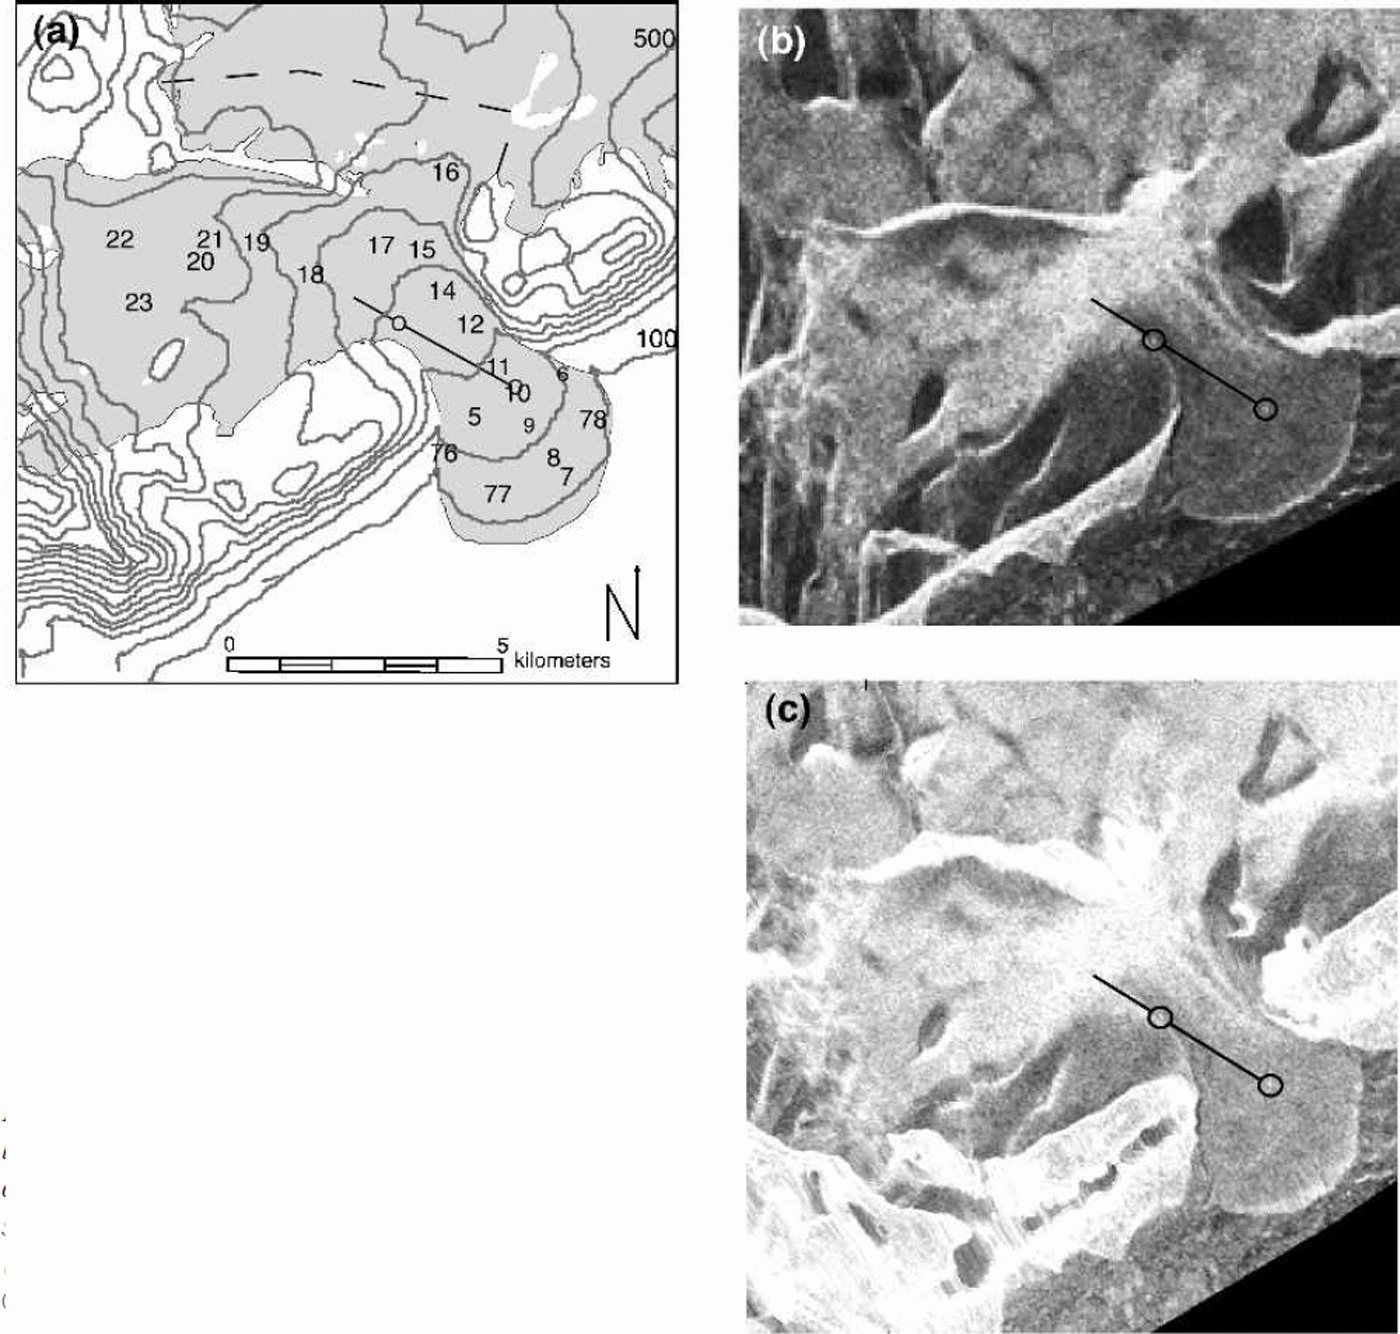
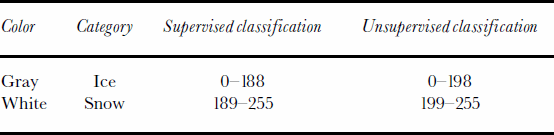
On the SAR images, the glacier is composed of two areas of very different backscattering properties: the ice-exposed ablation zone appears dark and the snow-covered accumulation zone appears bright. The transition between these two brightness regions is the SAR snowline. To aid in the determination of the snowline on the ERS-2 image, a supervised classification was used. The training areas were located on the dark ice and bright snow. We used one training area, consisting of 25–30 pixels in each zone. The snow training area included a four-pixel average of the SAR brightness at T13 (189) to make sure this location was included in the snow class. The snow pixels were assigned the color white, and the dark ice pixels were assigned gray (Fig. 6). In addition, an unsupervised isodata classification with two classes was run (Reference Duda and HartDuda and Hart, 1973). Results of the two classification schemes are very similar (Table 1). The supervised classification accurately crossed just below T13, where the snow cover was 100% and the depth was 15.3 cm, andjust above stake 12, where the snowline was patchier and measured 27 cm deep. T13 maps just above the snowline in the supervised classification, since it was used as the lowest brightness for the snow class. The SAR snowline surrounds stake 12 on three sides, forming a cul-de-sac of ice. Using the range of the actual snowline estimated for this region (235–735m below stake 12), the SAR snowline is located correctly. The unsupervised-classification snowline crossesT13, 60 m too high, and stake 12, 335–585m too high. The snowline for T13 is within the 100 m transition zone for this area, and stake 12 has an arm of the snowline below it that falls within the range of the snowline estimate for the area. Although both classification schemes identify similar SAR snowlines, the supervised classification appears to be more accurate. To correct anomalies in classification, such as classifying as ice a dark region near the upper accumulation zone where no exposed or near-surface ice exists, and to exclude areas outside the glacier require an operator to supervise the classification.
Commonwealth Glacier ERS-2 SAR snowline. Transect location is straight line, and numbers indicate snow-measurement locations. Both images © 1999 European Space Agency. (a) Supervised classification: approximate outline of glacier shown with dashed line, with the glacier area; gray pixels are classified as ice and white pixels as snow. (b) Terrain-corrected SAR: circles indicate reflector locations, and sinuous line is SAR snowline.

Supervised and unsupervised SAR classification categories (expressed in digital numbers)
To compare the position of the SAR snowline and the actual snowline we took hand-held photographs of the glacier from a helicopter. Results showed that where we could determine the snowline from the photographs, the SAR snowline was consistent with the actual snowline. However, the viewing angle and reflection off the glacier surface made snowline determination difficult.
Discussion
We were surprised to find a good match between the SAR snowline and the actual snowline. We expected that the snow would be transparent to the SAR beam and that the SAR snowline would be displaced a significant distance up-glacier. For example, Reference Rott and MätzlerRott and Mätzler (1987) calculated a penetration depth of 21.7 m for C-band radar in dry snow. We consider three factors that might explain this: temperature, subsurface roughness and enhanced volume backscattering.
Temperature
Reference Ulaby, Moore and FungUlaby and others (1981, Reference Ulaby, Moore and Fung1982, Reference Ulaby, Moore and Fung1986), pointed out the moisture content of snow greatly affects its reflectivity, and small changes in temperature near 0°C have the greatest effect on how the snow scatters. We considered the possibility that the ice surface has slightly greater moisture content than the snow because of the albedo differences between the two. Air temperatures during the fieldwork and image acquisition averaged –3˚ to –4°C with a good wind. High sublimation rates are common in the valley, cooling and drying the surface significantly (Reference KwokLewis and others, 1995). If the ice surface was wetter than the snow, the image should exhibit a broad transition zone between the ice and snow because the patchy snow and ice would present a mixture for the SAR pixels, changing in tone with the changing snow cover. This was not apparent in the image.
Subsurface roughness
The standard deviation of the subsurface roughness along the transect never exceeded 3.1 cm. The only ablation region that imaged bright due to roughness is near the terminus, where large melt channels (1–5m deep) exist. It was not noted in any snow pits, nor is it likely that processes are operating on the smooth snow surface that would cause differential melting and refreezing of layers that would surpass the wavelength of the SAR (5.66 cm), which is the minimum radiometric roughness.
Enhanced volume scattering
Backscatter can be caused by volume scattering when the individual grains and inhomogeneities in the snow scatter some of the incoming energy. This is a similar process to light scattering in snow or water. Volume scattering is the reason that deep dry snowpacks are bright compared to the dark ice surface, which partially specularly reflects and absorbs the radar energy (Reference Hall, Henderson and LewisHall, 1998). In addition, layers of different density act as a partially reflective surface (Reference Ulaby, Moore and FungUlaby and others, 1981, Reference Ulaby, Moore and Fung1982, Reference Ulaby, Moore and Fung1986; Reference MätzlerMätzler and Schanda, 1984; Reference Tsang, Kong and ShinTsang and others, 1986) in which part of the beam is reflected and part transmitted (Fig. 7). We hypothesize that in thin, dry snowpacks, reflection offmultiple internal layers increases the total path length of the beam and enhances the opportunity for volume scattering. Most of the energy would be scattered by the near-surface layers because the deeper layers receive less energy and contribute a diminishing portion to volume scattering (Reference Ulaby, Moore and FungUlaby and others, 1981, Reference Ulaby, Moore and Fung1982, Reference Ulaby, Moore and Fung1986; Reference Forster, Davis, Rand and MooreForster and others, 1991).
Enhanced volume backscatter.

Our observations of the snow stratigraphy along the transect and at the mass-balance stakes indicate multiple layers exist (Fig. 5). As mentioned previously, the snowline was located only 5 m down-glacier from site T13, and 235–745m below stake 12. The depth of snow atT13 was 15.3 cm, with a brightness of DN191, and the depth at stake 12 was 27 cm with a brightness of 192. One snow layer was identified at T13, and five layers were identified at stake 12. Our probing of the snow at T13 revealed at least one layer, and perhaps a snow pit would have revealed more.
Down-glacier from the actual snowline, the snowpatches seem to be transparent to the SAR beam, yet their depth, roughly 12 cm, is close to the 15 cm depth of the SAR snow-line. Our stratigraphic observations indicate that these patches did not contain layers, so enhanced volume reflection is minimal. In addition, the patchiness itself reduces the backscatter because of the intervening areas of clear ice. The speckle observed in the ablation zone may be due to large but infrequent patches of snow, although other explanations (e.g. roughness) exist. Resolution of this question requires more field data.
Results from Howard Glacier are broadly consistent with the results from Commonwealth Glacier. The glacier only appeared on the RADARSAT image because the ERS-2 scene did not cover that part of the valley. The aspect and slope of Howard Glacier faced away from the SAR beam at a sharp incident angle of about 10–23°. The entire glacier imaged dark, with some tonal variation to indicate the transition from the snow to ice surfaces. However, the terrain correction degraded the resolution of the image sufficiently that it was nearly impossible to use. We relied instead on the unprocessed image. These poor characteristics are probably due to the high incidence angle of the beam.
Conclusions
Glacier surfaces in Taylor Valley are generally radiometrically smooth and appear dark in the SAR image over most of the ablation zone. The snow zone images brighter because of the volume reflection from the entire depth of snow penetrated by the SAR beam. Because of the known penetration characteristics of SAR in dry snow, we expected a displacement of the SAR-inferred snowline. In contrast, the SAR-inferred and actual snowlines were very close to each other. We believe that this correspondence is due to enhanced volume reflection and can reveal the presence of snow depths of only 15 cm. Enhanced volume reflection results from layers of different densities acting as specular reflective surfaces (Reference Ulaby, Moore and FungUlaby and others, 1981, Reference Ulaby, Moore and Fung1982, Reference Ulaby, Moore and Fung1986; Reference MätzlerMätzler and Schanda, 1984; Reference Tsang, Kong and ShinTsang and others, 1986). Reflection off internal layers increases the path length the beam travels (Reference Ulaby, Moore and FungUlaby and others, 1981, Reference Ulaby, Moore and Fung1982, Reference Ulaby, Moore and Fung1986), creates more opportunity to scatter in the snow and increases total reflection. Therefore thin, dry snowpacks with no internal layers will not be visible in SAR imagery.
The largest difference of backscatter between polarizations occurred in the ablationzone and reduced in the accumulation zone. On the ice surface of the ablation zone, VV polarization backscatters more than the HH polarization. In deep snow, HH backscatter increases relative to VV, and the difference in backscatter is reduced.
The corner reflectors worked very well, precisely locating the transect, adding scale and two known points to the SAR image. The reflectors were placed on smooth glacial ice, and the contrast between the dark backscatter of the ice and the brilliant reflection of the reflectors left no doubt of their locations on the image.
We believe that SAR can map snowlines in dry snow and be a useful instrument for tracking snowline changes over broad regions. Problems were encountered with a glacier sloping steeply away from the SAR platform, but that condition is readily visible on the image.
Acknowledgements
This work was funded by U.S. National Science Foundation grant OPP-9211773. We appreciate the support of Antarctic Support Associates who constructed the reflectors and helped with the field survey. The University Navstar Consortium (UNAVCO) kindly helped with the GPS locations. C. Hallam of the USGS provided us with the DEM for the dry valleys. We thank J. Stapleton at Portland State University for his inestimable programming, aiding us with the compiling and running of Terrcorr. Thanks to D. Corbett, T. Logan and C.Wyatt from ASF for technical assistance with the Terrcorr terrain correction program. J. Barton of The Pennsylvania State University was very helpful with discussions about the SAR data. K. Jezek and Hongxing Liu from Ohio State University helped us with the DEM.



