I. INTRODUCTION
Copper nanowires (CuNWs) with one-dimensional nanostructure have potential applications in many fields such as electronics, optoelectronics, and photonicsReference Mohl, Pusztai, Kukovecz, Konya, Kukkola, Kordas, Vajtai and Ajayan1–Reference Shi, Li, Chen and Huang3 due to their high electrical and thermal conductivity. The specific properties of CuNWs make them excellent candidates for nanofillers in multifunctional polymer composites. AC electrodeposition of copper into anodized porous aluminum oxide (PAO) templates is one of the most efficient methods to produce CuNWs.Reference Zhou, Zhou, Pan and Wang4
CuNWs with diameters less than 100 nm have much higher surface area and thus are subject to much higher oxidation rate than bulk copper due to crystallite strain and more surface area. It is very important to study the oxidation kinetics of CuNWs to know their corrosion and activity loss so as to understand their long-term performance and durability.
Oxidation kinetics of bulk copper have been extensively studied. The conclusion has been reached that the oxidation rate increases with temperature, while O2 partial pressure makes no difference on the rate when it is above the equilibrium potential for Cu/CuO.Reference Bridges, Baur, Baur and Fassell5 Regarding oxidation kinetics, parabolic law has been reported most frequently, while logarithmic and inverse logarithmic laws were also observed at low temperatures as well as cubic law at moderate temperatures 600–850 °C.Reference Gao, Gong, He, Thomas, Chan and Li6 The reported activation energies of bulk copper oxidation in air/O2 between 300 and 1050 °C vary from 39 to 223 kJ/mol.Reference Zhu, Mimura, Lim, Isshiki and Jiang7
Although the kinetics and mechanism of bulk copper oxidation are widely studied and well understood, very little is known about nanoscale copper particles like CuNWs. In this study, oxidation kinetics of CuNWs synthesized by AC electrodeposition of Cu into PAO templates was studied. The activation energies were determined by different model-free methods, and the oxidation mechanism was determined by fitting the results with different models.
II. EXPERIMENTAL
A. Preparation of CuNWs dry powder
CuNWs were synthesized by AC electrodeposition of copper into the hard templates of anodized PAO. Details of the synthesis and liberation were described elsewhere.Reference Gelves, Murakami, Krantz and Haber8 CuNWs prepared by this method after 1 h ultrasonication in methanol have diameter 25 ± 4 nm and average length approximately 2 μm.Reference Gelves, Murakami, Krantz and Haber8 The CuNWs dispersion in methanol was then filtered with a nylon membrane (Osmonics Inc., Minnetonka, MN) with pore size 0.45 μm. The sludge after filtration was dried in a vacuum oven at room temperature and −25 inHg vacuum for 3 h. The vacuum oven was flushed with N2 three times at the beginning of the drying process. After drying, the cake was grounded slightly in a mortar to make a uniform fine powder. The fine powder of CuNWs was then immediately stored in liquid nitrogen.
B. Morphology characterization
Scanning electron microscopy (SEM) images of CuNWs dry powder before and after oxidation were collected using a Philips XL30 scanning electron microscope (Hillsboro, OR). The dry powder before and after oxidation was stuck onto carbon tape stuck on an aluminum stub. All these samples were coated with gold before imaging.
Transmission electron microscopy (TEM) images were collected with a Tecnai F20 field emission gun transmission electron microscope at 200 kV accelerating voltage. A very dilute CuNWs dispersion in methanol (before oxidation) was dropped onto a holey carbon-coated nickel TEM grid. The CuNWs powder after oxidation was dispersed into methanol by 30 min ultrasonication and then dropped onto a holey carbon-coated nickel TEM grid for TEM observation.
C. Thermogravimetric analysis
All thermogravimetric analysis (TGA) data and plots were collected with a TA Q500 TGA instrument, and all TGA tests were carried out within 10 min after the CuNWs powder was taken out of liquid nitrogen. Oxygen content in CuNWs before oxidation was determined from the TGA curve acquired with 60 mL/min 4% H2 balance N2 (Praxair, Calgary, Canada) as purge gas and 40 mL/min N2 (Praxair) as balance gas at heating rate 20 °C/min from room temperature to 800 °C.
TGA oxidation curves were obtained with 60 mL/min air (Praxair) as purge gas and 40 mL/min N2 (Praxair) as balance gas at different heating rates from room temperature to 500 °C. The sample of CuNWs powder in each oxidation experiment was controlled between 3–5 mg and distributed evenly in the platinum pan to minimize temperature gradient inside the sample and facilitate release of oxidation heat quickly.
D. X-ray diffraction characterization
X-ray diffraction (XRD) patterns were obtained with an Ultima III Multi Purpose Diffraction System (Rigaku Americas, Laredo, TX) with CuKα radiation operating at 40 kV and 44 mA.
CuNWs powder taken out of liquid nitrogen was immediately used to collect the XRD pattern before oxidation. CuNWs powder heated to 175 °C at 9 °C/min rate with 60 mL/min air as purge gas and 40 mL/min N2 as balance gas in TGA instrument was used to collect the XRD pattern of CuNWs after Stage 1. CuNWs powder heated to 350 °C at 10 °C/min rate with 60 mL/min air as purge gas and 40 mL/min N2 as balance gas in the TGA was used to collect the XRD pattern of CuNWs after Stage 2.
III. RESULTS AND DISCUSSION
A. CuNWs before oxidation
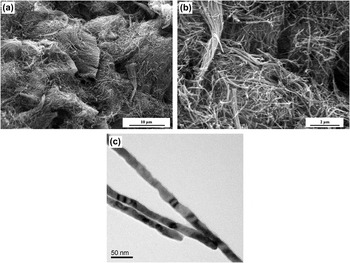
SEM and TEM images of the CuNWs powder before oxidation are shown in Fig. 1. Figure 1(a) shows the low magnification SEM image, Fig. 1(b) shows the high magnification image, and Fig. 1(c) shows the TEM image of the CuNWs. In SEM images, most of CuNWs in the dry powder are seen to exist as single wires; however, some CuNWs in bundles merge into wires with larger diameter. Diameter of individual CuNWs in TEM image is 25 ± 4 nm, which is consistent with the value reported by Gelves et al.Reference Gelves, Murakami, Krantz and Haber8
(a, b) SEM and (c) TEM images of CuNWs before oxidation.

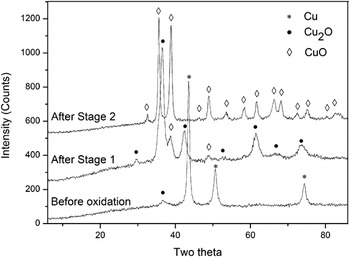
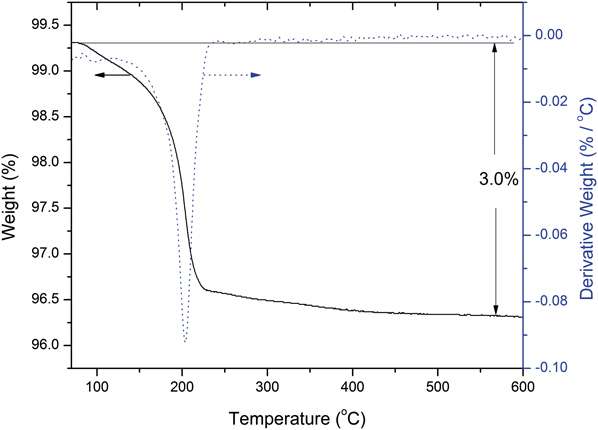
All XRD patterns of CuNWs before and after oxidation are shown in Fig. 2. Composition of the CuNWs before oxidation includes metallic Cu and Cu2O. After oxidation, only Cu2O and CuO are detected by XRD. In the TGA plot shown in Fig. 3, CuNWs dry powder before oxidation reduced in H2 at 600 °C has weight loss of 3.0%, which can be attributed to the O content in the sample. Combining the XRD pattern of CuNWs before oxidation with the TGA plot collected during reduction in H2, it can be calculated that CuNWs dry powder before oxidation comprises 26.8 wt% Cu2O and 73.2 wt% Cu.
XRD patterns of CuNWs before oxidation, after Stage 1, and after Stage 2.

TGA plot of CuNWs before oxidation reduced in H2.

B. Two stages oxidation of CuNWs
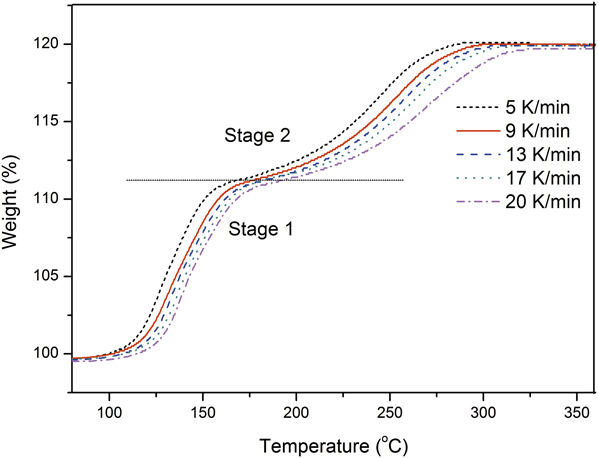
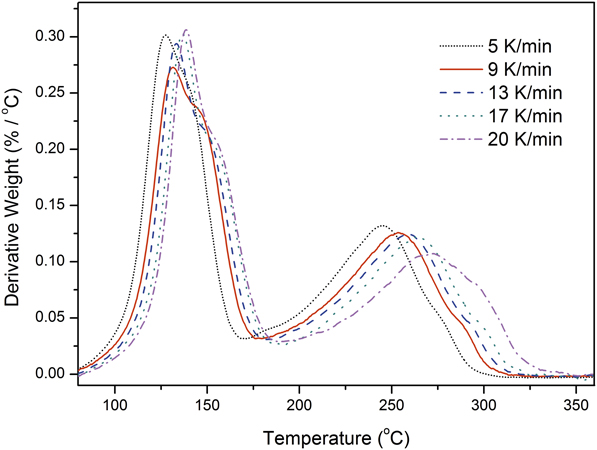
Figures 4 and 5 illustrate the TGA and DTG curves at different heating rates during oxidation, respectively. Both the TGA and the differential thermogravimetric (DTG)curves in similar patterns shift to higher temperature at higher heating rate. And the peak maximums on the DTG curves also shift to higher temperature at higher heating rate.
TGA curves of CuNWs oxidized at different heating rates.

DTG curves of CuNWs oxidized at different heating rates.

By observing the TGA and the DTG curves, the oxidation reaction of CuNWs can be divided into two different stages. On the TGA curves, there is a plateau at around 175 °C connecting the two different stages: Stage 1 with higher weight gain rate takes place at temperature lower than 175 °C and Stage 2 with lower weight gain rate takes place at temperature higher than 175 °C. In addition, there are two peaks on each DTG curve, which also indicates two-stage oxidation of CuNWs. Based on the DTG curves, the oxidation reaction of CuNWs is divided into two stages at 172 °C on the TGA curve of 9 K/min heating rate, which corresponds to weight of 111.2% as indicated by the horizontal dash line on the TGA plots in Fig. 4.
Composition of the oxidized CuNWs after Stage 1 and Stage 2 was identified by XRD as shown in Fig. 2. The oxidized CuNWs after Stage 1 comprise Cu2O and CuO, and the oxidized CuNWs after Stage 2 consist of CuO only.
Based on the composition of CuNWs before oxidation, final weight gain of the CuNWs after Stage 2 should be 19.9% if both the Cu and Cu2O in the initial CuNWs are converted to CuO stoichiometrically. On the TGA plot, final weight gain of the CuNWs after Stage 2 is around 20.0% based on the lowest weight point on the plot, which is slightly higher than the theoretical value of 19.9%. Conversion ratio α at given temperature is determined from TGA data by assumption of stoichiometric reaction with 19.9% final weight gain:
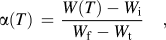
where W i is the initial weight percentage of the sample, W f is the final weight percentage of the sample. W(T) is the weight percentage of the sample at temperature T. For Stage 1, W i is 99.7%, the lowest weight percentage point on the TGA plot, and W f is 111.2%. For Stage 2, W i is 111.2% and W f is 119.9%.
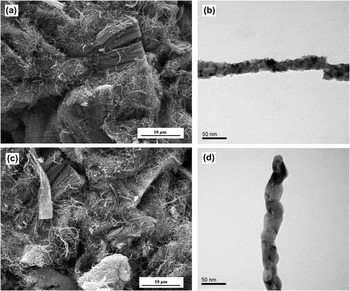
SEM and TEM images of the CuNWs after oxidation are shown in Figs. 6(a) and 6(c) and Figs. 6(c) and 6(d), respectively. Figs. 6(a) and 6(b) are the images after Stage 1 oxidation and Figs. 6(c) and 6(d) are the images after Stage 2 oxidation. Oxidation process makes no difference on SEM images. However, CuNWs after Stage 1 become loose and rough with diameter 25 ± 6 nm in TEM image. CuNWs after Stage 2 look dense and smooth with larger diameter 32 ± 6 nm, which could result from the merge of two or more individual CuNWs into one during oxidation.
(a, c) SEM and (b, d) TEM images of the CuNWs oxidized (a, b) after Stage 1 and (c, d) after Stage 2.

C. Determination of activation energy by Kissinger method and isoconversional methods
Unlike the well-known bulk copper oxidation, little is known about the mechanism of CuNWs oxidation. It is necessary to use model-free methods to determine the activation energy.
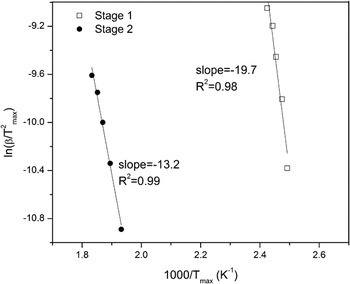
Kissinger methodReference Kissinger9 involving no assumption of reaction mechanism can be used to determine the activation energy with a single value. Kissinger equation is:

where A is Arrhenius frequency factor, T max is the temperature of peak maximum on DTG plot. Activation energy E a can be determined from the slope of the plot of  against 1/T max. Arrhenius plots based on Kissinger equation for Stage 1 and Stage 2 are shown in Fig. 7. Activation energies determined by Kissinger method are 163.5 kJ/mol (1.69 eV) for Stage 1 and 109.6 kJ/mol (1.14 eV) for Stage 2.
Arrhenius plots based on Kissinger equation for Stage 1 and Stage 2.

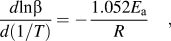
Model-free isoconversional methods are based on the assumption that reaction rate at a certain conversion is only a function of temperature and the reaction model is independent of temperature and heating rate. These models make it possible to determine activation energy without determination of reaction mechanism and reaction order. The common isoconversional methods to study solid-state reactions are listed as below:
(i) Flynn–Wall–Osawa equation in differential formReference Flynn and Wall10
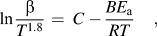
(ii) Starink equationReference Starink11
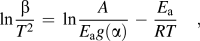
(iii) Kissinger–Akahira–Sunose (KAS) equationReference Robinson, Arun, Manju, Aniz and Yusuff12
(iv) Friedman differential equationReference Friedman13

(v) Boswell equationReference Boswell14
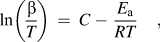
where C is a constant, B = 1.0070 − 1.2 × 10⁻⁵ × E a (when E a in kJ/mol), β is heating rate, A is Arrhenius frequency factor, g(α) is mechanism function, f(α) is differential mechanism function, E a is activation energy, R is gas constant, and T is absolute temperature.
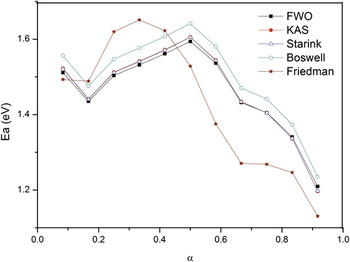
The activation energies determined with above five methods are plotted against each conversion ratio α for both stages in Figs. 8 and 9, respectively. The activation energies are between 1.0 and 1.7 eV for Stage 1 and between 0.87 and 1.15 eV for Stage 2. Activation energies of Stage 1 drop at the beginning of the oxidation reaction and then increase to their maximum at around 50% conversion. The higher activation energy at the beginning of Stage 1 oxidation could result from the influence of Cu2O in the CuNWs before oxidation, which covers the surface of CuNWs leading to enhanced stability. Activation energies of Stage 2 are much lower than those of Stage 1. Activation energies of Stage 2 increase slightly at the beginning and then drop to the minimum at the end of oxidation reaction.
Activation energies for Stage 1 determined by different model-free isoconversional equations.

Activation energies for Stage 2 determined by different model-free isoconversional equations.

Theoretically, activation energy with fixed value should be held for homogeneous reaction in which all the reactant molecules are identical and unaffected by the formation of product as the reaction proceeds. However, the activation energies of CuNWs oxidation in this study fluctuate as the oxidation reaction proceeds indicating that the reactant CuNWs are undergoing reactivity change because of the formation of crystal defect, i.e., the change of intracrystalline strain and the process of particle disintegration.Reference Song, Wen, Guo and Korakianitis15 Moreover, reactivity of individual nanowires in the original CuNWs also changes significantly during oxidation reaction—this may result from the particle size evolvement, change in the boundary faces of different indices exposed, and crystal imperfections and damagesReference Song, Wen, Guo and Korakianitis15 as indicated in the TEM images in Figs. 1 and 6. Therefore, it is reasonable that the activation energy of CuNWs oxidation may not be constant, as oxidation reaction proceeds, and variable activation energies should be used to determine oxidation kinetics. Among the activation energies determined by different methods, Kissinger and Boswell methods obtain higher values, the values by Friedman method exhibit maximum fluctuation, and Starink and KAS methods obtain very similar values that fall among the values determined by other methods.
D. Determination of reaction kinetics
To study the oxidation kinetics of CuNWs, conventional master plot methodReference Gotor, Criado, Malek and Koga16 was used according to Eq. (8):

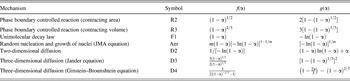
The left side of Eq. (8) can be plotted with individual differential mechanism function f(α) (listed in Table I) against conversion ratio α. The right side of Eq. (8) is plotted using the variable activation energies determined by Starink method.
Algebraic expressions for the f(α) and g(α) functions for the most common mechanisms in solid reactions.Reference Gotor, Criado, Malek and Koga16

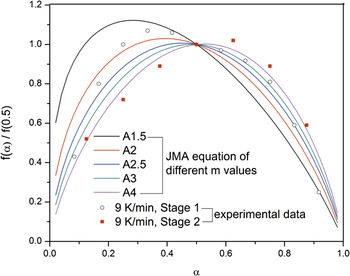
The master plots of Johnson–Mehl–Avrami (JMA) equation in Table I with different m values and the experiment points are shown in Fig. 10. JMA equation gives the best fit among all equations in Table I. JMA equation with m = 2 presents the best fit for α < 0.5 at Stage 1, while m = 3 has the best fit for α > 0.5 at Stage 1 and m = 4 exhibits the best fit for Stage 2. Based on the fitting results, it can be concluded that random nucleation and growth of nuclei are the mechanisms for CuNWs oxidation in both stages. Deviation of the experimental data from the theoretical function may result from two reasons. One the one hand, it is not easy to determine the value of dα/dT accurately due to its high sensitivity to baseline stabilityReference Starink11; on the other hand, the preexisting oxide Cu2O in CuNWs before oxidation interferes with ideal random nucleation and growth of nuclei mechanism. Yang et al.Reference Yang, Bharadwaj, Zhou and Tropia17, Reference Yang, Yeadon, Kolasa and Gibson18 reported the dominant process was oxygen surface diffusion for transport and nucleationReference Yang, Yeadon, Kolasa and Gibson18 as well as oxygen surface diffusion plus direct impingement mechanismReference Yang, Yeadon, Kolasa and Gibson19 for the initial growth of Cu2O on single crystal Cu(001) thin films. In addition, Johnson–Mehl–Avrami–Kolmogorov surface theory, which suggests that nucleation and coalescence of thin films result from surface processes, is applied to describe the nucleation and coalescence growth of Cu2O.Reference Yang, Bharadwaj, Zhou and Tropia17 In this study, diameter of CuNWs is only 25 ± 4 nm, which results in a large number of atoms distributed on the surface of CuNWs and high crystallite strain caused by the high gradient of surface curvature. The surface atoms and crystallite strain in CuNWs should account for the random nucleation and growth of nuclei mechanism in oxidation.
Kinetic model fitting for CuNWs oxidation using JMA equation in Table I with different m values.

The oxidation TGA curves in Fig. 4 exhibit typical sigmoidal shapes for both stages, which indicate random nucleation and growth of nuclei mechanism for the oxidation of CuNWs. Moreover, the morphological evolution of CuNWs during oxidation is shown in Figs. 1 and 6, which is consistent with the mechanism of random nucleation and growth of nuclei. The CuNWs have smooth surface before oxidation. Due to the random nucleation of CuO over the parent phase of Cu2O, the oxidized CuNWs after Stage 1 become loose and rough [see Figs. 1(c) and 6(b)]. Near the end of Stage 2, the oxidation rate decreases as the untransformed Cu2O phase becomes less and less so that new CuO nuclei cannot form, and the CuO nuclei already existing continue to grow and begin to touch each other to form larger grains and boundaries that terminate the growth of CuO nuclei. This results in the dense smooth surface of the oxidized CuNWs after Stage 2 [see Figs. 6(b) and 6(d)] and the merging of two or more individual CuNWs into one.
Regarding the oxidation of bulk copper under ambient oxygen pressures, the parabolic rate law was the one most frequently observed at intermediate temperature between 300 and 1050 °C.Reference Zhu, Mimura, Lim, Isshiki and Jiang7, Reference Zhu, Mimura and Isshiki20 The cubic law was reported at moderate temperatures 600–850 °C.Reference Gao, Gong, He, Thomas, Chan and Li6, Reference Yabuki and Tanaka21 At temperature below 300 °C, logarithmic and inverse logarithmic laws were observed.Reference Gao, Gong, He, Thomas, Chan and Li6, Reference Yabuki and Tanaka21 Two major mechanisms for the Cu2O and/or CuO scale growth during the oxidation of bulk copper were proposed: the diffusion of copper ions from the metal to the oxide–oxygen interface driven by concentration gradient, and tunneling electrons coming up against the surface electric field.Reference Gao, Gong, He, Thomas, Chan and Li6 However, the oxidation of CuNWs in this study does not obey any law reported for the oxidation of bulk copper. Instead, the oxidation of CuNWs follows the JMA equation, which means oxidation occurs by random nucleation and growth of nuclei driven by surface processes.
IV. CONCLUSIONS
CuNWs synthesized for oxidation kinetics study have diameter 25 ± 4 nm with smooth surface. Composition of CuNWs dry powder before oxidation comprises Cu and Cu2O as identified by XRD with 3.0% oxygen content, which is equivalent to 73.2 wt% Cu and 26.8 wt% Cu2O.
Based on the TGA and DTG plots at different heating rates, oxidation reaction of CuNWs should be divided into two stages at weight of 111.2%. The oxidized CuNWs after Stage 1 become loose and rough with diameter 25 ± 6 nm, and the composition identified by XRD consists of Cu2O and CuO. The oxidized CuNWs after Stage 2 look dense and smooth with larger diameter 32 ± 6 nm, which could result from the merging of two or more individual CuNWs into one during oxidation, and the composition identified by XRD comprises CuO only.
Activation energies of both stages are determined by Kissinger method and other five isoconversional methods. Activation energies of Stage 2 are much lower than those of Stage 1. Among the activation energies determined by different methods, Kissinger and Boswell methods obtain higher values, the values by Friedman method exhibit maximum fluctuation, and Starink and KAS methods obtain very similar values that fall among the values determined by other methods.
The activation energies determined by Starink method are used to fit different master plots. JMA equation gives the best fit among all equations. JMA equation with m = 2 presents the best fit for α < 0.5 at Stage 1, while m = 3 gives the best fit for α > 0.5 at Stage 1 and m = 4 exhibits the best fit for Stage 2. Surface atoms are the sites for the random nucleation, and crystallite strain in CuNWs is the driving force for the growth of nuclei mechanism during the oxidation process.
ACKNOWLEDGMENTS
We would like to thank Natural Science and Engineering Research Council of Canada (NSERC) and the Xerox Foundation for the funding of the research. We thank the Microscopy and Imaging Facility (MIF) in University of Calgary for providing the SEM and TEM instruments. Dr. Tobias Fürstenhaupt’s help to collect the TEM images is also gratefully acknowledged.