Introduction
Uranyl-oxide hydroxy-hydrates (UOHs) are a fascinating group of U(VI) minerals (Table 1) and synthetic compounds that are both chemically and structurally rich. Some of these structures are among the most structurally complex known (see Krivovichev et al., Reference Krivovichev, Krivovichev, Hazen, Aksenov, Avdontceva, Banaru, Gorelova, Ismagilova, Kornyakov and Kuporev2022). They are closely related, in terms of formation, to the hydration–oxidation of uranium dioxide, UO2+x, as nuclear fuel or uraninite (Finch and Ewing, Reference Finch and Ewing1992; Wronkiewicz et al., Reference Wronkiewicz, Bates, Wolf and Bick1996; Janeczek et al., Reference Janeczek, Ewing, Oversby and Werme1996; Plášil, Reference Plášil2014, Reference Plášil2018a). As minerals, they form among the first alteration products during oxidation weathering of uraninite in oxidized zones of U deposits worldwide (Krivovichev and Plášil, Reference Krivovichev, Plášil, Burns and Sigmon2013; Plášil, Reference Plášil2018a). Historically, there were ∼20 minerals known that belong to this mineral group; nevertheless, ∼ten new minerals have been discovered during the past dozen years (Brugger et al., Reference Brugger, Krivovichev, Berlepsh, Meisser, Ansermet and Armbruster2004, Reference Brugger, Meisser, Etschmann, Ansermet and Pring2011; Olds et al., Reference Olds, Plášil, Kampf, Škoda, Burns, Čejka, Bourgoin and Boulliard2017, Reference Olds, Plášil, Kampf, Spano, Haynes, Carlson, Burns, Simonetti and Mills2018, Reference Olds, Plášil, Kampf, Burns, Marty and McCloy2024; Plášil et al., Reference Plášil, Kampf, Škoda and Čejka2018, Reference Plášil, Kampf, Olds, Sejkora, Škoda, Burns and Čejka2020), and a number of new synthetic phases (Ablott et al., Reference Ablott, Lu and Zhang2024, Reference Ablott, Nicholas, Lu and Zhang2026; Kaitschuck et al., Reference Kaitschuck, Barth, Hutter, Landsberger, Felton, Hunt, Miskowiec and Spano2025; Kirkegaard et al., Reference Kirkegaard, Niedziela, Miskowiec, Shields and Anderson2019; Klingensmith et al., Reference Klingensmith, Deely, Kinman, Kelly and Burns2007; Lu et al., Reference Lu, Zhang, Wei, Čejka and Zheng2020a, Reference Lu, Zhang, Aughterson and Zheng2020b, Reference Lu, Zhang, Wei, Wang, Oldfield and Zheng2021; Weng et al., Reference Weng, Wang, Ling, Morrison and Burns2012; Zhang et al., Reference Zhang, Čejka, Lumpkin, Tran, Aharonovich, Karatchevtseva, Price, Scales and Lu2016, Reference Zhang, Aughterson, Karatchevtseva, Kong, Tran, Čejka, Aharonovich and Lumpkin2018, Reference Zhang, Aughterson, Zhang, Wei, Lu, Čejka and Karatchevtseva2019, Reference Zhang, Lu and Zheng2022, Reference Zhang, Ablott, Nicholas, Karatchevtseva and Plášil2024, Reference Zhang, Ablott and Wei2025a, Reference Zhang, Lu, Wei, Ablott, Karatchevtseva and Zheng2025b, Reference Zhang, Ablott, Wei, Fletcher and Rafiuddin2026).
Overview of the natural uranyl-oxide hydroxy-hydrate minerals and their selected properties

Table 1 Long description
Rows list 25 minerals with columns for stacking sequence topology, structural unit, charge deficiency per anion, range in Lewis basicity, uranium to oxygen ratio, average uranium coordination number, water value, molar proportion of metal cation, and reference number. Charge deficiency per anion is lowest for Schoepite and for Metaschoepite bobfinchite at 0.08, and highest at 0.29 for Wolsendorfite and Spriggite. Lewis basicity ranges are provided for most minerals, spanning from 0.11 to 0.24 overall, with Uranosphaerite listed at 0.11 to 0.16 and Wolsendorfite listed at 0.175 to 0.24. Water values range from 0.20 for Uranosphaerite up to 0.69 for Schoepite, with Curite at 0.35 and Spriggite at 0.31. Molar proportion of metal cation runs from 0.00 for several minerals including Schoepite and Ianthinite, up to 0.40 for Uranosphaerite, with Vandenbrandeite at 0.25. Uranium to oxygen ratios vary by mineral, including 3 to 5 for many entries, 14 to 23 for Wolsendorfite, and 1 to 3 for Uranosphaerite. Average uranium coordination number is commonly 7, with several entries showing 6 and 7, and some entries have blank or uncertain coordination values.
Notes: CDA – charge deficiency per anion (in valence units, vu); LB – Lewis basicity (in vu); Me – metal; [n]U – average coordination number of U; MO – molar proportion of metal cation). References: 1) Plášil (Reference Plášil2018a); 2) Weller et al. (Reference Weller, Light and Gelbrich2000); 3) Olds et al. (Reference Olds, Plášil, Kampf, Burns, Marty and McCloy2024); 4) Brugger et al. (Reference Brugger, Meisser, Etschmann, Ansermet and Pring2011); 5) Walenta and Theye (Reference Walenta and Theye2012); 6) Burns (Reference Burns1997); 7) Plášil et al. (Reference Plášil, Kampf, Olds, Sejkora, Škoda, Burns and Čejka2020) 8) Olds et al. (Reference Olds, Plášil, Kampf, Spano, Haynes, Carlson, Burns, Simonetti and Mills2018); 9) Burns and Li (Reference Burns and Li2002); 10) Finch et al. (Reference Finch, Burns, Hawthorne and Ewing2006); 11) Burns (Reference Burns1998); 12) Olds et al. (Reference Olds, Plášil, Kampf, Škoda, Burns, Čejka, Bourgoin and Boulliard2017); 13) Plášil et al. (Reference Plášil, Kampf, Škoda and Čejka2018); 14) Li and Burns (Reference Li and Burns2000); 15) Plášil (Reference Plášil2017); 16) Pagoaga et al. (Reference Pagoaga, Appleman and Stewart1987); 17) Burns and Hanchar (Reference Burns and Hanchar1999); 18) Plášil et al. (Reference Plášil, Petříček, Škoda, Meisser and Kasatkin2021); 19) Plášil et al. (Reference Plášil, Škoda, Čejka, Bourgoin and Boulliard2016); 20) Ghazisaeed et al. (Reference Ghazisaeed, Kiefer and Plášil2019); 21) Plášil (Reference Plášil2019); 22) Plášil (Reference Plášil2020); 23) Brugger et al. (Reference Brugger, Krivovichev, Berlepsh, Meisser, Ansermet and Armbruster2004); 24) Rosenzweig and Ryan (Reference Rosenzweig and Ryan1977); 25) Burns et al. (Reference Burns, Finch, Hawthorne, Miller and Ewing1997); 26) Colmenero et al. (Reference Colmenero, Plášil and Němec2020).
Here we describe the new member of the uranyl-oxide hydroxy-hydrate mineral group, leishmanite (IMA2026-002), orthorhombic Ba(H2O)4[(UO2)3O2(OH)3]2·3H2O, closely related to compreignacite and billietite. The new mineral was discovered in the Grand Alou valley near Nendaz, Valais, Switzerland. The name honours Douglas Alan Leishman (born October 28, 1943, in Glasgow, Scotland, UK), the Swiss-Scottish chemist and avid long-time mineral collector, exploration investor, and former industry executive; a co-founder of AuroVallis Sàrl and Aurania Resources Ltd., dedicated to mining exploration in Switzerland and broader project exposure in Ecuador, France and Italy. Thanks to his involvement and mining expertise, the company undertook an extensive exploration program in Valais/Wallis, focusing on gold (Mont Chemin) and uranium at La Creusaz and Isérables-Grand Alou, where leishmanite was discovered. The mineral symbol of leishmanite, in line with Warr (Reference Warr2021), is Lhm. Holotype material (three fragments) is deposited at the Department of Geology of the State Museum of Natural Sciences (Naturéum), Lausanne, Switzerland, with the collection number MGL101918.
Occurrence
Leishmanite was discovered within a single specimen from surface mining exploration work (46°08′40″N, 7°17′37″E) carried out on the northern slope of the Grand Alou valley, south of the Dent de Nendaz (2463 m), in the municipality of Nendaz, Valais, Switzerland. Conducted from 2008 to 2013 by Canadian mining exploration company Aurania Resources Ltd. (through its subsidiary AuroVallis Sàrl), this work aimed to estimate the uranium (+ Au, Ag, Cu) potential of a series of mineralized outcrops in the Permian metasediments of the Col-de-Chassoure Formation (Siviez-Mischabel Nappe, Pennine Alps). The U-Pb age of uraninite/pitchblende from the uranium mineralization is 257 ±12 Ma (Eikenberg et al., Reference Eikenberg, Koeppel, Labhart and Signer1989). In the original sample, leishmanite crystallized in an irregular cavity measuring 10 × 5 mm, formed within a quartz layer, consistent with the schistosity of a very finely bedded paragneiss, and is intimately associated with quartz, parauranophane, and a few crystals of ‘biotite’. The apparent absence of primary uranium minerals on the fragments studied suggests a late hydrothermal origin for leishmanite rather than a supergene one. In addition, a wide variety of secondary minerals have been identified in the few outcrops of the same Grand Alou area where leishmanite has been detected: liebigite, leesite, cuprosklodowskite, fourmarierite, bayleyite, becquerelite, kasolite, masuyite, compreignacite, zeunerite, metazeunerite, billietite, erythrite, lemanskiite, lavendulan, cyanotrichite, brochantite and malachite along with disseminated ore minerals: uraninite, pyrite, chalcopyrite, tennantite-(Fe), bornite, chalcocite, covellite, enargite, idaite, cobaltite, safflorite, native gold, rutile and hematite (Hügi et al., Reference Hügi, Koeppel, de Quervain and Rickenbach1967; Meisser and Ansermet, Reference Meisser and Ansermet1993).
Morphology, physical and optical properties
Leishmanite occurs as elongated, tabular crystals of yellow to orange colour (Fig. 1). They are up to 0.1 mm across and form multiple intergrowths within gangue cavities (Fig. 2a,b). Crystals are dominated by the {010}, {100}, {001} and {110} (Fig. 2c) faces. The streak is pale yellow. The mineral does not fluoresce under either short- or longwave UV radiation. Crystals are translucent with a strong vitreous lustre. The tenacity is brittle, and the fracture is curved. The Mohs hardness is ∼2½ based on scratch tests. Cleavage is perfect on {010} and imperfect on {100}. The calculated density, using the empirical formula, is 5.229 g·cm–3. Chemical tests (solubility check) were not done due to the scarcity of crystals.
Leishmanite (Lhm) from Nendaz, Grand Alou, Valais, Switzerland. Orange crystals of leishmanite growing along with yellow parauranophane and ‘biotite’ growing in the vugs of the quartz gangue. Field of view: 3 mm (vertical) (photo by Stefan Ansermet).

Leishmanite (Lhm) from Nendaz, Grand Alou, Valais, Switzerland. (a) Aggregate of leishmanite crystals in the vug of quartz gangue with parauranophane (Urp-β). (b) Parallel to subparallel intergrowths of leishmanite forming a large, composed, mega-crystal (shape of {001}-like face outlined in red lines). Back-scattered electron images by S. Ansermet and P. Roth. (c) Idealized drawing of the leishmanite crystal (non-standard orientation, b = vertical) with tentatively sketched optical orientation (X = b; O.A.P. (010 plane) = Y, Z).

Figure 2 Long description
An aggregate of leishmanite crystals labeled ′Lhm′ within a quartz gangue, accompanied by parauranophane labeled ′Urp-B′ at the bottom right. The crystals are elongated and tabular. The image B displays parallel to subparallel intergrowths of leishmanite, forming a large mega-crystal outlined in red. The label ′Lhm′ is visible and ′Urp-B′ appears at the bottom right. The image C presents an idealized drawing of the leishmanite crystal structure with a non-standard orientation, where the vertical axis is labeled ′b′. The crystal faces are marked as {010}, {100}, {001} and {110}. The optical orientation is tentatively sketched, with ′O. A. P.′ indicating the optical axis plane on the ′Y, Z′ plane. The axes ′a′, ′b′ and ′c′ are labeled, showing the crystal′s geometric configuration.
Leishmanite is optically biaxial (–) α = 1.755(3), β = 1.796(3) and γ = 1.799(3) (measured at 589 nm). The measured 2V is 28(2)° using the spindle stage. The calculated 2V is 29.7°. Dispersion r < v is strong. The optical orientation is X = b, Y and Z lie in {010} (Fig. 2c). The mineral is strongly pleochroic, with X = colourless, Y = yellow and Z = yellow; X << Y < Z. The Gladstone-Dale compatibility (Mandarino, Reference Mandarino2007) 1 – (K p/K c) is 0.013 (superior) for the empirical formula.
Vibration spectroscopy
Raman spectroscopy
We obtained the Raman spectra of leishmanite using a Horiba Labram HR Evolution spectrometer. This dispersive, edge-filter-based system is equipped with an Olympus BX 41 optical microscope, a diffraction grating with 600 grooves per millimetre, and a Peltier-cooled, Si-based charge-coupled device (CCD) detector. At 473 and 532 nm excitation, strong luminescence overwhelmed the Raman signal; therefore, we acquired the spectrum using a 633 nm He–Ne laser, for which only a minimal luminescence background was observed. The nominal laser beam energy of 13 mW was attenuated to 10% using a neutral-density filter to avoid thermal damage to the analysed area. A Raman signal was collected over the range of 4000–100 cm–1; with a 50× objective, and the system was operated in confocal mode; the beam diameter was ∼2.6 µm, and the axial resolution was ∼5 µm. Acquisition time was 240 s per spectral window; six accumulations and nine spectral windows were applied to cover the 4000–1000 cm–1 range. Wavenumber calibration was done using the Rayleigh line and low-pressure Ne-lamp emissions. Wavenumber accuracy was ∼0.5 cm–1, and spectral resolution was better than 2 cm–1. Band fitting was done after appropriate background correction, assuming combined Lorentzian-Gaussian band shapes using the Voigt function (PeakFit; Jandel Scientific Software). As there were no significant Raman bands observed in the region above 1700 cm–1 (Fig. 3a), the detailed Raman spectrum is displayed in the range 1800–1200 cm–1 (Fig. 3b) and 900–100 cm–1 (Fig. 3c). The absence of the OH stretching modes in the region 4000–3000 cm–1, visible in a Fourier transform infrared spectrum (Fig. 3) can be attributed to the poor sensitivity of the CCD detector for low frequency NIR light.
Raman spectrum of leishmanite excited by 633 nm He-Ne laser over the range 4000–100 cm–1. (a) The entire collected spectrum; (b) spectral fits in the range 1800–1200 cm–1 region; (c) spectral fit in the range 900–100 cm–1. For (b) and (c), the measured spectrum is shown as dots. The curve matching the dots is a result of a spectral fit as a sum of individual Voigt peaks shown below the curve.

Figure 3 Long description
The line graph with the y-axis labeled, Intensity in a u and the x-axis labeled, Raman shift, centimeter superscript minus 1. The x-axis runs from 4000 at the left to 100 at the right, with labeled ticks at 4000, 3000, 2000, 1000 and 100. The y-axis has labeled ticks at 0, 1 times 10 superscript 4, 2 times 10 superscript 4, 3 times 10 superscript 4 and 4 times 10 superscript 4. The plotted line stays near the baseline from 4000 to just above 1000, then rises to a sharp peak slightly above 4 times 10 superscript 4 near the 1000 tick, then drops and continues with several smaller peaks between about 900 and 100. The line graph with the y-axis labeled, Intensity in a u and the x-axis labeled, Raman shift, centimeter superscript minus 1. The x-axis runs from 1800 at the left to 1200 at the right, with labeled ticks at 1800, 1600, 1400 and 1200. A black dotted measured trace runs across the plot. An overlaid smooth curve follows the dotted trace. Several component curves are drawn beneath the main curve. The measured trace forms a broad main peak around the 1600 region, then decreases and shows smaller peaks and shoulders through the mid range and rises again to a smaller broad peak near the 1300 region before decreasing toward 1200. The line graph with the y-axis labeled, Intensity in a u and the x-axis labeled, Raman shift, centimeter superscript minus 1. The x-axis runs from 900 at the left to 100 at the right, with labeled ticks at 900, 700, 500, 300 and 100. A black dotted measured trace is overlaid by a smooth fitted curve. Multiple narrow component peaks are drawn beneath the fitted curve. The largest feature is a tall narrow peak near the left side close to 900, followed by many smaller peaks distributed across the range toward 100, including several distinct narrow peaks in the mid range and a cluster of small peaks near the right end.
Infrared spectrum of leishmanite collected in ATR mode over the range 4000–450 cm–1. (a) Entire collected spectrum; (b) spectral fit in the range 3800–1200 cm–1; (c) spectral fit in the range 1100–450 cm–1. For (b) and (c), the measured spectrum is shown as dots. The black curve matching the dots results from a spectral fit as a sum of individual Voigt peaks shown below the curve. *probably represents hydrocarbon artifacts.

Figure 4 Long description
Three stacked line graphs labeled a), b) and c), each plotting absorbance in arbitrary units against wavenumber in centimeter superscript minus 1. In a), the x-axis runs from 4000 at the left to 450 at the right. The y-axis is labeled Absorbance in arbitrary units and ranges from 0.0 to 0.5. The trace rises to a broad maximum a little below 0.4 around the 3300 region, then drops toward near 0 by about 2500. A smaller peak appears around 1600. A larger peak appears near 1000, followed by several smaller undulations from about 900 down to 450. In b), the x-axis runs from 3800 at the left to 1200 at the right. The y-axis is labeled Absorbance in arbitrary units and ranges from 0.0 to 0.5. A black measured curve is overlaid with multiple thin fitted component curves. The black curve forms a broad high region between about 3700 and 3000, with several labeled component peaks in that region. The curve then decreases toward near 0 by about 2000. Near the right side, small peaks are present around the 1400 to 1200 region, with several small fitted components and small numeric labels. In c), the x-axis runs from 1100 at the left to 450 at the right. The y-axis is labeled Absorbance in arbitrary units and ranges from 0.0 to 0.5. A black measured curve is overlaid with multiple thin fitted component curves. The black curve rises to a main peak near the 900 region, then declines gradually toward 450. Several smaller peaks and shoulders are visible between about 1100 and 700 and multiple small peaks are visible from about 650 down to 450, each with small numeric labels above them.
The assignments of both Raman and IR spectra of leishmanite were made following the review by Čejka (Reference Čejka1999) and the Raman and IR studies of various uranyl oxo-hydroxo phases by Frost et al. (Reference Frost, Čejka and Weier2007, Reference Frost, Dickfos and Čejka2008), Zhang et al. (Reference Zhang, Čejka, Lumpkin, Tran, Aharonovich, Karatchevtseva, Price, Scales and Lu2016) and Colmenero et al. (Reference Colmenero, Plášil and Němec2020).
The low-intensity vibrations at 1627 and 1603 cm–1 can be attributed to ν2 bending modes of structurally nonequivalent H2O molecules.
The bands at 1525, 1447, 1377 and 1341 cm–1 can be attributed to combination bands. For instance, Colmenero et al. (Reference Colmenero, Plášil and Němec2020) for the experimental Raman band at 1454 cm–1 provided the following assignment (based on DFT calculations): 844 cm–1 (ν3 (UO2)2+ + 2 δ (UOH)) + 599 cm–1 (ν (BiO) + ν (UOeq) + δ (UOH)).
The bands at 849, 835, 830, 804 cm–1 may be attributed to the ν1 symmetric stretching vibration of UO22+. Based on the empirical relation provided by Bartlett and Cooney (Reference Bartlett and Cooney1989), the following U–O bond lengths were obtained from observed stretching energies: 1.76, 1.78 and 1.81 Å (all of which are in line with the bond lengths in the uranyl ion obtained from the refined structure). A weak band at 773 cm–1 can be attributed to stretching vibrations of the equatorial (bridging) U–Oeq bonds in the uranyl polyhedra or to deformation vibrations of UOH.
Bands in the range of 561–292 cm–1 can be attributed to various vibrations involving U–Oeq, but also deformations (twisting) of UO22+ (see Colmenero et al., Reference Colmenero, Plášil and Němec2020).
The bands at 463 and 455 cm–1 are traditionally attributed to the stretching vibration of the U3O unit (comprising trimers of three uranyl polyhedra), but they probably arise from much more complex motions (see Colmenero et al., Reference Colmenero, Plášil and Němec2020).
The bands at 339 and 323 cm–1 can be assigned to δ (U–Oeq) vibrations of equatorial ligands.
Bands at 261 and 247 cm–1 can be connected to doubly degenerate ν2 (δ) UO22+ bending vibrations. The lower-frequency bands can be assigned to various deformational vibrations of UO22+, U–O–Ba and other lattice modes.
Infrared spectroscopy
The Attenuated Total Reflectance (ATR) spectra of leishmanite (Fig. 4) were recorded by using a micro FTIR LUMOS II spectrometer (Bruker) equipped with a germanium ATR crystal (n = 4.0). We collected spectra in the 4000–450 cm−1 range by co-adding 256 scans at a resolution of 2 cm−1 using an LN2-cooled MCT detector. The spectrum was processed using an ATR correction algorithm in OPUS software, with the mean refractive index of leishmanite. Band fitting was done after appropriate background correction, assuming combined Lorentzian-Gaussian band shapes using the Voigt function (PeakFit; Jandel Scientific Software).
The bands at 3742 (weak), 3549, 3484, 3403, 3227, 3170 and 3004 cm–1 (shoulder) represent stretching vibrations of non-equivalent OH groups and structurally distinct H2O molecules. Apart from the 3742 cm–1 band, all the bands correspond to the following O···H–O bond distances (using the correlation of Libowitzky, Reference Libowitzky1999): 2.996, 2.874, 2.800, 2.733, 2.694 and 2.650 Å, respectively. These values agree well with the structural data. The weak band observed at 3742 cm–1 could correspond to a weakly bonded OH, e.g. O1···O4 (3.19 Å).
The weak broad band at 2081 cm–1 is most probably a combination band or overtone. Bands at 1696 and 1620 cm–1 correspond to the ν2 (δ) H–O–H bending vibrations of H2O. Bands at 1550 and 1427 cm–1 can represent overtones, combination bands, or in-plane bending of U–OH. However, the 1550 cm–1 band can also be attributed to a strongly perturbed H–O–H bending vibration of molecular water. Bands at 1069, 1026 and 981 cm–1 are attributed to in-plane bending of U–OH.
Analytical data (wt.%) for leishmanite (n = 5)

Table 2 Long description
Analytical results are reported in weight percent for constituents, with columns for Mean, Range, S. D., Standard, and Normalized. PbO has a mean of 0.78, range 0.28 to 1.02, S. D. 0.27, standard alamosite, and normalized 0.77. BaO has a mean of 6.97, range 5.83 to 7.96, S. D. 0.23, standard BaSO4, and normalized 6.82. K2O has a mean of 0.13, range 0.06 to 0.21, S. D. 0.09, standard sanidine, and normalized 0.13. UO3 has a mean of 84.73, range 83.56 to 85.18, S. D. 0.46, standard UO2, and normalized 83.52. H2O* is listed with mean 8.89 and normalized 8.76, with no range, S. D., or standard shown. Total is 101.45 for mean and 100.00 for normalized, with no range, S. D., or standard shown.
* Based upon the crystal structure and charge balance with 22 O, 7 H2O, and U = 6 apfu.
S.D. = standard deviation
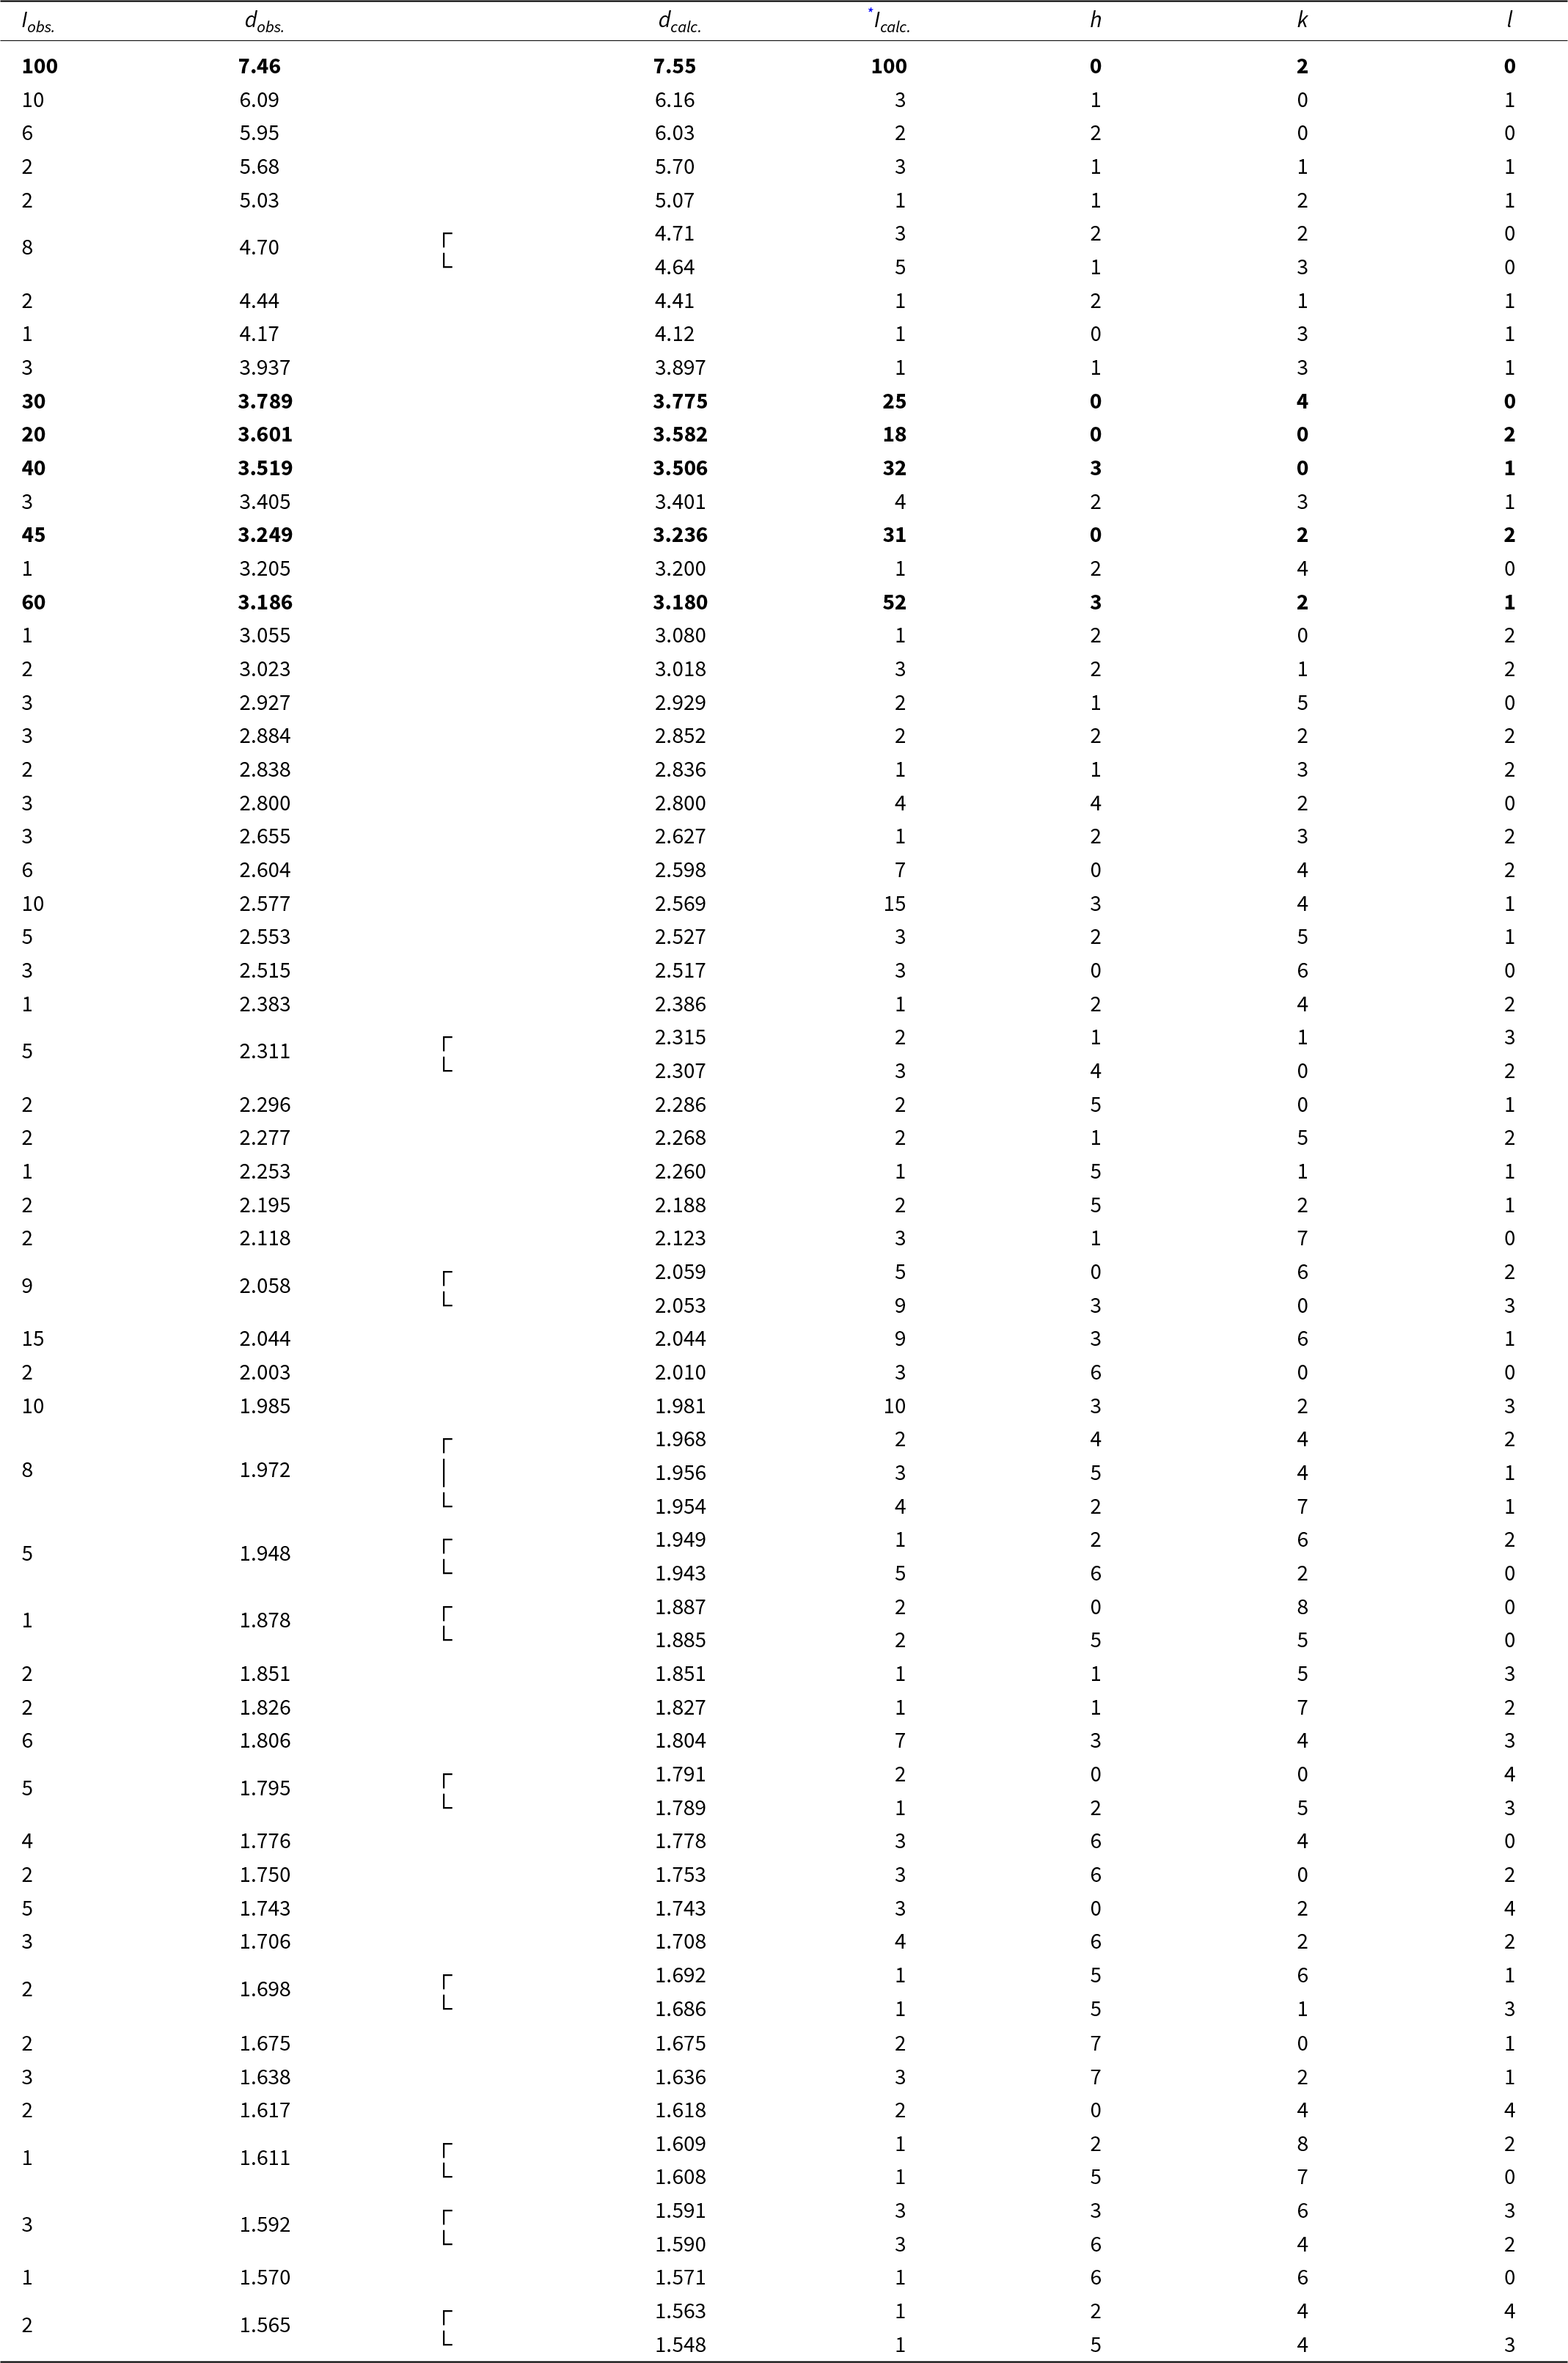
Powder X-ray diffraction data (d in Å) for leishmanite; the six strongest observed diffractions are reported in bold

Table 3 Long description
Powder diffraction entries list observed intensity, Iobs, observed spacing, dobs in angstroms, calculated spacing, dcalc, calculated intensity, Icalc, and Miller indices h, k, l. Iobs ranges from 1 to 100, and dobs spans from 7.46 down to 1.548 angstroms. The first rows include Iobs 10 at dobs 6.09 with dcalc 6.16 and h k l 1 0 1, and Iobs 6 at dobs 5.95 with dcalc 6.03 and h k l 2 0 0. Several dobs values are grouped with a brace mark, including dobs 4.70 paired with 4.64, dobs 2.311 paired with 2.307, dobs 2.058 paired with 2.053, dobs 1.972 grouped with 1.956 and 1.954, dobs 1.948 paired with 1.943, dobs 1.878 paired with 1.885, dobs 1.795 paired with 1.789, dobs 1.698 paired with 1.686, dobs 1.611 paired with 1.608, dobs 1.592 paired with 1.590, and dobs 1.565 paired with 1.548. Examples of higher Iobs rows include Iobs 30 at dobs 3.789 with dcalc 3.775 and Icalc 25 at h k l 0 4 0, Iobs 40 at dobs 3.519 with dcalc 3.506 and Icalc 32 at h k l 3 0 1, Iobs 45 at dobs 3.249 with dcalc 3.236 and Icalc 31 at h k l 0 2 2, and Iobs 60 at dobs 3.186 with dcalc 3.180 and Icalc 52 at h k l 3 2 1. At smaller spacings, entries include Iobs 10 at dobs 1.985 with dcalc 1.981 and Icalc 10 at h k l 3 2 3, and Iobs 6 at dobs 1.806 with dcalc 1.804 and Icalc 7 at h k l 3 4 3. Across rows, dcalc values are close to the corresponding dobs values, and Icalc varies from 1 up to 100 alongside the listed h, k, l indices.
* Icalc – calculated using the software PowderCell2.3 (Kraus and Nolze, Reference Kraus and Nolze1996) based on the structural model given in Table 5.
Data collection and structure refinement details for leishmanite

Table 4 Long description
Data collection and structure refinement details are listed for a leishmanite crystal, including composition, unit cell, measurement conditions, reflection counts, and refinement statistics. Structural formula is given as barium and lead totaling 1.000 with water and a uranyl oxide hydroxide group, followed by additional water. Unit cell parameters list a 12.079(2) angstroms, b 15.096(3) angstroms, c 7.155(2) angstroms, volume 1304.7(5) cubic angstroms, Z 2, and space group Pmn21 number 31. Calculated density is 5.209 grams per cubic centimeter, temperature 295(2) K, wavelength MoK alpha 0.71073 angstrom, and crystal dimensions 0.059 by 0.041 by 0.029 millimeters. Collection mode is omega scans to fill an Ewald sphere, with frame width 0.5 and counting time 800 seconds; limiting theta angles are 2.16 to 49.85 degrees and limiting diffraction indices are minus 17 less than h less than 25, minus 32 less than k less than 27, and minus 13 less than l less than 15. Reflections include 46468 total, 11315 unique, and 6324 observed with intensity greater than 3 sigma of intensity; absorption correction is 39.17 per millimeter using multi scan method ABSPACK3, with Tmin 0.61874 and Tmax 1. Rint is 0.068 with completeness to theta max of 98 percent, F000 is 1675, and parameters, constraints, restraints are 111, 10, 0. Refinement results list R1 0.0392 and wR2 0.0971 for observed, R1 0.1130 and wR2 0.1148 for all, GOF 1.24 for observed and 1.10 for all, weighting scheme sigma with weights 1 divided by sigma squared of Fo squared plus 0.052858 times P squared, where P is Fo squared plus 2Fc squared divided by 3, and delta rho minimum minus 0.86 and maximum 2.47 electrons per angstrom cubed at 0.08 angstrom from U1. Number of Friedel pairs is 4661.
Atom coordinates and equivalent/isotropic displacement parameters (in Å2) for leishmanite

Table 5 Long description
Rows list atom labels U1 to U4, O1 to O19, Ba1, and Pb1 with columns, x slash a, y slash b, z slash c, Ueq slash Uiso with an asterisk marker on many oxygen entries, and Occupancy. U1 has x slash a 0.30904(3), y slash b minus 0.01019(2), z slash c 0.51672(5), and Ueq slash Uiso 0.01215(7); U2 has 0.31027(3), 0.51054(3), 0.50005(5), and 0.01248(8). U3 and U4 each have x slash a 0.5, with U3 at y slash b minus 0.02763(3) and z slash c 0.94869(6), and U4 at y slash b 0.52361(3) and z slash c 1.03935(6); their Ueq slash Uiso values are 0.01237(10) and 0.01308(10). O1 lists x slash a 0.3835(18), y slash b 0.2808(15), z slash c 1.187(3), Ueq slash Uiso 0.029(6) with an asterisk marker, and Occupancy 0.349(2). Ba1 and Pb1 share identical coordinates and Ueq slash Uiso, with x slash a 0.38737(9), y slash b 0.24744(7), z slash c 0.81664(12), and Ueq slash Uiso 0.0231(3), while their Occupancy values are 0.455(5) for Ba1 and 0.045(5) for Pb1. Oxygen entries O2 through O17 and O19 list coordinates and Ueq slash Uiso values but have blank Occupancy cells; examples include O2 with x slash a 0.5, y slash b minus 0.1462(6), z slash c 0.9314(13), and Ueq slash Uiso 0.0158(15) with an asterisk marker, and O19 with x slash a 0, y slash b 0.2495(9), z slash c 1.031(2), and Ueq slash Uiso 0.045(3) with an asterisk marker. O18 lists x slash a 0.5, y slash b 0.2502(13), z slash c 0.511(3), Ueq slash Uiso 0.042(4) with an asterisk marker, and Occupancy 0.765(4).
Selected bond distances (in Å) for leishmanite

Table 6 Long description
Bond distances are listed in angstroms for U1, U2, U3, U4, and Ba1 to oxygen atoms, plus a section labeled, Hydrogen bonds(O O contacts), giving oxygen to oxygen contact distances. For U1, distances include U1 to O10 1.789(9), U1 to O4 1.800(8), U1 to O8 2.201(7) and 2.262(7), U1 to O12 2.431(3), and U1 to O6 2.469(6) and 2.563(6), plus entries labeled, less than U1 to OUr greater than 1.79 and, less than U1 to Oeq greater than 2.378. For U2, distances include U2 to O11 1.797(6), U2 to O5 1.812(6), U2 to O9 2.281(6) and 2.297(6), U2 to O13 2.383(3), and U2 to O7 2.452(7) and 2.575(6), plus, less than U2 to OUr greater than 1.81 and, less than U2 to Oeq greater than 2.397. For U3 and U4, values include U3 to O17 1.77(1), U3 to O2 1.794(9), U3 to O8 2.213(7) listed twice, U3 to O6 2.406(6) listed twice, U3 to O12 2.708(7), with, less than U3 to OUr greater than 1.80 and, less than U3 to Oeq greater than 2.399; and U4 to O3 1.79(1), U4 to O16 1.81(1), U4 to O9 2.211(6) listed twice, U4 to O7 2.391(6) listed twice, U4 to O13 3.080(7), with, less than U4 to OUr greater than 1.81 and, less than U4 to Oeq greater than 2.561. Ba1 to oxygen distances are Ba1 to O1 2.70(2), Ba1 to O4 3.007(7), Ba1 to O5 2.903(6), Ba1 to O10 3.123(8), Ba1 to O11 2.999(6), Ba1 to O15 2.819(7), Ba1 to O16 2.98(1), Ba1 to O17 2.94(1), and Ba1 to O18 2.58(2). Hydrogen bond oxygen to oxygen contacts include O1 to O1 2.80(3), O1 to O4 3.19(2), O1 to O5 2.91(2), O1 to O14 2.65(3), O1 to O18 2.75(3), O9 to O10 2.871(4), O9 to O11 2.781(4), O14 to O15 2.84(2), O14 to O19 2.93(2), O15 to O19 3.16(1), O12 to O19 2.98(2), O13 to O19 3.05(2), O11 to O18 2.88(2), O11 to O13 3.00(1), O10 to O18 2.84(2), O10 to O12 2.97(1), O9 to O13 2.871(9), O8 to O12 2.727(9), O7 to O14 2.72(1), and O7 to O16 2.96(1).
Bond valence analysis for leishmanite. Values are in valence units (vu)

Table 7 Long description
Bond valence values in valence units are listed by oxygen site from O1 to O19 across columns U1, U2, U3, U4, Ba1 or Pb1, plus columns for anion total, Assignment, and HBA. Cation totals at the bottom are 5.95 for U1, 5.77 for U2, 6.07 for U3, 5.84 for U4, and 1.83 for Ba1 or Pb1. O2 has 1.70 under U4 and an anion total of 1.70 with Assignment, O and HBA 2; O3 has 1.71 under U4 with anion total 1.71, Assignment, O and HBA 1 to 2. O4 has 1.68 under U1 and 0.14 under Ba1 or Pb1 for an anion total 1.82, Assignment, O and HBA 1; O5 has 1.64 under U2 and 0.18 under Ba1 or Pb1 for an anion total 1.82, Assignment, O and HBA 1. O6 lists 0.74 under U1 and 0.47 with multiplicity 2 under U3 for an anion total 1.21, Assignment, OH and HBA 0; O7 lists 0.75 under U2 and 0.48 with multiplicity 2 under U4 for an anion total 1.23, Assignment, OH and HBA 0. O8 lists 1.35 under U1 and 0.70 with multiplicity 2 under U3 for an anion total 2.06, Assignment, O and HBA 1; O9 lists 1.20 under U2 and 0.71 with multiplicity 2 under U4 for an anion total 1.90, Assignment, O and HBA 0. Water assigned rows include O1 with anion total 0.30 and HBA 2, O14 with anion total 0.00 and HBA 2, O15 with anion total 0.22 and HBA 2, O18 with anion total 0.41 and HBA 2, and O19 with anion total 0.00 and HBA 2.
Multiplicities indicated by ×↓. HBA – number of accepted (weak; 0.2 vu) H-bonds. Bond–valence parameters are from Gagné and Hawthorne (Reference Gagné and Hawthorne2015).
Crystal structure of leishmanite projected down c. Uranyl-oxo-hydroxy layers (yellow polyhedra = UO7 bipyramids) alternate with an interlayer containing Ba/Pb sites (indigo) and H2O molecules.

Figure 5 Long description
The crystal structure of leishmanite, featuring alternating uranyl-oxo-hydroxy layers and interlayer sites. The uranyl-oxo-hydroxy layers are represented by yellow polyhedra, specifically UO bipyramids. These layers alternate with interlayers containing Ba and Pb sites, depicted in indigo and HO molecules. The structure includes labeled oxygen sites such as O1w, O15w, O18w, O19w and O14w, which are positioned around the indigo sites. The arrangement forms a complex network where the uranyl bipyramids share edges and vertices, creating an infinite sheet of polyhedra. The diagram visually represents the spatial organization and connectivity of these elements within the crystal structure.
Bands at 914, 889 and 858 cm–1 are assigned to the split triply degenerated ν3 antisymmetric stretching mode of UO22+, indicative of multiple nonequivalent uranyl environments (and the site-symmetry lowering). The band at 821 cm–1 is attributed to the ν1 symmetric stretching vibration of UO22+. Applying the empirical correlation of Bartlett and Cooney (Reference Bartlett and Cooney1989), the ν3 vibrational bands correspond to U–O bond lengths of 1.76, 1.79 and 1.82 Å, whereas the ν1 vibration yields a U–O distance of 1.79 Å. All these distances are in line with the bond lengths obtained from the structure.
Bands at 760 and 650 cm–1 can be attributed to H2O librations and/or out-of-plane bending of U–OH. Weak bands in the 600–400 cm–1 region are attributed to stretching vibrations of the equatorial (bridging) U–Oeq bonds of the uranyl polyhedra and to deformation vibrations of U–O–Ba, torsion of OH (deformations), and other complex motions.
Chemical composition
Chemical analyses (n = 5) were performed on carbon-coated, polished epoxy mounts with a Cameca SX-100 electron microprobe (WDS mode, 15 kV, 2 nA, 10 μm beam size). The amount of H2O was not determined directly due to the scarcity of pure material. It was calculated using stoichiometry, based on U = 6 and O = 22 atoms per formula unit (apfu), with 7 H2O pfu. The chemical composition is reported in Table 2. Other elements with Z > 8 were sought but not detected. The crystal structure, Raman, and IR spectroscopy data excluded the presence of B–O, C–O, N–O and N–H bonds in the mineral and confirmed the presence of H2O. Analytical data are given in Table 2. The empirical formula (based on 6 OH and 7 H2O, and U = 6 apfu) could be written as (Ba0.914Pb0.071K0.057)Σ1.042(H2O)4[(UO2)6O4.023(OH)5.977]·3H2O. The simplified formula is (Ba, Pb)(H2O)4[(UO2)6O4(OH)6]·3H2O. The ideal formula is Ba(H2O)4[(UO2)6O4(OH)6]·3H2O, which requires BaO 7.48, UO3 83.73, H2O 8.79, total 100 wt.%.
Powder X-ray diffraction
Powder X-ray diffraction (PXRD) data were recorded at room temperature on the XtaLAB Synergy-DW system equipped with the HyPix-Arc150 detector, using CuKα radiation (the primary beam from the rotating anode was tuned by the primary optics to decrease the beam divergence). A Gandolfi-like motion on the φ and ω axes was used to randomize the sample. Observed d values and intensities were derived by profile fitting using the HighScore Plus program. Data are given in Table 3. Unit cell parameters refined from the powder data using the same program (57 observed diffractions, refined zero-shift = –0.01(7)°2θ) are as follows: Orthorhombic Space group: Pmn21 (#31), a = 12.06(2), b = 15.11(3), c = 7.16(1) Å and V = 1305(1) Å3.
Single-crystal X-ray diffraction
The single-crystal XRD data for leishmanite were collected on an Rigaku Oxford Diffraction XtaLAB Synergy-DW system equipped with the HyPix-Arc150 detector, using monochromatic MoKα radiation from a 1.2 kW microfocus rotating-anode source. A crystal fragment of the single crystal, with approximate dimensions of 56 × 41 × 29 μm, was mounted on a glass fibre and analysed at room temperature to obtain the full-sphere data set (98% to a resolution of 0.5 Å) using ω-scans (frame width of 0.5° and a counting time of 800 seconds per frame). Data reduction was performed using CrysAlisPro Version 1.171.44.97a (Rigaku, 2025). The same software was used to correct absorption effects with ABSPACK3 (multi-scan). The structure of leishmanite was solved from the intensity data using the intrinsic phasing algorithm of the SHELXT program (Sheldrick, Reference Sheldrick2015), and refined using the software Jana2020 (Petříček et al., Reference Petříček, Palatinus, Plášil and Dušek2023); a Wilson’s modification to the full-matrix least-squares routines was applied to avoid the statistical bias (Wilson, Reference Wilson1976). The structure refinement, including anisotropic displacement parameters for U and Ba atoms, converged to R 1 = 0.0392 for 6324 reflections with I > 3σ(I) and wR 2 = 0.1148 for all 11315 reflections (GOF = 1.10). Data collection and refinement details are given in Table 4; atom coordinates and displacement parameters in Table 5; selected bond distances in Table 6; and a bond-valence analysis in Table 7. The crystallographic information file has been deposited and is available as Supplementary material (see below).
Crystal structure of leishmanite
Topology of the uranyl-oxide sheets (structural units) found in leishmanite: α-U3O8 UOH sheet with the stacking sequence PD and β-U3O8-type sheet with stacking sequence DRU (U – pentagons and triangles pointing up; D – pentagons and triangles pointing down; P – pentagons; R – rectangles). Distribution of the OH– groups within the sheets (blue dots) and Ba2+ cations in the interlayer (violet).

Figure 6 Long description
The diagram consists of two distinct sheet structures labeled as alpha-U3O8 and beta-U3O8. On the left, the alpha-U3O8 sheet is depicted with a network of interconnected pentagons and hexagons. The sheet includes labeled sites U1 and U3, surrounded by pentagonal bipyramids, forming a protasite topology. The letters P and D are positioned at the top, indicating the stacking sequence. Purple spheres are distributed across the sheet, representing specific atomic sites. On the right, the beta-U3O8 sheet is shown with a similar network, but with different connectivity. Labeled sites U2 and U4 are surrounded by bipyramids, forming a U3O8-type topology. The letters D, R and U are placed at the top, indicating the stacking sequence. The sheet also features purple spheres, similar to the alpha sheet. Both sheets are oriented with axes labeled a, b and c, indicating the crystallographic directions.
UOH sheets in (a) leishmanite (α-U3O8 UOH sheet selected), (b) billietite, (c) protasite and (d) compreignacite. Distribution of the OH– groups within the sheets (blue dots) and cations in the interlayer (Ba2+ – violet; K+ – lavender).

Figure 7 Long description
The UOH sheet structure in leishmanite, featuring a network of interconnected polyhedra with violet dots representing barium ions distributed throughout the sheet. Panel b shows the UOH sheet structure in billietite, with a similar polyhedral network but fewer violet dots, indicating a different distribution of barium ions. Panel c depicts the UOH sheet structure in protasite, displaying a dense arrangement of polyhedra with violet dots scattered across, representing barium ions. Panel d presents the UOH sheet structure in compreignacite, characterized by a polyhedral network with lavender dots aligned in vertical columns, indicating potassium ions. Each panel includes axes labeled a and c, providing orientation. The diagram compares the topology and distribution of cations within the UOH sheets across these minerals, highlighting differences in ion positions and structural density.
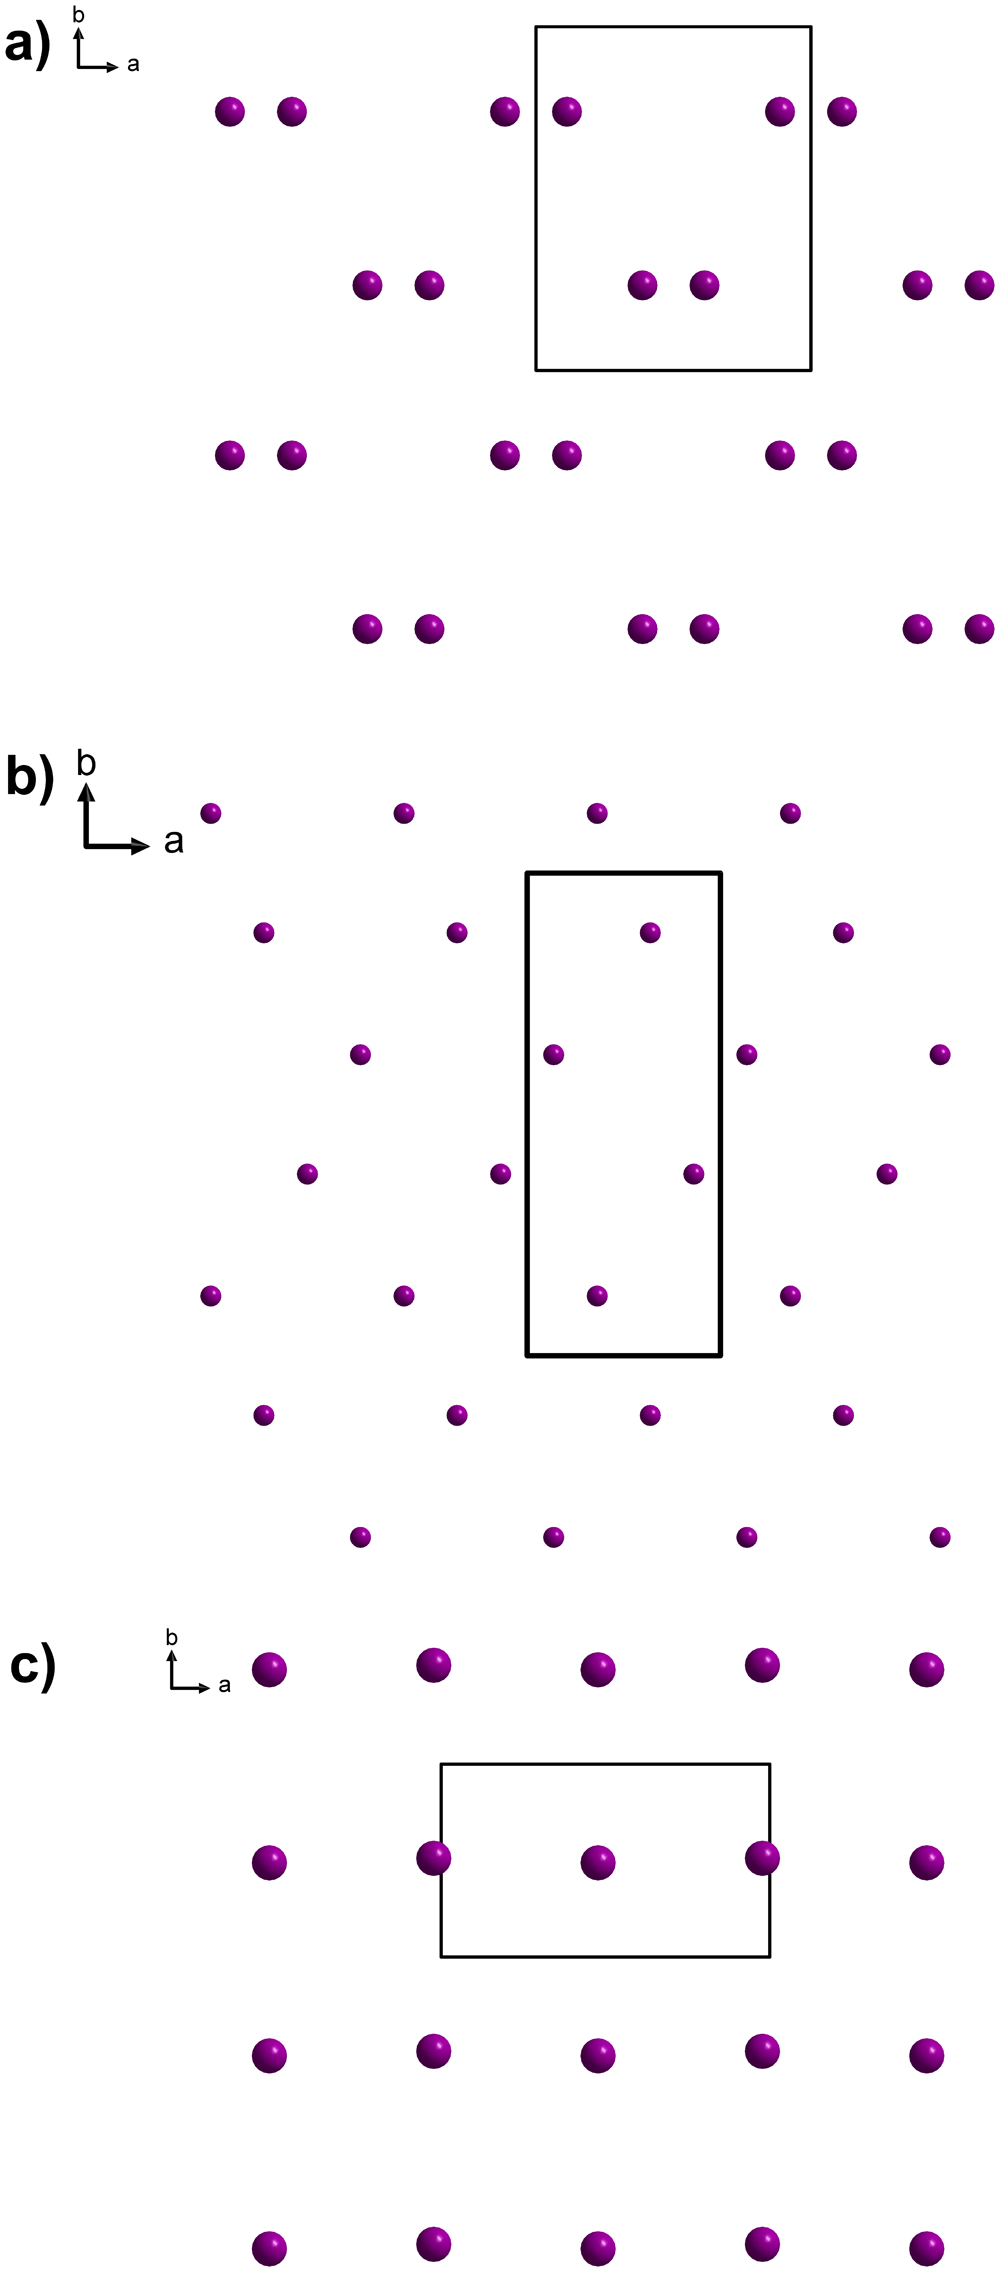
Distribution (ordering) of interlayer Ba2+ cations in (a) leishmanite, (b) billietite and (c) protasite. Unit-cell edges in black lines.

The structure of leishmanite (Fig. 5) contains four U, one mixed Ba/Pb, and nineteen O sites in the crystal structure (Table 5). In leishmanite, three U sites (U1, U2 and U3) are surrounded by seven O atoms, forming squat UO7 pentagonal bipyramids, whereas U4 is surrounded by six O atoms, forming a tetragonal bipyramid. U1 and U3 are localized within the layer of uranyl polyhedra at b ≈ 0, whereas U2 and U4 are at the symmetrically nonequivalent layer at b ≈ 0.5. U1 and U3 uranyl pentagonal bipyramids share edges and vertices to form an infinite sheet of polyhedra with protasite topology (Fig. 6a), typical of the α-U3O8 sheet type with PD sequence (Miller et al., Reference Miller, Finch, Burns and Ewing1996; Burns, Reference Burns2005). U2 and U4 uranyl bipyramids share edges and vertices to form an infinite sheet of polyhedra with U3O8-type topology (Fig. 6b), with DRU sequence (Miller et al., Reference Miller, Finch, Burns and Ewing1996; Burns, Reference Burns2005). The composition of the structural unit is [(UO2)6O4(OH)6]2–. The charge of the sheet is compensated by the divalent cations in the interlayer, Ba2+ and subordinate Pb2+ (Table 5), substituting for it at a single 4b mixed site. The site has reduced occupancy of 50%, as the resulting interatomic distance to a symmetrically related metal site is 2.72 Å, which is too short for full occupancy. This occupational disorder with short cation-to-cation distances somewhat resembles the disorder in the structure of compreignacite (Burns Reference Burns1998), where K is occupying the 8h site with 50% occupancy (and resulting shortest K–K distance of 2.07 Å). The Ba/Pb site is linked to nine O atoms: six of them are uranyl O atoms of the adjacent layers (O4, O5, O10, O11, O16, O17) and three of them are H2O molecules (O1, O15, O18) (Tables 6 and 7; Fig. 5). There are two additional H2O sites (O14 and O19) in the interlayer non-bonded directly to any metal cation. Adjacent UOH layers are linked through the Ba–O bonds as well as H-bonds (OH– on the sheets and Oacceptors within the sheets; see Table 7). Based on the refined occupancies and bond-valence considerations, the structural formula for leishmanite is (Ba0.911Pb0.089)Σ1.000(H2O)3.46[(UO2)3O2(OH)3]2·3H2O (Z = 2).
Leishmanite can be, to a certain extent, considered as a Ba-analogue of compreignacite, K2[(UO2)6O4(OH)6]·7H2O (Protas, Reference Protas1964; Burns, Reference Burns1998). Compreignacite is based upon α-U3O8 (protasite) topology, whereas leishmanite contains both α-U3O8- and β-U3O8-type sheets (Fig. 6), like billietite (Fig. 7). Billietite, orthorhombic Ba(UO2)6O4(OH)6·8H2O (Finch et al., Reference Finch, Burns, Hawthorne and Ewing2006), however, crystallizes in a different space group (Pbn21) and has twice the unit-cell volume of leishmanite (with a doubled c parameter). Despite the longer counting times (800 seconds per frame) in the diffraction experiment, we saw no clear evidence that the reflections halved c*. We therefore assume that the differences between leishmanite and billietite lie in the different distribution (ordering) of the Ba in the interlayer (Figs 7 and 8). There is another Ba-dominant UOH mineral, protasite, a monoclinic Ba(UO2)3O3(OH)2·3H2O for Z = 2 (Pagoaga et al., Reference Pagoaga, Appleman and Stewart1986, Reference Pagoaga, Appleman and Stewart1987). The relationship between leishmanite and protasite should be also examined in more detail. Protasite has been described as monoclinic (space group Pn) with a = 12.2949(16) Å, b = 7.2206(10) Å, c = 6.9558(8) Å, β = 90.401(15)° with V = 617.5 Å3 (Z = 2). That is approximately half the volume of the leishmanite now described. Nevertheless, the distribution of the OH– groups within the UOH sheets and the distribution of the Ba2+ in the interlayer of the leishmanite structure are distinct (Figs 7 and 8) and protasite contains α-U3O8-type sheets exclusively.
Discussion – leishmanite and its position in the currently accepted scheme of oxidation-hydration weathering of uraninite
The discovery of leishmanite, a barium uranyl-oxide hydroxy-hydrate, is surprising, given that billietite, a mineral with a similar chemical composition but a distinct crystal system, is quite common as a supergene uranium mineral (see e.g. Plášil, Reference Plášil2018b). The explanation probably lies in the retro-metamorphic formation of leishmanite.
The association of leishmanite with parauranophane (a rare mineral in the Alps) is characteristic of the sample studied. In the Central Alps, the age of formation, using the 238U–234U–230Th secular disequilibrium method on parauranophane in zeolite veins in the Mont Blanc and Bergell granite massifs, yields ages of 41,000 ± 2,500 years and 200,330 ± 11,470 years, respectively. These ages correspond to the crystallization of parauranophane under depth and temperature conditions specific to the retrometamorphic zeolitic facies, which affect all Central Alpine tectonic units (Meisser, Reference Meisser2012). In the Siviez-Mischabel Nappe, where leishmanite was discovered, this discrete zeolitic retrograde metamorphism is well known, with a mineral association indicating a formation temperature of 90–150°C (Marthaler et al., Reference Marthaler, Girard, Meisser, Gouffon and Savary2021).
From a geochemical perspective, though the presence of uraninite clearly establishes the origin of uranium, the same cannot be said for barium. Baryte remains unknown in these mineralizations. Nevertheless, barium is systematically enriched in rock-forming minerals, particularly phyllosilicates and tectosilicates, in these geological formations of the same age, as evidenced by the presence of Ba-muscovite (oellacherite variety), Ba-rich K-feldspar (hyalophane variety), or even discreet Ba-bearing silicates such as cymrite and celsian (Meisser and Ansermet, Reference Meisser and Ansermet1993). Therefore, Ba was probably derived from the host rocks, whereas leishmanite formed distal to the Ba and U sources.
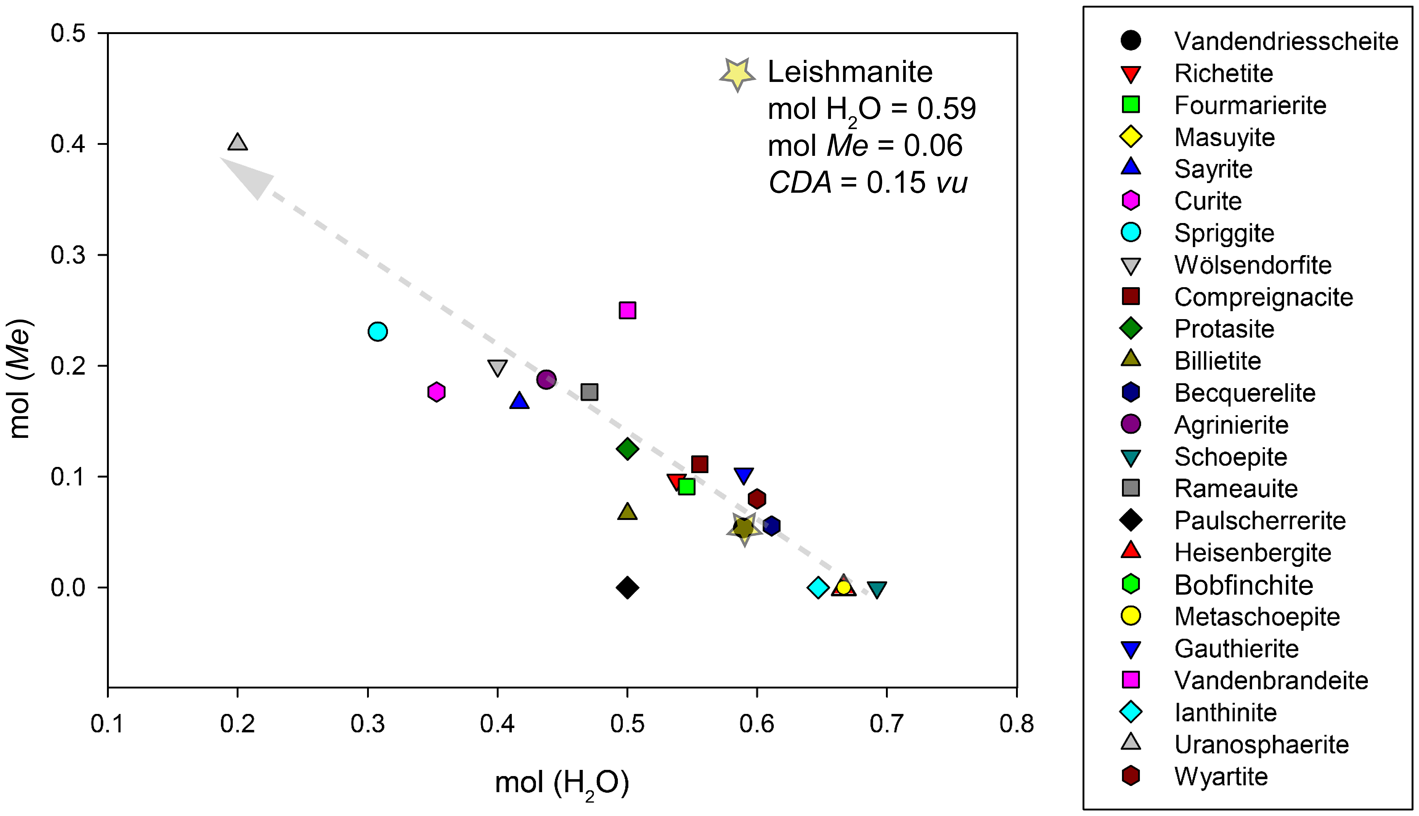
UOHs play a key role in the oxidation-hydration of uraninite, UO2+x (or spent nuclear fuel), from its initial stages (Finch and Ewing, Reference Finch and Ewing1992; Wronkiewicz et al., Reference Wronkiewicz, Bates, Wolf and Bick1996; Janeczek et al., Reference Janeczek, Ewing, Oversby and Werme1996). In many natural and synthetic (experimental) systems, uraninite (for simplicity) undergoes oxidation-hydration, transforming into newly formed crystalline or nanocrystalline phases that contain predominantly U6+ and a high proportion of molecular H2O (Plášil, Reference Plášil2014, Reference Plášil2018b; Plášil et al., Reference Plášil, Steciuk, Majzlan, Škoda, Filip, Petr, Kolařík, Klementová, Bähre, Klöß and Lapčák2022). Finch and Ewing (Reference Finch and Ewing1992) documented, through detailed studies of mineral associations, that in supergene UOH minerals, the molar proportion of [MO] (M = divalent cation) increases and the molar proportion of (H2O) decreases with increasing degree of uraninite alteration. This idea also applies to monovalent cations (Schindler and Hawthorne, Reference Schindler and Hawthorne2004; Plášil, Reference Plášil2014). Schindler and Hawthorne (Reference Schindler and Hawthorne2004) also documented that there is a trend towards increasing depolymerization of structural units of UOH with increasing alteration (cf. figure 11 in Schindler and Hawthorne, Reference Schindler and Hawthorne2004). This means increasing dominance of U, D and R chains over P chains in the structural sheets of UOH minerals. In other words, this is a process of deoxygenation of structural units. With increasing ‘degree of alteration’, the average basicity, the so-called charge deficiency per anion (CDA) of the structural units increases (Schindler and Hawthorne, Reference Schindler and Hawthorne2004; Plášil, Reference Plášil2018b); as the molar content of H2O decreases, the CDA value increases. The CDA value of structural units correlates generally with the pH of the solution from which these structural units precipitate (Schindler and Hawthorne, Reference Schindler and Hawthorne2001, Reference Schindler and Hawthorne2008; Hawthorne and Schindler, Reference Hawthorne and Schindler2008). This aligns with the conclusions of Schindler and Hawthorne (Reference Schindler and Hawthorne2004; Fig. 9a), which show an increasing CDA value with generally increasing pH and M 2+ activity. Figure 9 in our paper shows the trend observed for the UOH alteration associations. Interestingly, leishmanite, which, otherwise, structurally resembles compreignacite (namely by the similar unit cell metrics) and chemically resembles billietite, is distinctive and occupies in the graph the same space as vandendriesscheite, orthorhombic Pb1.57[(UO2)10O6(OH)11](H2O)11 (Burns, Reference Burns1997). This mineral is the first in the paragenetic sequence to contain Pb2+ and appears immediately after schoepite (no Me in the interlayer), similar, e.g. to becquerelite, Ca(UO2)6O4(OH)6·8H2O. The discovery of leishmanite bears important implications. We can expect it to occur in those ‘early-alteration’ associations during uraninite weathering. In distal settings, the proximal early-alteration scheme is likely to decouple from direct alteration processes, with mineral crystallization controlled instead by different chemical activities and complexes in the fluid phase.
Natural uranyl-oxide hydroxy-hydrate minerals. Their chemical composition as a function of the proportion of molecular H2O and cationic content. The grey arrow indicates increasing alteration. The position of leishmanite is indicated by a yellow star at mol H2O = 0.59 and mol Me = 0.06, at the same location as vandendriesscheite. Figure adapted from the paper of Plášil (Reference Plášil2018b).

Figure 9 Long description
The horizontal axis is labeled, mol of H subscript 2 O, with tick labels from 0.1 to 0.8. The vertical axis is labeled, mol of Me, with tick labels from 0.0 to 0.5. A dashed diagonal line runs from higher mol of Me at lower mol of H subscript 2 O toward lower mol of Me at higher mol of H subscript 2 O. Most plotted points lie close to the dashed diagonal line, forming a downward pattern where mol of Me decreases as mol of H subscript 2 O increases. The densest concentration of points appears around mol of H subscript 2 O from 0.3 to 0.6 and mol of Me from 0.1 to 0.25. A smaller set of points appears near mol of H subscript 2 O from 0.6 to 0.7 and mol of Me near 0.05. A text annotation near the upper middle reads, Leishmanite, mol H subscript 2 O equals 0.06, mol Me equals 0.06, CDA equals 0.15 v u. A legend lists mineral names, each paired with a distinct marker symbol, including Vandendriesscheite, Richetite, Fourmarierite, Masuyite, Sayrite, Curite, Spriggite, Wolsendorfite, Compreignacite, Pottsite, Billietite, Becquerelite, Agrinierite, Schoepite, Pseudometaschoepite, Rameauite, Heisenbergite, Bobcookite, Widenmannite, Vandendriesscheite, Ianthinite, Uranophane and Wolsendorfite.
Supplementary material
The supplementary material for this article can be found at https://doi.org/10.1180/mgm.2026.10255.
Acknowledgements
The helpful comments of three anonymous reviewers are greatly appreciated. This study was supported by the CzechNanoLab Research Infrastructure, supported by MEYS CR (LM2023051) (JP) and by the OP VVV project (Geobarr CZ.02.1.01/0.0/0.0/16_026/0008459) to RS
Competing interests
The authors declare none.