Implications
Among the most important decisions that have to be taken in breeding programs is the prediction of a reliable breeding value for a specific trait. The race level is an important factor in the genetic evaluations and Thurstonian models have been demonstrated that they can deal better with this effect. Models that improve the accuracy of prediction will give a better response to selection as it is proportional to the accuracy. Correlations between breeding values across models were high, and then genetic progress seems to be warranted irrespective of the most realistic model.
Introduction
The ranking in the race is one of the most common traits used as a measure of performance in the genetic evaluation of competition horses (Tavernier, Reference Tavernier1991; Ricard and Chanu, Reference Ricard and Chanu2001; Ricard and Legarra, Reference Ricard and Legarra2010). The discontinuous nature of rankings in competitions has promoted the use of different transformations of this trait using linear approaches. The most frequent criteria used in Europe to evaluate the breeding value in sport horses are transformed ranks (Ruhlmann et al., Reference Ruhlmann, Janssens, Philipsson, Thorén-Hellsten, Crolly, Quinn, Manfredi and Ricard2009; Ricard and Legarra, Reference Ricard and Legarra2010): the squared root of ranks (Lührs-Behnke et al., Reference Lührs-Behnke, Röhe and Kalm2006), the Snell-transformation score (Snell, Reference Snell1964; Gómez et al., Reference Gómez, Cervantes, Bartolomé, Molina and Valera2006) or normalized scores (Aldridge et al., Reference Aldridge, Kelleher, Reilly and Brophy2000). An alternative is to apply statistical tools that can work with discrete categories, such as the threshold model (Gianola, Reference Gianola1982), that can use full rank without any transformation. However, sometimes it is difficult to define the number of thresholds. The way this categorical trait is scored underestimates the horse variance and the genetic effect and, as a consequence, the heritability of the underlying performance is underestimated (Ricard and Legarra, Reference Ricard and Legarra2010).
On the other hand, the rank of horses is from 1 to the number of participants in each event regardless of the average level of the participants. For example, the first in a short race will not probably be the first in a long race. In fact, endurance competitions are long distance races that vary from 40 to 160 km/day. This type of competition is carried out cross country, where not only speed is important, but also endurance and the adapted physical condition of the horses are essential. Moreover, horses can be excluded after veterinary controls when they exceed a determined heart rate or certain metabolic parameters or reasons related to limbs during the endurance exercise. Rider and rider–horse interaction also plays a crucial role in the competition performance and in welfare aspects (Hausberger et al., Reference Hausberger, Roche, Henry and Visser2008; Visser et al., Reference Visser, Van Reenen, Blokhuis, Morgan, Hassmén, Rundgren and Blokhuis2008; McLean and McGreevy, Reference McLean and McGreevy2010). All these factors make it very difficult to define models for genetic evaluation. Ricard and Touvais (Reference Ricard and Touvais2007) studied endurance performance and compared several models to fix the race effect and they concluded that the level of competition is the true measurement of difficulty of the race. However, they established that the rivalry between horses is the most important factor in the race effect. In fact, the model of choice should be able to adjust the results for the competitive level of each event. The so called Thurstonian approach is a competitive model because it describes the competitive ability of animals as a continuous unobserved value to fix the race effect (Ricard and Legarra, Reference Ricard and Legarra2010). This model for quantitative genetic effects could be applied to data consisting of ranks using the truncated Gaussian distribution, and the variance parameters are estimated through a full Bayesian approach (Gianola and Simianer, Reference Gianola and Simianer2006). The competitive models were previously used in other sport performance such as in trotter horses (Gómez et al., Reference Gómez, Varona, Molina and Valera2011), where horses with the highest ranking in a low race level of competition had similar genetic value as the horses with a lower rank in a high race level, but their use is scarce.
The Spanish Arabian Horse Breeder Association (AECCA) is currently developing a breeding program aimed at improving endurance performance. This selection objective is common in other crossbreeds such as Anglo-Arabian, Hispano-Arabian and Spanish Sport Horse. The refinement in the genetic model used for breeding value predictions will improve the genetic response in endurance performance.
Therefore, the aim of this study was to compare the prediction abilities of linear, threshold and Thurstonian models for the genetic evaluation of ranking trait in endurance horses as well as to deepen the abilities of the less used models.
Material and methods
Data
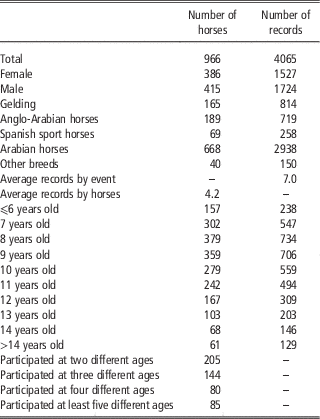
The total data set consisted of 4065 ranking records from 966 horses (415 males, 386 females and 165 geldings) aged between 5 and 24 years. Most of them were Arabian horses (69.2%) and the rest were Anglo-Arabian (19.6%), Spanish Sport Horse (7.1%) and other breeds such as Spanish Purebred, Spanish-Arabian and Thoroughbred horses (4.1%). The Arabian horse is the most used breed in this performance, but many breeders are interested how other sport horses perform regardless of the breed. The records were collected during 581 endurance races held between 2000 and 2014. The average records per event were seven with a minimum of three and a maximum of 42. 13% of events had more than 11 participants. The number of records per horse ranged between 1 and 25 with an average of 4.2 (Table 1).
Structure and descriptive statistic of endurance races held between 2000 and 2014

Regarding rider information, the number of different riders in the data set was 777. The average of different riders riding one horse were 1.7 and the percentage of horses that were ridden by different riders was 39.8%. Also, the average number of riders who rode different horses was 2.1 and the percentage of riders who rode at least two different horses was 44.1%.
The rider–horse interaction known as ‘match’ effect involves the relationship, communication and co-operation between rider and horse. This is influenced by the level of experience and behavior of both rider and horse. This is arrived at by combining the rider–horse pair and measure the different behavior of a horse with specific rider. This effect can be disentangled because one rider rides different horses and vice versa. Match had an average of 2.5 records across 1651 levels.
Pedigree information for genetic evaluation totaled 8733 animals: 47% Arabian horses, 21% Thoroughbred, 15% Spanish Purebred, 10% Anglo-Arabian, 2% Spanish Sport Horse and 5% other breeds. The mean of equivalent complete generations was 7.5 for Arabian, 3.5 Thoroughbred, 6.1 Anglo-Arabian and 3.9 Spanish Sport Horse participants. This parameter was computed with ENDOG 4.8 (Gutiérrez and Goyache, Reference Gutiérrez and Goyache2005).
Methods
Models
The genetic model included the following systematic effects: gender (three classes: male, female and gelding), age (10 classes: first are horses of 5 to 6 years, next classes from 2 to 9 are horses from 7 to 14 years old, respectively, and tenth are horses >14 years) and race (581 classes). The race includes, among other things, the level of difficulty of the event. The random effects were: rider, match, permanent environmental, animal genetic and residual. The model to be solved for a hypothetical trait considering all of the possible random effects was:
 $$\eqalignno{&{\bf y}{\,\equals\,}{\bf Xb}{\plus}{\bf Zu}{\plus}{\bf Wp}{\plus}{\bf Qr}{\plus}{\bf Nm}{\plus}{\bf e}\, \cr \left( {\matrix{ u \cr p \cr r \cr m \cr e \cr } } \right)\,\sim\,N\left( {\left[ {\matrix{ 0 \cr 0 \cr 0 \cr 0 \cr 0 \cr } } \right]} \right.,\left. {\left[ {\matrix{ {A\sigma _{u}^{2} } & 0 & 0 & 0 & 0 \cr 0 & {I\sigma _{p}^{2} } & 0 & 0 & 0 \cr 0 & 0 & {I\sigma _{r}^{2} } & 0 & 0 \cr 0 & 0 & 0 & {I\sigma _{m}^{2} } & 0 \cr 0 & 0 & 0 & 0 & {I\sigma _{e}^{2} } \cr } } \right]} \right)$$
where y is the vector of observations containing the trait rank at finish, X the incidence matrix of systematic effects, Z the incidence matrix of animal genetic effects, W the incidence matrix of permanent environmental effects, Q the incidence matrix of the rider effects, N the incidence matrix of match effects, b the vector of systematic effects, u the vector of direct animal genetic effects, p the vector of permanent environmental effects, r the vector of rider effects, m the vector of match effects, e the vector of residuals.
Eight different models were tested that included different random effects. Model A did not include any random effects besides the animal and residual effects, model R additionally included the rider effect, M the match effect, P the permanent environmental effect, RP the rider and permanent environmental effects, MP the match effect and the permanent environmental effect, RM the rider and match effects, RMP the rider, match and permanent environmental effects.
The genetic models were performed using three approaches:
-
1. A Thurstonian model suggested by Gianola and Simianer (Reference Gianola and Simianer2006): this model assumed an underlying variable that is transformed into the ranking in the competition and makes it possible to include and evaluate the competitive level of horses in races. The model for this underlying variable (l) was:
 $${\bf l {\,\equals\,}Xb{\plus}Zu{\plus}Wp{\plus}Qr{\plus}Nm{\plus}e}$$
and the joint posterior density was:
where T is the matrix of indicator sets ( T k ) that denotes the order of liabilities, or ranking, observed in competition k and δ={δ jk } vector of indicator variables that takes 1 or 0 depending on the presence of the j observation on the k competition. Further, K is the number of matches and J the number of observations. The earlier distributions for the variance components were assumed uniform between appropriate bounds.
$$\eqalignno{ & p\left( {\left. {{\bf l},{\bf b},{\bf u},{\bf p},{\bf r},{\bf m},\sigma _{u}^{2} ,\sigma _{p}^{2} ,\sigma _{r}^{2} ,\sigma _{m}^{2} } \right|{\bf T},\delta } \right)\cr & \propto\prod\limits_{k{\,\equals\,}1}^K {\left\{ {\prod\limits_{j{\,\equals\,}1}^J {\left[ {N\left( {\left. {l_{{jk}} } \right|\mu _{{jk}} ,1} \right)} \right]} ^{{\delta _{{jk}} }} T_{k} } \right\}} \cr & N\left( {\left. {\bf u} \right|{\bf 0},{\bf A}\sigma _{u}^{2} } \right)N\left( {\left. {\bf p} \right|{\bf 0},{\bf I}\sigma _{p}^{2} } \right)N\left( {\left. {\bf r} \right|{\bf 0},{\bf I}\sigma _{r}^{2} } \right)\cr & N\left( {\left. {\bf m} \right|{\bf 0},{\bf I}\sigma _{m}^{2} } \right)p\left( {\sigma _{u}^{2} } \right)p\left( {\sigma _{p}^{2} } \right)p\left( {\sigma _{r}^{2} } \right)p\left( {\sigma _{m}^{2} } \right) $$
The analysis was performed using a Gibbs sampler with a data augmentation approach for the liabilities. Given the liabilities, the conditional sampling of each level of u, r, m and p was univariate Gaussian and the conditional distribution of
$$\sigma _{u}^{2} ,\sigma _{r}^{2} ,\sigma _{m}^{2} \,{\rm and}\,\sigma _{p}^{2} $$
was univariate inverted χ
2. Thus, the key step for the implementation was the conditional sampling of liabilities from the predictive distributions. The conditional predictive distributions for the liabilities of competition k are proportional to:where ELSE denotes the unknown liabilities at all other competition events and systematic, additive genetic, RMP horse effects; thus, within event k, the liabilities are not independent, because the sample space is restricted by the knowledge of the ranking, represented by T k . The conditional sampling of liabilities is performed sequentially. The liability of the rank at finish position one was set to 0. The next one was calculated as:
$$p\left( {l_{k} \left| {{\rm ELSE}} \right.} \right)\infty\prod\limits_{j{\,\equals\,}1}^j {\left[ {N\left( {l_{{jk}} \left| {\mu _{{jk}} ,1} \right.} \right)} \right]^{{\delta _{{jk}} }} } T_{k} $$
$${\mathop{\rm l}\nolimits} _{{nk}} \,\sim\,TN_{{\left( {l_{{n{\minus}1(k)}} ,\,l_{{n{\plus}1(k)}} } \right)}} \left( {\mu _{{nk}} ,1} \right)$$
With nk the competing horse n in competition k; n−1 is the competing horse in the previous position of ranking than n horse and n+1 the horse with the next position of ranking. The performance of the excluded horses is assumed to be worse than the last classified horse.
-
2. Threshold model (Gianola, Reference Gianola1982; Gianola and Foulley, Reference Gianola and Foulley1983; Sorensen and Gianola, Reference Sorensen and Gianola2002): under this model, it is assumed that an underlying non-observable variable exists, defining the different categories of the categorical trait if this underlying variable exceeds a particular threshold value. Eight categories were defined, with the excluded horses in the eighth category, seven or higher ranking the seventh category and the other (1 to 6) categories corresponding to the rank value.
-
3. Linear model: assuming that the analyzed trait was a continuous variable with normal distribution and using the raw ranks obtained per horse in each race. The excluded horses in the race were included after the last position at +1 additional position within races.


In linear and threshold models, the analyses were carried out with TM software (Legarra et al., Reference Legarra, Varona and Lopez de Maturana2008). Total Gibbs chain lengths of 1 000 000 samples for each analysis were defined, with a burn-in period of 100 000 and a thinning interval of 100. Thurstonian models were solved using software developed by the authors (Gómez et al., Reference Gómez, Varona, Molina and Valera2011).
Cross-validation
A cross-validation approach was used to evaluate the prediction ability (Efron and Tibshirani, Reference Efron and Tibshirani1993) of different models. For each genetic model, the entire data set was randomly split into a training data set containing 3060 records (75%) to estimate the parameters and solve each model, and a validation data set with 1005 records (25%). Performances of the validation data set were reconstructed using the solutions for the model effects previously obtained with the training data sets. To compare real and predicted performances of the validation set, the Pearson’s correlations (ρ) between real and predicted ranking performances were calculated. In total, 20 different random replicates of this procedure were carried out, and the Pearson’s correlations were averaged across replicates as a measure of the predictive ability of each model.
Breeding value analysis
The breeding values of horses for ranking trait were predicted with the best model of each approach regarding cross-validation procedure above. To evaluate the possible changes in the genetic ranking of individuals according to their breeding values, the Pearson’s and Spearman’s correlations between breeding values, predicted with the best models inside approaches, were calculated for all animals in the pedigree, with top 20% and top 5% of animals according to genetic ranking.
Results
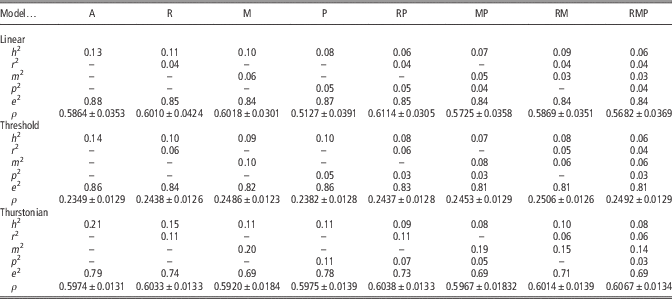
Table 2 shows the heritabilities, proportion of total phenotypic variance attributed to rider, match and environmental permanent effects (ratios), and the averages of correlations between real and predicted performances for each model and approach. The heritability of the trait had from low to medium magnitude across models and approaches, as expected for a categorical trait. The range of heritability values were similar for linear and threshold models, between 0.06 to 0.13 and 0.06 to 0.14, respectively, whereas Thurstonian model values were higher and ranged between 0.08 and 0.21. The highest heritability across models was obtained using the model without random effects (beside animal and residual), followed by models with one additional random effect in all approaches. The RMP model that included all the identified random effects had the lowest heritability.
Heritabilities (h 2), rider effect ratio (r 2), match effect ratio (m 2), environmental permanent effect ratio (p 2), residual ratio (e 2) and average of correlations between real and predicted performances (ρ) and their standard deviation for different approaches (linear, threshold and Thurstonian) and models (A to RMP)

A=no additional random effects; R=rider effect; M=match effect; P=permanent environmental effect; RP=rider and permanent environmental effects; MP=match effect and the permanent environmental effect; RM=rider and match effects; RMP=rider, match and permanent environmental effects.
Regarding the importance of random effects, the permanent environmental effect ratio ranged between 0.03 and 0.05 in linear and threshold models and this range was higher for Thurstonian models (0.03 to 0.11). The rider effect had the similar trend, obtaining values of 0.04 in linear models, the range was higher in threshold models (0.04 to 0.06), and the largest values for this effect were obtained in Thurstonian models (0.06 to 0.11). The highest estimated value for random effects was the match across models, which was greater than heritabilities in threshold and Thurstonian models; its value ranged from 0.14 to 0.20 for Thurstonian models, from 0.06 to 0.10 in threshold models and from 0.03 to 0.06 in linear models. The Thurstonian approach had the highest ratios for all random effects and lower residual ratio (Table 2).
As for model predictability, the average correlations between real and predicted performances in threshold models were lower (0.24 to 0.25) than in linear (0.51 to 0.61) and Thurstonian models (0.59 to 0.61) (Table 2). The correlations showed low variability within an approach but the differences were observed among approaches. Despite the differences between models within approaches were small, it was possible to find higher correlations in models which included the rider and permanent effect (RP) within a linear approach. Regarding the Thurstonian approach the best model was that which included the RMP effect. Finally, for the threshold approach it was RM. Note that despite non-significant differences were found between models within approaches, we chose the model with the highest correlation. The lowest correlations in the cross-validation were found for models that did not include rider random effect. Model P in particular had lower correlation values in linear models.
Table 3 shows the Pearson’s and Spearman’s correlations (above and below the diagonal, respectively) among predicted breeding values obtained with the three best models within each approach (RP for linear, RM for threshold and RMP for Thurstonian approaches) for all animals, top 20% in the genetic ranking and top 5%. Note that the negative values obtained when comparing Thurstonian with both threshold and linear models were because of the opposite definitions of the trait in Thurstonian models: the lower the rank in the race, the best its performance. Therefore, the values through text are presented in absolute values. The highest Pearson’s correlation was found between threshold and Thurstonian approaches in all cases. They were 0.90, 0.91 and 0.88 for all animals, top 20% and top 5% best animals, respectively. The lowest Pearson’s correlations were between threshold-linear pair: with all animals (0.75), top 20% (0.70) and top 5% (0.58). Regarding Spearman’s correlation a similar trend was observed. The best percentage of coincidence was between Thurstonian and threshold with all animals (0.85), top 20% (0.84) and top 5% (0.86), and the worst values with the linear-threshold pair (0.65, 0.62 and 0.51). In all cases, the Thurstonian model had more in common with the threshold model than with linear models. In order to compare the same model for the three approaches, Table 3 was also computed with the RMP model across approaches and the magnitude of correlations was similar; there was no changes in the conclusion.
Pearson’s and Spearman’s correlations coefficientsFootnote 1 between model RP linear (Lin) and models RM for threshold (Thr) and RMP for Thurstonian (Thu) approaches (with all animals, 20% top and 5% top animals) breeding values for ranking trait

RP=rider and permanent environmental effects; RM=rider and match effects; RMP=rider, match and permanent environmental effects.
1 Pearson above and Spearman below of the diagonal.
Discussion
Ranking allows a horse entering an event to be compared with the other horses. However, the level of the event has to be determined first (Tavernier, Reference Tavernier1991). The estimation of race level has always been an important issue in horse breeding programs. Several models were fitted to deal with this requirement, such as the Tobit model (Bayesian model with data augmentation). Bugislaus et al. (Reference Bugislaus, Stamer and Reinsch2011) concluded that Trotters without earnings did not show their real racing potential and should be regarded as censored observations. In their study, the Tobit model and Threshold models with censored race results were shown to be very suitable for genetic evaluation. However, they are useful to include in the genetic evaluation of individuals without data, but they are not able to account for the competition level of the race. Here we use a Thurstonian approach that implies the assumption of a continuous underlying variable that represents the racing performance of the horse. This underlying variable is restricted by the ranking position of horses within a race, but as horses perform in several races, it takes into account the ranking at the same time that the competition level of the races. Thurstonian models are able to predict breeding values according to their racing abilities in more detail since the same horses are not ranked in each race.
In cross-validation analysis, the Thurstonian models had the highest prediction ability for ranking trait in endurance horses with an average across models of 0.60. Although the connection between races by related animals could partially separate the genetic component and estimate a breeding value independent of the level of the race, only in Thurstonian models does the prediction of a horse breeding value take into account the influence of the level of the other horses participating in the same race. This seems to be a better fit. Thus, an additional participating horse ranked before would not imply moving backward an extra position of the horse (linear) nor moving the animal to the next category (threshold). The Thurstonian approach just assesses an intermediate liability for the extra participant without modifying the position of the rest of participants.
Correlations between expected and predicted values for ranking trait were also high for the linear approach (0.58) models, but they were lower for the threshold approach of around 0.25. Although there were no significant differences, the models with highest correlations were the RP among the linear approach, RM for threshold and RMP for Thurstonian approach. The low predictability of the threshold approach showed the difficulty to establish the number of thresholds that could explain the real data. The threshold approach assumes the presence of an underlying normal distribution. A threshold demonstrates the discontinuity in the visible scale, but some categories included several categories of rankings in order not to increase the number of thresholds. Note that by increasing the number of participants in one race, it also increases the number of animals in the seventh category. Many of these horses could have performed at a lower rank in races with a lower number of participants. From a different perspective, the sixth category is the last in a race with six participants, but this result is in the top 20% in a race with 40 participants. This would increase the unexplained phenotypic variance. With reference to the linear approach, despite the correlation being similar including one or more additional random effects (environmental permanent effect, rider and match effect), the predictability of the linear approach seems to be more affected by the inclusion or not of random effects. In this approach the inclusion of rider effect and environmental permanent effect gave the best results. In fact the inclusion of just rider or match gave very similar results. On the other hand the inclusion of match effect with any of the other two effects decreased the predictability, and the inclusion of only environmental permanent effect gave the lowest correlation in the linear approach. Therefore, the rider/match effect seemed to be important to include (Kearsley et al., Reference Kearsley, Woolliams, Coffey and Brotherstone2008; Bartolomé et al., Reference Bartolomé, Menéndez‐Buxadera, Valera, Cervantes and Molina2013; Sánchez-Guerrero et al., Reference Sánchez-Guerrero, Cervantes, Valera and Gutiérrez2014). Nevertheless, the linear and Thurstonian models gave a high predictability as in the trot at hand in dressage, accumulated points in show jumping traits for Swedish horses (Viklund et al., Reference Viklund, Braam, Näsholm, Strandberg and Philipsson2010) or for racing performance of Norwegian and North Swedish Coldblooded trotters (Olsen et al., Reference Olsen, Klemetsdal, Ødegård and Árnason2012). Otherwise the predictabilities were lower than in previous cross-validation studies for dressage and show jumping (Rovere et al., Reference Rovere, Ducro, van Arendonk, Norberg and Madsen2016), for dressage scores in Spanish trotter horses (Sánchez-Guerrero et al., Reference Sánchez-Guerrero, Cervantes, Valera and Gutiérrez2014), and for racing time in German trotters (Bugislaus et al., Reference Bugislaus, Roehe and Kalm2005). These differences might be explained by a different data structure in which the relevance of the systematic effects on the phenotype became more or less high and by a larger number of records per horse (Sánchez-Guerrero et al., Reference Sánchez-Guerrero, Cervantes, Valera and Gutiérrez2014), with an average of 7.2, whereas in the present study the average number of records per horse was 4.2. As for other random effects the average number of records per match level was 5.7 (Sánchez-Guerrero et al., Reference Sánchez-Guerrero, Cervantes, Valera and Gutiérrez2014) and 2.5 in the present study. The average for different riders for one horse was around 2 as in this study, but the average for different horses ridden by one rider was lower (1.3) in the study by Sánchez-Guerrero et al. (Reference Sánchez-Guerrero, Cervantes, Valera and Gutiérrez2014) than in this endurance data set.
Heritability in general was higher in Thurstonian models (0.08 to 0.21) than in linear (0.06 to 0.13) or threshold models (0.06 to 0.14), as in a recent study for ranking trait in Thoroughbred horses, with 0.05 to 0.29 for Thurstonian and 0.03 to 0.23 for linear models (da Gama et al., Reference da Gama, Aspilcueta Borquis, de Araújo Neto, de Oliveira, Fernandes and da Mota2016). Estimated heritabilities for models with more random effects in the present study were in the range found in the literature for ranking traits (transformed or not) in other disciplines: Blom-scores ranking transformation for jumping Belgian sport horses (0.09; Janssens et al., Reference Janssens, Geysen and Vandepitte1997), rank at finish German trotters horses (0.08; Roehe et al., Reference Roehe, Savas, Brka, Willms and Kalm2001), the square roots of rank at finish in Thoroughbred horses (0.18; Sobczynska and Lukaszewicz, Reference Sobczynska and Lukaszewicz2004), probit function transformation of ranking for Thoroughbred horses in France and United Kingdom (0.18 and 0.06; Bokor et al., Reference Bokor, Blouin, Langlois and Stefler2005), square root rank at finish German trotters horses (0.06; Bugislaus et al., Reference Bugislaus, Roehe and Kalm2005), ranking Arabian horses (0.07; Ekiz and Kocak, Reference Ekiz and Kocak2005) and ranking Spanish trotters horses (0.09; Gómez et al., Reference Gómez, Varona, Molina and Valera2011). The lowest values were similar to those reported by Gómez et al. (Reference Gómez, Varona, Molina and Valera2011; 0.09 and 0.05 for Thurstonian and linear approaches, respectively). Compared with studies for endurance but using different traits, the resulting heritability was similar as placing (0.10), but lower than speed (around 0.20) (Ricard and Touvais, Reference Ricard and Touvais2007). The heritabilities were overestimated when the additional random effects were not included: i.e. rider, match and environmental permanent effect, which was also observed by Sánchez-Guerrero et al. (Reference Sánchez-Guerrero, Cervantes, Valera and Gutiérrez2014).
The use of a high predictability model could increase the genetic response. The reliability of breeding values is directly affected by the heritability values. Here higher values where found using Thurstonian models. Also the genetic progress could be faster if heritability and correlation between real and predicted breeding value is high. In the Bayesian analysis, the breeding values reliabilities can be computed using the standard deviation of posterior distribution. The average of reliabilities for participants were ranged between 0.15 (Thurstonian) and 0.17 (threshold) across approached, with no important differences. Note that the data set was too small to obtain high breeding value reliabilities. Models improving the accuracy will give a better response to selection as it is proportional to the accuracy. As correlations between breeding values was high genetic progress seems to be warranted whatever is the most real model.
The match effect was greater than rider or permanent effect in all approaches, note that the match effect includes the rider effect when this was not present in models M and MP. This reflects the importance of interaction rider–horse effect in models for ranking trait in endurance races. However, for final score of dressage Spanish horses, the rider effect had a higher ratio than the match effect (Sánchez-Guerrero et al., Reference Sánchez-Guerrero, Cervantes, Valera and Gutiérrez2014). Concerning the environmental permanent effect, the rider ratio effect was greater than the environmental permanent ratio in the Thurstonian approach for the RP model, but lower in the linear approach. A similar trend occurred in Gómez et al. (Reference Gómez, Varona, Molina and Valera2011), where the trainer–driver variance was observed to be greater than environmental permanent ratio in the Thurstonian approach for the RP model but lower in linear approach. Although a direct comparison cannot be done because of the different methodology, this also occurred for working on traits from show jumping in Spanish Sport horses using random regression model: environmental permanent effect ratio had the biggest ratio followed by the match ratio and the rider ratio (Bartolomé et al., Reference Bartolomé, Menéndez‐Buxadera, Valera, Cervantes and Molina2013). On the other hand, driver component, was lower than environmental permanent effect in German trotters (Roehe et al., Reference Roehe, Savas, Brka, Willms and Kalm2001) using a linear model. Unlike the rider effect, the environmental permanent and animal effects are usually confounded.
Summarizing, models were similar within approach, but the differences across approaches were meaningful. The best predictability was obtained by Thurstonian models followed by linear models and the threshold model had the worst predictability. The heritability magnitude in Thurstonian models had the highest values with linear and threshold approaches very similar. And finally, regarding the correlation between predicted breeding values the threshold approaches had higher correlations with the Thurstonian approaches than with the linear approaches. Given, therefore, that this last criterion, the correlation between predicted breeding values, is the least powerful (the true model is unknown), it makes not recommendable using threshold models. The predictability criteria favored the Thurstonian approach over the linear approach because of the variability of correlations between the real data set and the resulting data set after reconstructing the real data set in the linear approach. Consequently, the Thurstonian approach can be recommended for routine genetic evaluation instead of the linear or threshold models. Nevertheless, the Pearson’s and Spearman’s correlation between predicted breeding values using best models for each threshold and Thurstonian approaches were high, suggesting that in the absence of both possibilities (Thurstonian and linear approaches) the threshold approach would not reach such incongruent predicted breeding values, despite the predictability being very low.
Conclusions
The results of the present study encourage the application of the Thurstonian approach for genetic evaluations for the ranking of endurance horses. The Thurstonian approach is the best by accommodating the number of participants and the level of the race, and, therefore, reaching more accurate predictions for breeding values in this trait for this population. Despite the threshold cross-validation predictability was lower, the threshold–Thurstonian predicted breeding value correlations were higher than linear–Thurstonian. The match effect for ranking trait should be included in endurance horse models since it had the largest ratio thus making it more important than heritabilities in the threshold and Thurstonian models.
Acknowledgments
The authors thank the Spanish Arabian Horse Breeder Association and to the ‘Subsecretaría de Agricultura, Alimentación y Medio Ambiente’ of the Spanish Ministry of Agriculture, Food and the Environment for their support. Also authors are grateful to the Spanish Royal Equestrian Federation for providing the data.