INTRODUCTION
Tea is one of the most important beverage crops in the world. It is a small tree, which can grow up to a height of 10–15 m under natural conditions. However, commercially grown tea is pruned and maintained at a height convenient for harvesting of young tea shoots. While a flat canopy surface (known as the ‘plucking table’) is maintained in many tea-growing regions of the world (e.g. Kenya, Tanzania, India and Sri Lanka), a curved canopy surface is maintained in others (e.g. Japan, Australia) (Willson, Reference Willson, Willson and Clifford1992). Irrespective of the pruning height and the shape of the pruned canopy surface, the objective of pruning is to rejuvenate the bush by removing excess non-photosynthetic tissue above a certain height (Kulasegaram, Reference Kulasegaram, Sivapalan, Kulasegaram and Kathiravetpillai1986). The pruning height may vary in different tea-growing regions of the world, depending on the required intensity of pruning, as determined mainly by climatic conditions and recovery time, and the method of pruning (i.e. whether manual or by machine) as determined primarily by the availability of labour and cost-effectiveness (Anon., 1986; Burgess et al., Reference Burgess, Carr, Mizambwa, Nixon, Lugusi and Kimambo2006; Grice et al., Reference Grice, Malenga and Mkwaila1984; Kandiah and Wimaladharama, Reference Kandiah and Wimaladharma1980; Kaptich, Reference Kaptich1985; Willson, Reference Willson, Willson and Clifford1992). Pruning involves the removal of a significant proportion of branches along with almost all the foliage. It leaves only the main trunk and a few primary branches, sometimes along with one small branch with foliage (sometimes called a ‘lung’) to provide the photosynthates necessary for the initial regrowth after pruning (Nagarajah and Pethiyagoda, Reference Nagarajah and Pethiyagoda1965). The frequency of pruning (called the ‘pruning cycle’) varies from 1 to 6 years (Willson, Reference Willson, Willson and Clifford1992), again depending on a variety of factors which are often linked to those determining the height and intensity of pruning as mentioned above. In Sri Lanka, pruning of tea growing at higher elevations (i.e. greater than 900 m asl) is usually carried out in a four-year cycle. At elevations above 2000 m, the pruning cycle can be extended to 5–6 years (Kulasegaram, Reference Kulasegaram, Sivapalan, Kulasegaram and Kathiravetpillai1986). In Kenya, where the conventional pruning method is a straight cut-across at a height of 40–45 cm, the pruning cycle varies from three to four years (Magambo and Waithaka, Reference Magambo and Waithaka1985). Pruning cycles in machine-harvested tea in Southern Tanzania extend up to seven years or longer (Burgess et al., Reference Burgess, Carr, Mizambwa, Nixon, Lugusi and Kimambo2006). Post-pruning regrowth usually enables resumption of harvesting shoots in about 6–8 months.
Tea yield, measured as the weight of harvested tender shoots with 2–4 leaves plus a bud, shows substantial variation during the course of a pruning cycle. This is only understandable when the drastic reduction in vegetative biomass at pruning and the subsequent post-pruning regrowth is considered. It is highly likely that physiological changes brought about by pruning and post-pruning regrowth (Bore et al., Reference Bore, Isutsa, Itulya and Ng'etich2003; Kandiah, Reference Kandiah1971; Reference Kandiah1975; Kandiah and Wimaladharma, Reference Kandiah and Wimaladharma1978; Manivel, Reference Manivel1980; Nagarajah and Pethiyagoda, Reference Nagarajah and Pethiyagoda1965; Selvendran, Reference Selvendran1970; Tubbs, Reference Tubbs1937) necessitate alteration and adjustment of biomass partitioning at different stages of the pruning cycle and thereby cause variation in yield. In a four-year pruning cycle, yield usually shows an increasing trend during the first three years of the pruning cycle, with the magnitude and rate of increase varying depending on the cultivar, and environmental and management factors. This is followed by a significant, and sometimes drastic, yield reduction during the fourth year of the pruning cycle in many plantations in Sri Lanka (Jayakody, Reference Jayakody1995). Similar yield reductions in the fourth year of the pruning cycle have been observed in Kenya (Bore et al., Reference Bore, Isutsa, Itulya and Ng'etich2003; Magambo and Waithaka, Reference Magambo and Waithaka1985) and Tanzania (Burgess et al., Reference Burgess, Carr, Mizambwa, Nixon, Lugusi and Kimambo2006). Although seasonal variation of tea yields depending on temperature and rainfall have been reported from Malawi (Fordham and Palmer-Jones, Reference Fordham and Palmer-Jones1977), Tanzania (Burgess and Carr, Reference Burgess and Carr1996a) and Kenya (Ng'Etich et al., Reference Ng'Etich, Stephens and Othieno2001), there have been hardly any detailed investigation of tea yield variation during different stages of the pruning cycle. Therefore, the primary objective of this paper is to investigate and elucidate the possible causes of this significant yield reduction in tea during the final year of the pruning cycle.
Shifts in biomass partitioning during the course of the pruning cycle is one possible reason for the observed yield variation and the significant yield decline during the fourth year. During pruning, a substantial reduction of the above-ground biomass occurs. Although there could be a feedback reduction of the root biomass as well (van Noordwijk et al., Reference van Noordwijk, Lawson, Soumaré, Groot, Hairiah, Ong and Huxley1996), a significant shift in biomass partitioning towards the above-ground parts could be expected during the first year of the pruning cycle. However, there is scant information about how this possible shift in biomass partitioning proceeds during the rest of the pruning cycle. Magambo and Waithaka (Reference Magambo and Waithaka1985) observed that post-pruning biomass partitioning varied with the pruning height, with shoot:root ratio being smaller at lower pruning heights even 36 months after pruning. They further argued that the increased proportion of root biomass following pruning meant that biomass partitioning to the root system could increase because of the greater sink strength of large roots. Several authors (Burgess and Carr, Reference Burgess and Carr1996b; Magambo and Cannell, Reference Magambo and Cannell1981; Magambo and Waithaka, Reference Magambo and Waithaka1985; Ng'Etich and Stephens, Reference Ng'Etich and Stephens2001) have reported on biomass partitioning of the tea bush to roots, stems and leaves. However, apart from the work of Magambo and Waithaka (Reference Magambo and Waithaka1985), which is on 15-year-old tea, the rest were on young tea during the first 1–3 years after planting. In view of the fact that the economic life span of a tea bush is longer than 40 years, it is highly probable that biomass partitioning patterns of older mature tea would be different from those of young tea. Hence, a detailed investigation of biomass partitioning was carried out on 34-year-old mature tea plants in the present study.
Pruning and post-pruning regrowth are likely to cause significant variation in the assimilate production capacity of the tea bush as well, which could also be a possible cause of yield variation within a pruning cycle. Variation of both assimilate supply and partitioning during a pruning cycle could influence the two principal yield components of tea, i.e. the number of shoots per unit land area (Nsh) and the mean individual shoot weight (Wsh), and thereby cause yield variation. Nsh is determined by the rate of shoot initiation (Carr and Stephens, Reference Carr, Stephens, Willson and Clifford1992; Wijeratne, Reference Wijeratne1994). Although it is primarily controlled by prevailing air temperatures and thermal durations (Stephens and Carr, Reference Stephens and Carr1990; Tanton, Reference Tanton1982; Wijeratne, Reference Wijeratne2001), there is a possibility that biomass partitioning to above-ground structures of the bush (especially, tertiary branches and maintenance foliage) may have a feed-forward influence on shoot initiation. Biomass production and partitioning have direct influences on the determination of Wsh by determining the supply of assimilates to the initiated tender shoots (De Costa et al., Reference De Costa, Mohotti and Wijeratne2007). Therefore, this paper will investigate the interrelationships between assimilate supply and partitioning, and the source-sink relations involved during different stages of the pruning cycle using two contrasting tea cultivars at their mature stage.
MATERIALS AND METHODS
Experimental site
A field experiment was carried out at St Coombs Estate of the Tea Research Institute of Sri Lanka, Talawakelle, (latitude 6°80′N, longitude 80°40′E; altitude 1382 m asl) during the period from 2000 to 2005. While the pruning treatments commenced in 2000, the measurements were carried out in 2004 and 2005. The experimental location is situated in the agro-ecological zone, known locally as the Up-Country Wet Zone (WU3) (Panabokke, Reference Panabokke1996). Average annual rainfall of the area is about 2250 mm, and annual average minimum and maximum temperatures are 14.2 °C and 22.8 °C respectively. The soil, known locally as Red Yellow Podzolic, was a dark yellowish-brown, well-drained Ultisol (Great Group – Rhodudults) (Panabokke, Reference Panabokke1996), classified as Haplic Alisol by FAO/UNESCO and Typic Hapludult by USDA (Dassanayake and Hettiarachchi, Reference Dassanayake, Hettiarachchi, Mapa, Somasiri and Nagarajah1999). The texture was sandy clay loam (40% sand, 25% silt and 35% clay) on the surface and loam to clay in the sub-soil. The structure was weak sub-angular blocky at the surface and moderate sub-angular blocky in the sub-soil. The bulk density ranged from 0.85 × 10³ to 1.50 × 10³ kg m−3, and top and sub-soil pH from 4.5 to 4.8 and 4.9 to 5.2 respectively. Average soil nutrient contents at the beginning of the experiment were: total nitrogen – 270 g 100 g−1 soil, available phosphorus – 25.8 ppm, ammonium chloride-exchangeable potassium – 0.215 ppm and organic matter – 5.10 g 100 g−1 soil.
Experimental material, treatments and design
Two cultivars, viz TRI 2025 and DT1, with different physiological and morphological attributes were used. TRI 2025 is a cultivar developed in Sri Lanka, but derived from seed of a single mother tree ASM 4/10 in Tocklai, India. DT1 is an Estate (Drayton Estate) Selection of unknown origin. Both cultivars were established in fields number 4 and 5 of the St Coombs Estate in 1970. Mature tea fields of the cultivars TRI 2025 and DT1 were situated within 500 m so that the climate over both fields was the same.
The experimental treatment structure was a two-factor factorial with two cultivars and four different stages of the pruning cycle (i.e. 1, 2, 3 and 4 years after pruning) as the main effects. The experimental design was a split-plot design with cultivars as the main plot factor and different years of the pruning cycle as the sub-plot factor. There were five replicates. Prior to the commencement of the present study, plots allocated to different stages of the pruning cycle were pruned by cutting-across at a height of 0.45 m in successive years until the four stages after pruning were obtained. Therefore, the plots which were designated to be in the first year of the pruning cycle in 2004 were pruned in 2003. Likewise, plots which were to be in the second, third and fourth years of the pruning cycle were pruned in 2002, 2001 and 2000 respectively. Three plants from each cultivar were excavated immediately after pruning to measure the total plant biomass at the beginning of the pruning cycle. Pruned bushes were tipped at 55 cm before the commencement of harvesting operations. Individual plot size was 40 m2 and consisted of 50 plants surrounded by a guard row.
Crop management
Each plot received the VP910 mixture (ammonium sulphate:ammmonium phosphate:potassium sulphate:magnesium sulphate at 1:2:1:1 ratio) in four equal splits as recommended by the Tea Research Institute of Sri Lanka. The fertilizer was applied on the inter-row spacing by broadcasting. Zinc sulphate was sprayed after each round of fertilizer application. At the end of each pruning cycle, the soil pH in each plot was measured and based on the pH, dolomite was applied. Once in three months, weeds were controlled either manually or chemically by spraying glyphosate.
Measurements
Leaf yield: One to four immature leaves and the terminal bud were harvested at weekly intervals and green leaf weight was recorded. Harvesting was carried out under supervision using the same set of pluckers ensuring that all pluckable shoots were harvested even during the fourth year of the pruning cycle. A sub-sample of 50 g was oven-dried at 85 °C overnight to determine the fresh weight to dry weight ratio. Another sub-sample of 100 g was separated into active and dormant shoots and their numbers were recorded. Shoot numbers per m2 were calculated by extrapolating the sub-sample values to the total harvest from each plot and then dividing by the plot area. Another sub-sample of harvested shoot were separated into shoots with different levels of maturity as: one leaf plus an active bud (1L+A); two leaves plus an active bud (2L+A); three leaves plus an active bud (3L+A); four leaves plus an active bud (4L+A); one leaf plus a banji (dormant) bud (1L+B); two leaves plus a banji bud (2L+B); three leaf plus a banji bud (3L+B) and four leaves plus a banji bud (4L+B). The dry weight of selected sub-samples of different classes of shoots was measured.
Total plant dry weight and harvest index
Five plants from each cultivar × year treatment combination were excavated and separated into different parts as flush, mature leaves, branches and roots. Harvest index (HI) was calculated as the ratio between the harvested leaf dry weight in a given year and the increase in total dry weight during the same year.
Leaf area index and leaf fall
Canopy leaf area index (LAI) was measured by using the Sunfleck Ceptometer (Accu PAR, Decagon Devices Inc., Washington, USA). This instrument estimates LAI by directly measuring the fraction of photosynthetically active radiation (PAR) penetrating the different canopy depths. The measurements were taken at four-month intervals on clear days. Weights of the fallen leaves were measured by surrounding individual bushes with plastic netting stretching from the ground up to the plucking surface level, so that all the leaves which fell off from the bush could be trapped within the enclosure. Before the enclosures were put in position, the ground below the sample plants was swept clean. The leaves which fell into the netting enclosures were collected monthly, oven-dried and total dry weights of fallen leaf were recorded.
Physiological measurements
Leaf net photosynthetic rate was measured at saturating light intensities (i.e. > 1000 μmol PAR m−2 s−1) on the youngest fully expanded leaves on the plucking table with a LI-6200 infra-red gas analyser (LICOR Inc., USA). Photosynthesis measurements were done in three replicate mother leaves (i.e. maintenance foliage) in the canopy one month after a fertilizer application. Roots samples of standard diameter (1.6 cm) were taken from each plot at monthly intervals, oven-dried at 80 °C and ground-up. Ground samples were taken for analysis. Starch content was measured by the iodine method (McCready et al., Reference McCready, Guggolz, Silvievre and Owen1950).
Data analysis
Significance of treatment differences were determined by analysis of variance (ANOVA) and means were separated by standard error of means with appropriate degrees of freedom. Linear correlation analysis was used to examine the strength of interrelationships between different variables measured.
RESULTS
Variation of tea yield during different years of the pruning cycle
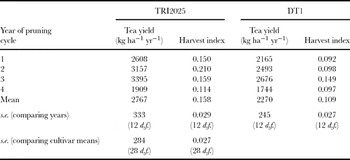
Annual total tea yield and HI showed highly significant variation between different cultivars (p < 0.0001) and years of the pruning cycle (p < 0.0001). However, the cultivar × year interaction effect on yield was not significant at p = 0.05. When the data for the two cultivars were analysed separately, both cultivars showed highly significant variation in yield between different years of the pruning cycle (Table 1). In both cultivars, yield showed continuous increases from year 1 to 3, which was followed by yield reductions of 44% and 35% in TRI2025 and DT1 respectively in the fourth year. When averaged across the four years, TRI 2025 showed a significantly greater yield than DT1. When yields of the four years were analysed separately, TRI 2025 had significantly greater yields than DT1 in years 1, 2 and 3. TRI2025 also had a greater rate of linear increase of yield (394 ± 104 [kg ha−1 yr−1] yr−1, R 2 = 0.52) than DT1 (255 ± 71 [kg ha−1 yr−1] yr−1, R 2 = 0.50) during the first three years of the pruning cycle. On the other hand, during the fourth year, there was no significant (p = 0.05) difference between yields of the two cultivars.
Variation of tea yield and harvest index of two contrasting tea cultivars in different years of the pruning cycle.

Variation of shoot numbers and proportions of active and banji shoots in different years of the pruning cycle
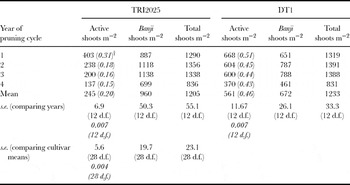
Numbers of active, banji and total shoots per m2 of land area showed highly significant variation (p < 0.0001) in all years of the pruning cycle in both cultivars (Table 2). The cultivar × year interaction was significant (p < 0.0001) for active shoots, but not for banji or the total shoot number. The number of active shoots m−2 (NA) in TRI 2025 showed continuous and significant decreases through the pruning cycle. In contrast, in DT1, NA did not show a substantial decline until the end of year 3. In all four years of the pruning cycle, DT1 had significantly greater NA than TRI 2025. In both cultivars, the number of banji shoots m−2 (NB) increased from year 1 to year 3 and thereafter decreased significantly (p < 0.05) in year 4. In all four years, TRI 2025 had significantly greater numbers of banji shoots than DT1. In both cultivars, the total number of shoots (NA + NB; NTOT) did not differ significantly from the first to third year of the pruning cycle. However, there were significant reductions in the fourth year. NTOT did not differ significantly between the two cultivars in any year. The respective proportions of active and banji shoots out of the total number of shoots showed highly significant (p < 0.0001) variation between the two cultivars and year in the pruning cycle. The proportion of active shoots (PA) in both cultivars showed similar patterns of variation through different years of the pruning cycle (Table 2). PA in the first year was significantly greater than in the subsequent years, which did not differ significantly. Conversely, the proportion of banji shoots (PB) was significantly lower in the first year when compared to rest of the pruning cycle. In TRI 2025, PB was significantly greater than the corresponding PA in all years of the pruning cycle. In contrast, in DT1 the difference between PA and PB was narrower (than for TRI 2025) in all years of the pruning cycle.
Variation of shoot numbers and proportions of active and banji shoots of two contrasting tea cultivars in different years of the pruning cycle.

†Proportion of active shoots (PA) out of total shoots is given in italics. Proportion of banji shoots = 1 – PA.
Variation of mean individual shoot weight of different types of shoot in different years of the pruning cycle
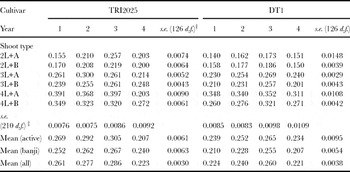
Mean individual shoot weight of TRI 2025 was significantly greater than that of DT1 (Table 3). This was true for both active and banji shoots. In both cultivars, weight per active shoot increased from year 1 to 3. This was followed by significant declines in year 4. The weight per banji shoot also showed a similar pattern through different years of the pruning cycle in both cultivars. When the weights of different shoot types were analysed separately, weights of 2L+A shoots were significantly greater in TRI 2025 than in DT1 in all four years. The corresponding pattern of variations for 3L+A and 4L+A shoots were slightly different. In both 3L+A and 4L+A, TRI 2025 had significantly greater shoot weights during the first two years. During the third year, the differences between the respective shoot weights of the two cultivars were not significant. However, in the fourth year, weights of both 3L+A and 4L+A were significantly greater in DT1 than in TRI 2025.
Variation of mean individual shoot weight of different types of shoots of two contrasting tea cultivars in different years of the pruning cycle.

†For comparison of means of different years in a given cultivar × shoot type combination.
‡For comparison of means of different shoot types in a given cultivar × year combination.
2L+A: two leaves with an active bud; 2L+B: two leaves with a banji bud; 3L+A: three leaves with an active bud; 3L+B: three leaves with a banji bud; 4L+A: four leaves with an active bud; 4L+B: four leaves with a banji bud.
When the weights of different shoot types with banji buds were analysed, TRI 2025 had significantly greater shoot weights for 2L+B and 3L+B shoots in all four years. The weights of 4L+B shoots were also significantly greater in TRI 2025 during the first two years. During the third and fourth years, weights of 4L+B were not significantly different between the two cultivars.
Total biomass and its partitioning to different organs during different years of the pruning cycle
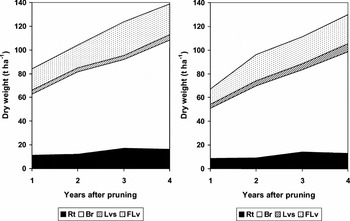
The total dry weight (TDW) of both cultivars showed significant (p < 0.05) increases, when progressing through successive years of the pruning cycle (Figure 1). Linear regressions could be fitted to the yearly increases of TDW in both cultivars (R 2 = 0.87 and 0.93 for TRI 2025 and DT1 respectively). DT1 had a slightly higher rate of dry weight increase (16.66 ± 1.09 t ha−1 yr−1 as compared to 15.05 ± 1.39 t ha−1 yr−1 in TRI 2025). Main stem and branches, which made the highest contribution to TDW, showed the highest dry weight (DW) increase over the pruning cycle, indicating preferential biomass partitioning to build up the branch structure of the bush. In both cultivars root DW, which contributed about 14–16% of the TDW, showed a significant increase from the second to the third year only. Leaf dry weight (LDW), which was nearly zero immediately after pruning, increased up to 3 t ha−1 at the end of the first year. It increased at a slower rate during the subsequent years and made up only 4–6% of the TDW. Interestingly, LDW showed significant (p < 0.05) increases from the third to the fourth year in both cultivars. Measurements of fallen leaves during each year showed that fallen-leaf dry weights (FLDW) were 4–9 times greater than the respective dry weights of intact leaves. This indicated substantial turnover of leaves during a given year. Fallen-leaf dry weights showed significant (p < 0.05) increases from the first to the second year in TRI2025 and from the second to the third year in DT1. While DT1 showed a slight increase of FLDW from the third to the fourth year, TRI2025 showed a slight decline.
Partitioning of biomass of a tea crop to roots (Rt), stem-branch structure (Br), intact leaves (Lvs) and fallen leaves (FLv) during different years of the pruning cycle of a) cultivar TRI2025, b) cultivar DT1. The total standing dry weight at the end of each year after pruning is given by the boundary between intact leaves and fallen leaves. .

Variation of HI during different years of the pruning cycle
Harvest index showed highly significant variation between different cultivars (p < 0.0001) and years of the pruning cycle (p = 0.0006). The cultivar × year interaction effect on HI was also highly significant (p = 0.001). When the data for the two cultivars were analysed separately, both cultivars showed significant (p = 0.0019 and 0.018 for TRI2025 and DT1 respectively) variation in HI between different years of the pruning cycle (Table 1). However, the pattern of variation of HI was different in the two cultivars. In the first two years after pruning, the HI of DT1 remained around 0.09–0.10. It increased significantly up to 0.15 in year 3, which was followed by a 35% decline in year 4. In contrast, the HI of TRI2025 showed a significant increase from 0.15 to 0.21 from year 1 to year 2. This increase was substantially greater than the corresponding increase from 0.09 to 0.10 in DT1 during the same period. As a result, HI values of TRI2025 in the first two years were significantly greater than those of DT1 in the corresponding years. In contrast to DT1, HI of TRI2025 decreased to 0.16 in year 3, which was a 32% decline from year 2. In year 4, HI of TRI2025 continued to decline by a further 28% from the HI of year 3. However, TRI2025 still had a slightly higher HI than DT1 in years 3 and 4 as well.
Variation of LAI and dry weights of mature leaves and fallen leaves during different years of the pruning cycle
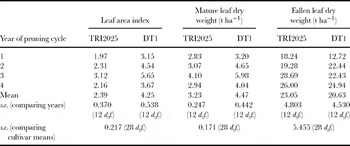
Both LAI and mature leaf dry weight (MLDW) showed highly significant (p < 0.001) variation between cultivars and years of the pruning cycle. However, the cultivar × year interaction was not significant at p = 0.05 for both cultivars. In both cultivars, the two variables showed continuous increases during the first three years (Table 4) followed by significant declines during the fourth year. Both LAI and MLDW were greater in DT1 than TRI2025 during all years of the pruning cycle, with the differences being significant (p < 0.05) in the second and third years. Although both cultivars showed similar variation patterns for the two variables during the pruning cycle, the variations were more prominent in DT1. Fallen-leaf dry weights showed highly significant variation between years (p < 0.001). However, the cultivar effect and the cultivar × year interaction effect were not significant at p = 0.05. When analysed separately, both cultivars showed significant variation between years in their FLDW (Table 4). In TRI2025, FLDW in years 3 and 4 were significantly greater than those in years 1 and 2. In DT1, FLDW in years 2, 3 and 4, which did not differ significantly between themselves, were significantly greater than that in year 1.
Variation of leaf area index and mature leaf dry weight of two contrasting tea cultivars during different years of the pruning cycle.

Correlations between tea yield and different growth and yield parameters
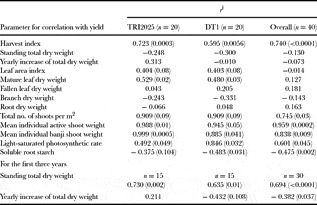
When the data for both cultivars were pooled, tea yields showed significant (p < 0.05) positive correlations with HI, NTOT and the mean individual weights of both active and banji shoots (Table 5). These significant correlations were present when the correlations were performed for the two cultivars separately as well. In contrast, yield was not significantly correlated with standing TDW, yearly increase of total dry weight (INCTDW), LAI, MLDW, branch dry weight (BRDW) and FLDW in the overall data set with both cultivars. However, when the correlations were done for the two cultivars separately, MLDW (p < 0.05) and LAI (p < 0.10) showed significant positive correlations with yield of the respective cultivars. Furthermore, when the correlations were performed for the first three years of the pruning cycle, yield showed highly significant positive correlations with TDW. Yield also showed a significant (p < 0.05) negative correlation with INCTDW when the data from both cultivars were pooled. However, within each cultivar, the correlations between yield and INCTDW were not significant.
Linear correlation coefficients (r) between tea yield and different growth and yield parameters.

† Numbers in parentheses give probability of r being significantly different from zero. Other r values were non-significant.
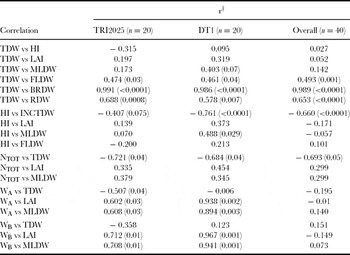
In addition to the above correlations with yield, significant positive and negative correlations were observed between some of the growth and yield parameters (Table 6). As expected, HI showed significant negative correlations with INCTDW while standing TDW showed highly significant positive correlations with BRDW and root dry weight. NTOT showed significant negative correlations with TDW. Mean individual weights of both active and banji shoots were positively correlated with LAI and MLDW for individual cultivars, but not overall.
Linear correlation coefficients (r) between different growth and yield parameters.

†Numbers in parentheses give probability of r being significantly different from zero. Other r values were non-significant.
TDW: standing total dry weight; HI: harvest index; INCTDW: yearly increase of total dry weight; LAI: leaf area index; MLDW: mature leaf dry weight; FLDW: fallen leaf dry weight; BRDW: branch dry weight including the collar and the main stem; RDW: root dry weight; NTOT: total no. of shoots per m2; WA: mean individual active shoot weight; WB: mean individual banji shoot weight.
Light-saturated net photosynthetic rate of mature leaves
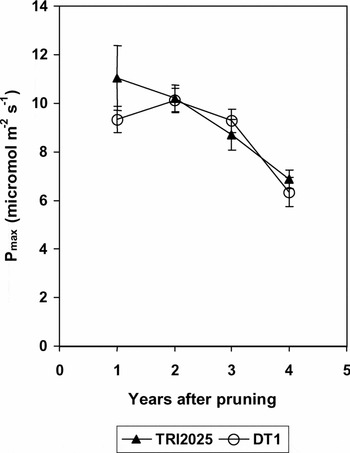
The light-saturated net photosynthetic rate (Pmax) showed a decreasing trend with the progress of the pruning cycle in both cultivars (Figure 2). In TRI 2025, Pmax showed a significant (p < 0.05) decline from the third year onwards while in DT1, such a decline was shown only in the fourth year. Pmax showed significant positive correlations with yield, both overall and for the two cultivars separately (Table 5).
Variation of the light-saturated net photosynthetic rate (Pmax) of mature leaves of two tea cultivars during different years of the pruning cycle. Vertical bars indicate the standard error of mean to compare Pmax values of different years within each cultivar.

Soluble root starch
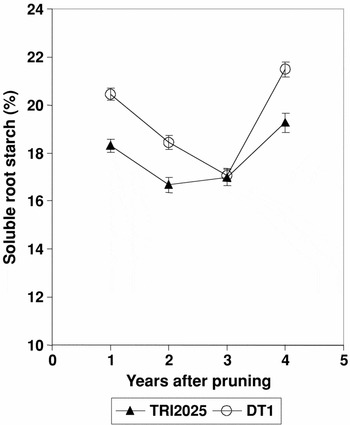
Soluble starch content of 1.6 cm diameter roots showed significant variation between different cultivars and years of the pruning cycle. However, cultivar × year interaction effect was not significant. When averaged across different years of the pruning cycle, DT1 had significantly greater soluble root starch than TRI 2025 (Figure 3). In DT1, soluble root starch content showed a continuous decline from year 1 to year 3 in the pruning cycle. Subsequently, the soluble root starch content increased significantly in the fourth year.
Variation of soluble starch content of 1.6 cm diameter roots of two tea cultivars during different years of the pruning cycle.

TRI 2025 showed a slightly different pattern. Here, the soluble root starch content declined from year 1 to year 2 and then remained approximately unchanged through year 3. Thereafter, soluble root starch content increased significantly in year 4. Soluble root starch content showed significant negative correlations with yield (Table 5), both overall and for the two cultivars separately.
DISCUSSION
The primary objective of this study was to determine the probable causes of the significant yield decline of tea during the fourth year of its pruning cycle (Table 1). Care was taken during the execution of the experiment to eliminate possible variations in plucking that could have caused this yield reduction towards the end of the pruning cycle. By using the same set of pluckers during the whole period of yield measurement, the same plucking standard of 2–4 leaves plus a bud was used in a regular weekly plucking round. Height of the plucking table during the fourth year did not hinder its accessibility to pluckers. At the high altitude of this experimental site, the yearly increases of bush height (i.e. ‘bush creep’) in the four years after pruning were 15, 10, 7.5 and 5 cm respectively, making the final height of the bush 92.5 cm four years after the pruning at 45 cm and tipping at 55 cm. Ergonomic studies carried out by the Tea Research Institute of Sri Lanka have shown that average height of a plucker is 150 cm and that the bush height was below the chest height of a plucker even during the fourth year (Anon., 2001). Therefore, the pluckers were able to reach all pluckable shoots. If the pluckers left more leaf on the bush during the final year due to inaccessibility then MLDW and LAI should have increased during the final year. The observation that both these parameters decreased during the final year provides further evidence that all the pluckable shoots were harvested during the final year as well. Elimination of the above variations in plucking, meant that the observed yield decline was due to processes that were taking place within the tea bush as it progressed through the pruning cycle. These were investigated by a detailed quantification of biomass production and its partitioning to different parts of the tea bush. In addition, the underlying physiological processes responsible for biomass production and yield formation were examined for their possible variation during different years of the pruning cycle, which may be related to the yield decline during the fourth year.
Biomass production and its partitioning to different parts of the bush
Detailed measurements of biomass partitioning in the field showed that TDW of the tea bush increased throughout the pruning cycle in both cultivars (Figure 1). It was the increase of dry weight of the stem and branch structure which made the highest contribution to the increase of total bush dry weight. This indicated preferential biomass partitioning to the stem and branches throughout the pruning cycle. Both at the beginning of the pruning cycle (i.e. immediately following a pruning) and during the course of it, the stem and branches would have the greatest capacity to attract assimilates (i.e. highest sink strength) because of their greater existing biomass as compared to the leaves and roots (Magambo and Waithaka, Reference Magambo and Waithaka1985; Marcelis, Reference Marcelis1996). The substantially higher amount of FLDW in each year (Figure 1) shows that in addition to the stem-branch structure, the foliage canopy also is a strong sink to which a substantial amount of assimilates are partitioned. The observed distribution of total biomass in different parts of the bush in the present study varied from that observed by Magambo and Cannell (Reference Magambo and Cannell1981) for pruned tea bushes. In bushes of the present study, there was a greater percentage of biomass in the stem and branch structure (i.e. 80% as compared to 44% in Magambo and Cannell, Reference Magambo and Cannell1981) and a lower percentage in roots (14–16% as compared to 25%) and leaves (4–6% as compared to 31%). Greater age of tea crops of the present study (i.e. 34 years as compared to 7 years in Magambo and Cannell, Reference Magambo and Cannell1981) probably accounted for the greater biomass percentage in stem and branch structure. These parts undergo least removal during pruning and therefore continue to accumulate biomass through each successive pruning cycle. A similar comparison could be made with the results of Burgess and Carr (Reference Burgess and Carr1996b) for a 1–2-year-old irrigated tea crop in Tanzania, where the percentage of biomass in stems were lower while those in leaves and roots were greater than in the present study.
Interestingly, the rates of total biomass increases observed in the present study (i.e. 16.66 and 15.05 t ha−1 yr−1 for DT1 and TRI2025 respectively) were comparable to that of 16.9 t ha−1 yr−1 observed by Magambo and Cannell (Reference Magambo and Cannell1981). However, growth rates of the our tea crops were greater than the range of 9.43–11.40 t ha−1 yr−1 observed by Burgess and Carr (Reference Burgess and Carr1993) for 1–2-year-old tea in Tanzania and the mean value of 12.17 t ha−1 yr−1 observed by Burgess and Carr (Reference Burgess and Carr1996b) for a 3-year-old irrigated crop.
Role of harvest index and leaf parameters
The range of HI observed in the present study (i.e. 0.09–0.21) (Table 1) is within the overall range of 0.07–0.24 reported for tea (Burgess and Carr, Reference Burgess and Carr1993, Reference Burgess and Carr1996b; Magambo and Cannell, Reference Magambo and Cannell1981; Murty and Sharma, Reference Murty and Sharma1986; Ng'Etich and Stephens, Reference Ng'Etich and Stephens2001; Tanton, Reference Tanton1979). Variation of HI (Table 1), LAI and MLDW (Table 4) during the course of the pruning cycle paralleled the variation of yield during the same period. All three variables showed increases during the first three years (with the exception of HI in TRI2025 which increased only up to the end of year 2) and a subsequent decrease during the fourth year. Accordingly, there were significant (p < 0.001 for HI, p < 0.05 for MLDW) or near significant (p = 0.08 for LAI) positive correlations between these variables and yield for the two cultivars separately (Table 5). Therefore, it is possible that the reductions that occurred in the fourth year in all three variables could have been responsible for the yield decline. Out of these three, LAI and MLDW are indicators of the assimilate production capacity of the crop while HI is an indicator of the crop's capacity to partition assimilates towards the harvested shoots. Therefore, reductions in both assimilate production and assimilate partitioning during the final year of the pruning cycle caused the yield decline during this period.
The decline of LAI and MLDW during the final year was a notable occurrence, which could have been the result of reduced leaf initiation rates and/or increased leaf fall. The yearly variation patterns of FLDW for the two cultivars only partially coincided with the corresponding variations of LAI and MLDW (Table 4). In TRI2025, FLDW showed significant increases in years 3 and 4 relative to years 1 and 2, while in DT1, FLDW showed a significant increase from year 1 to 2 and an increase from year 3 to 4. While these increases in FLDW during the second half of the pruning cycle could have contributed to the significant reductions of LAI and MLDW during the final year, it is highly probable that appreciable reductions in leaf initiation rates during the final year played a larger role in reducing LAI and MLDW. The observation of significant reductions in harvested shoot numbers m−2 in both cultivars (Table 2) also supports this conclusion.
Although all three variables mentioned above had positive correlations with yield when the data were analysed separately for the two cultivars, only HI showed a significant positive correlation with yield when the correlation analysis was done after pooling the data from both cultivars together (Table 4). In contrast, LAI and MLDW did not have significant correlations with yield across the two cultivars because both LAI and MLDW were higher in the lower-yielding DT1. Therefore, out of the above three variables, reduction of HI probably has a greater influence than the reductions of LAI and MLDW in causing the fourth-year yield decline. A reduction in yield could have occurred in the fourth year because of either a reduction of total biomass production in the fourth year or a reduction in the amount of biomass partitioned to harvestable shoots. Results of this study clearly show that it is the reduction in biomass partitioning to harvestable shoots that causes the fourth-year yield decline. Some insights in to the possible reasons for this reduction in biomass partitioning could be gained by analysing the corresponding variations in yield components. Further mechanistic insights in to this shift in biomass partitioning may be gained by investigating the partial processes of biomass partitioning (i.e. sucrose loading from a source leaf to the phloem, its transport in the phloem and its unloading at a sink) at the cellular level (Farrar, Reference Farrar, Pollock, Farrar and Gordon1992). However, such detailed analyses at the cellular level are beyond the scope of the present study and need to be undertaken as the next step in elucidating the physiological basis of the shift in biomass partitioning that has been observed here.
Yield components and source-sink interactions
This reduction in HI could be clearly related to reductions in the total number of shoots per m2 (Table 2) and in the mean individual shoot weight (Table 3), both of which showed significant reductions during the fourth year in parallel with the observed reductions in yield (Figure 1) and HI (Table 1). Hence, processes inhibiting the initiation of shoots and the translocation of assimilates to developing shoots were probably responsible for the yield reductions observed during the fourth year of the pruning cycle. Analysis of the probable causes for the significant reduction of LAI and MLDW during the fourth year also showed that the shoot initiation rate probably declined during this period. In the absence of soil water deficits, shoot initiation of tea is primarily controlled by temperature (Carr and Stephens, Reference Carr, Stephens, Willson and Clifford1992; De Costa et al., Reference De Costa, Mohotti and Wijeratne2007). However, most of these relationships have been established on young tea plants, which were probably in the juvenile phase. As the tea bush grows older and mature, it is likely that internal factors may influence the shoot initiation process in addition to the environmental controls. When tree crops move from their juvenile phase to the mature phase, a slowing down of initiation processes can happen, e.g. in coffee, cacao and rubber (Alvim and Kozlowski, Reference Alvim and Kozlowski1977) and in trees used in agroforestry (Huxley, Reference Huxley, Ong and Huxley1996). It may be expected that the number of shoots initiated would increase with increasing total dry weight of the bush because of greater availability of assimilates and essential growth resources. The bigger foliage canopy and root system may be expected to capture greater amounts of radiation, nutrients and water. However, the significant negative correlation between NTOT and TDW (Table 6) indicates that a continuous increase in TDW at some point triggers a signal, may be hormonal, which reduces shoot initiation.
On the other hand, the significant positive correlations of the mean individual weights of both active and banji shoot with LAI and MLDW (Table 6) indicate that shoot weight is dependent on assimilate supply. Hence, reductions of these leaf parameters during the fourth year brought about the reductions of mean individual weights of both active and banji buds, which contributed to yield reductions during the final year of the pruning cycle. The reduction of NTOT during the fourth year meant a lower number of sinks (i.e. young shoots) probably leading to a lowered sink strength. This may have put the young shoots at a disadvantage against the larger sinks such as stem and branch structure and the root system in attracting assimilates. Reductions in the assimilate supplying capacity, as indicated by reductions in LAI and MLDW during the fourth year, in combination with the above reduction in the sink strength could have caused the observed yield reduction.
Role of assimilate supply through photosynthesis
Evidence for reduction of the assimilate supplying capacity was shown by results on photosynthesis measurements. The Pmax of maintenance foliage showed significant decreases during the fourth year in both cultivars (Figure 4). Here, there was a cultivar difference, with the significant decline of Pmax occurring earlier in the pruning cycle in TRI 2025 (i.e. after the second year) than in DT1 (i.e. after the third year). Reduction of the assimilate supply in the fourth year might not only have caused a reduction in mean individual shoot weights but also a reduction in the rate of shoot initiation. Botwright et al. (Reference Botwright, Menary and Brown1998) showed that there was a close synchrony between the net photosynthetic rate (Pn) of maintenance foliage and different stages of shoot development in tea. Pn was highest at the stage when the number of leaf primordia in the apical bud was maximum. Conversely, Pn was minimum at the time of cessation of leaf initiation and shoot extension. Hence, in the present study also, the reduction of Pmax during the fourth year could have caused a reduction in shoot initiation as well.
Role of root starch
Interestingly, a clear correlation was observed between the tea yield decline after the third year of the pruning cycle and an increase in root starch content in both cultivars (Tables 1 and 5 and Figure 3). Previous work has shown that tea shoots act as a strong sink for assimilates (Botwright et al., Reference Botwright, Menary and Brown1998; Manivel and Hussain, Reference Manivel and Hussain1986; Tanton, Reference Tanton1979). Accordingly, significantly reduced shoot numbers in the fourth year could reduce the demand for assimilates from the shoots. These assimilates could have been directed towards the roots causing root starch to increase in the fourth year. However, significant reductions in mean individual shoot weights (Table 3) in the fourth year do not support the above hypothesis. If shoots had been strong sinks during the fourth year, they should have been able to attract the remaining assimilates to attain their maximum possible weights. Especially, in a situation when the overall shoot numbers are reduced, the remaining shoots should have had the capability to attract the available assimilates. However, this has not happened in the present experiment. Therefore, we need to look for alternative explanations.
Two possible explanations to the observed yield decline during the fourth year could be put forward. One explanation is the possibility of increased competition for assimilates between roots and shoots during the fourth year. If this competition is altered during the fourth year, in favour of the roots, a greater fraction assimilates could have been translocated to the roots. This may have caused a shortage of assimilates in the shoot thus causing reductions in both shoot number and mean individual shoot weight. Reduction of photosynthetic capacity, as evidenced by the reductions of Pmax during the second half of the pruning cycle, may also have contributed to the above reductions in tea yield and its components. Furthermore, the continuous increase of total biomass throughout the pruning cycle in both cultivars (Figure 1) meant that maintenance respiration also increased continuously thus constituting a drain on the available assimilates.
The second possible explanation is that the increase of root starch concentration may be an indication of a general down-regulation of physiological activities of the whole tea bush after the third year of the pruning cycle. Starch accumulation in the roots had occurred despite a reduction in the assimilate supplying capacity of the shoot, as evidenced by the reductions of Pmax during the second half of the pruning cycle (Figure 4). Both absolute root biomass and the percentage of biomass partitioned to roots did not increase after the third year (Figure 1). However, the increase of root starch content during the fourth year showed that stabilization of root biomass and the fraction of biomass partitioned to roots was not the result of a shortage of assimilates.
Other studies (e.g. Bore et al., Reference Bore, Isutsa, Itulya and Ng'etich2003) have shown that the non-structural carbohydrate content increases in both roots and shoots when the bush reaches the stage where pruning is required. This is further evidence of a physiological down-regulation as this accumulation of starch occurs despite a reduction in photosynthetic capacity. Reduction of the number of shoots initiated, which was one of the causal factors of the observed yield reduction during the fourth year of the pruning cycle, could be the result of this overall down-regulation of the physiology of the tea bush. The observation of Magambo (Reference Magambo1983, as cited in Magambo and Waithaka, Reference Magambo and Waithaka1985) that older clonal tea had a lower HI than younger clonal tea is an agreement with this explanation.
Although the length of the pruning cycle can vary from 1 to 6 years (Willson, Reference Willson, Willson and Clifford1992), in the major tea-growing countries such as India, Sri Lanka, Kenya and Tanzania, its range is 4 to 6 years. Temperature is the main determinant of the length of the pruning cycle with the cycle being extended at lower temperatures. Temperature is the main determinant of the crop developmental processes as well (Squire, Reference Squire1990), with processes such as shoot initiation and crop maturity being hastened at higher temperatures until an optimum is reached. Therefore, when the pruning cycle is extended at lower temperatures, the possible physiological down-regulation, which is also a developmental process, is likely to occur later than at higher temperatures.
Results of the present study point to an internal mechanism within the tea bush by which physiological activities are down-regulated towards the end of the pruning cycle, which ultimately results in a significant yield reduction. However, this is not a complete explanation of the step-wise sequence of events or the internal mechanism that causes this yield reduction. Further studies, probably involving cellular level work and growth regulators, should be done to elucidate this internal mechanism. Inherently, tea grows in to a tree of medium height if left unpruned. Commerically grown tea is maintained as a bush of 1.0–1.5 m height by periodic pruning in order to obtain a continuous supply of young shoots. However, it is highly likely that a regularly pruned tea bush has a greater rate and magnitude of shoot initiation than an unpruned tree/shrub of tea. Accordingly, shoot initiation is likely to slow down when a pruned tea bush grows beyond a certain stage. Therefore, the down-regulation of physiological activities, of which reduction of shoot initiation and increase of root (and shoot) starch contents are components, may be an indication of a physiological transition from a bush to a shrub/tree. This is equivalent to the transition from the juvenile phase to the mature phase, which is a common occurrence in many tree crops (Alvim and Kozlowski, Reference Alvim and Kozlowski1977; Huxley, Reference Huxley, Ong and Huxley1996).
It should also be borne in mind that, similar to many perennial crops, tea can exhibit considerable developmental plasticity. Processes leading to the yield decline during the latter part of the pruning cycle, probably involve developmental processes such as shoot initiation and interplay between shoot and root growth as determined by shifts in assimilate partitioning. Hence, the overall picture may be more complicated than outlined above with many feedbacks and controls. Possible involvement of growth regulators, particularly in influencing shifts in shoot initiation, could add a further dimension to the overall mechanism. For example, if shoot initiation is influenced by a hormonal signal originating in the roots and translocated to the top of the plucking table where new shoots initiate, increasing distance between root tips and the plucking table as the bush grows in height during the course of the pruning cycle could decrease the initiation of shoots leading to a yield reduction. Hence, these possibilities need to be investigated further.
Acknowledgements
This research was funded entirely by the Tea Research Institute of Sri Lanka. The authors are grateful to the support staff of the Divisions of Plant Physiology and Agronomy for their technical support.