I. INTRODUCTION
In optical glasses, extrinsic losses can occur due to either extrinsic scattering or extrinsic absorption. Scattering can be caused by impurity inclusions, crystallization, and refractive index fluctuations; therefore, variations in fabrication parameters are the prime cause of extrinsic scattering loss. The control of viscosity and crystal nucleation and growth is of paramount importance for minimizing the extrinsic scattering loss due to the presence of crystals formed during glass preform and fiber fabrication. Extrinsic absorption losses are mainly due to impurities in the glass, which can originate from the glass raw materials or contamination from melting apparatus and exhibit wave length dependant absorptions. Raw materials used in making multicomponent glass system are inherently hygroscopic in nature and water may be present at concentrations higher than the parts per billion (ppb) level. During storage and transportation of raw materials, the water contamination can increase to the parts per million (ppm), and these levels may be further increased during glass processing. In optical fiber made from multicomponent glass systems, contaminations from water can be characterized by Fourier transform infrared (FTIR) analysis and is identified as OH− ions. OH− has a broad and intense fundamental absorption centered at ∼2.8 μm with harmonics and combination bands at shorter wave lengths. Among the multicomponent glass systems, tellurium oxide glasses are of interest due to their extended transmission into the infrared making them suitable for active and passive near-IR and mid-IR devices such as lasers, amplifiers, fibers, and waveguides. Bulk glass, fiber, and thin film devices operating in the 2–5 µm spectral regions are of importance for applications such as chemical sensing, light detection and ranging (LIDAR), and medicine. Many of the rare earth ions which are used for active devices in the infrared regions have important transitions which are resonant with the OH− fundamental or harmonic/overtone absorption bands (such as Er3+ 1.5 µm, Tm3+/Ho3+ 2 µm, and Dy3+ 3 µm); therefore, it is critical to minimize the OH− ion concentration in the glass to avoid quenching of the desired radiative transition. High purity silica glass for fiber optics are prepared using modified chemical vapor deposition (MCVD) or vapour-phase axial deposition (VAD) processes, whereas tellurite glasses are prepared using conventional melt quenching methods using commercially available raw materials. The OH− ion absorption in TeO2-based glass is strongly dependent on the constituents, especially alkali, phosphate, and B2O3, which are inherently hygroscopic. Hence, it is essential to purify the raw materials to yield high purity glasses and subsequently low loss fiber.
Scholze Reference Scholze1 first measured a differential spectrum between normal glass and those doped with high levels of water vapor and concluded that an absorption band close to 2.9 μm is due to water. Kurkjian and Russell Reference Kurkjian and Russell2 identified that this water band is due to the OH− ion. The OH− ion will not only give rise to its fundamental absorption close to 2.9 μm but will also exhibit several other absorption bands. If the fundamental absorption frequency is ν0, then the overtones will occur at frequencies close to mν 0 where m is a positive integer. Second, the OH− ion sits in the glass matrix comprised of TeO4 structural units; therefore, the combination bands will also occur between ν0 and its overtones and the fundamental TeO4 stretching vibration ν1. This will lead to a new set of bands with frequencies given approximately by Eq. (1), where m and n are positive integers, ν0 is the OH− fundamental and ν1 is the TeO4 symmetric stretch. Reference Chaplin3
 $${\rm{\nu }} = m{{\rm{\nu }}_0} + n{{\rm{\nu }}_1}\quad .$$
OH− ions in silica glass are substantially reduced by using a dehydration agent such as thionyl chloride (SOCl2). Reference Sudo, Kawachi, Izawa, Edahiro, Shioda and Gotoh4–Reference Edahiro, Kawachi, Sudo and Inagki6 SOCl2 essentially removes free water and OH− bonded to Si (i.e., Si–OH) as HCl and Si–Cl at temperatures higher than 983 K. Absorption loss due to the Si–Cl bond has no major influence on the fiber loss in the wave length region of 0.4–2.0 μm as it has a fundamental absorption peak at around 25 μm. Tellurite glasses have a melting point of around 950 K, hence SOCl2 may not be used to remove free water and OH− from tellurite glass. Feng et al. Reference Feng, Tanabe and Hanada7 studied hydroxyl absorption of glasses in the system TeO2–Na2O–ZnO–GeO2–Y2O3–Er2O3 using carbon tetrachloride (CCl4) and identified two absorption bands due to OH− prominent in these glasses, one at 3500 cm−1 (2.86 µm) attributed to free OH− and another at 2300 cm−1 (4.35 µm) attributed to hydrogen bonded OH− (the stronger the association, the longer the wave length of absorption). Bubbling CCl4 through the molten glass reduced the intensity of both absorption bands as OH− is removed from the glass as HCl. Dissociated CCl4 will lead to CO and CO2 formation together with COCl2 which is highly toxic. Residual HCl, CO, and CO2 will be absorbed and yield corresponding absorption bands in the mid-IR between 4 and 5 µm, which is a useful part of the mid-IR window for many chemical sensing and atmospheric science applications. Lin et al. Reference Lin, Ryasnyanskiy and Toulouse8 have used fluorides in the tellurite glass batch, which may drastically change the glass property and can detrimentally affect the glass stability. Massera et al. Reference Massera, Haldeman, Jackson, Rivero-Baleine, Petit and Richardson9 have reported the reduction of OH− ion contamination when ZnO is replaced with ZnF2 in a TeO2–Bi2O3–ZnO glass system. Mori Reference Mori10 reports a purification and novel fabrication process for tellurite photonic crystal fiber with low loss. Gebavi et al. Reference Gebavi, Milanese, Liao, Chen, Ferraris, Ivanda, Gamulin and Taccheo11 demonstrated a reduction in OH− ion absorption intensity from 6 to 1 cm−1 when a 75TeO2–20ZnO–5Na2O glass was mixed and preheated in a glove box under a N2 atmosphere. Lin et al. Reference Lin, Zhang, Bushong and Toulouse12 reported the loss of 0.24–0.7 dB/m in tellurite fiber by controlling the fiber drawing conditions.
High-purity oxide raw materials were melted at 800 °C in platinum or gold crucibles in a hermetic chamber with purified oxygen as the atmosphere to produce TeO2–ZnO–Na2O–Bi2O3 and TeO2–WO3–La2O3–MoO3 glasses with losses at the level of several hundreds of dB/km. Reference Moiseev, Dorofeev, Chilyasov, Kraev, Churbanov, Kotereva, Pimenov, Snopatin, Pushkin, Gerasimenko, Kosolapov, Plotnichenko and Dianov13 Optical absorption in 0.78TeO2–0.22WO3 glass was reduced from 0.16 to 0.01 cm−1 by melting in an atmosphere of purified O2. Reference Churbanov, Moiseev, Chilyasov, Dorofeev, Kraev, Lipatova, Kotereva, Dianov, Plotnichenko and Kryukova14 O’Donnell et al. Reference O’Donnell, Miller, Furniss, Tikhomirov and Seddon15 utilized the treatment of tellurite glass-forming melts with ZnF2 and demonstrated significant reduction in OH−, but not sufficient enough to achieve losses below 1 dB/m in the near- and mid-IR in fiber structures.
Cl2 and Cl2/O2 gases are commonly used for OH− reduction in phosphate laser glass on a commercial scale. Phosphate glass and its precursor raw materials are particularly prone to OH− contamination due to the hygroscopic nature of P2O5, yet Cl2 is successfully used to reduce OH− levels to acceptable values for laser applications. Reference Campbell16 In this paper, we report the use of chlorine gas to minimize OH− ions in the tellurium oxide-based glass. Here, we have used a mixture of dry chlorine and oxygen in the volume ratio 10 and 90%, respectively. Cl2 will halogenate tellurium resulting in TeCl4, which acts as an impurity in the tellurite glass.
The raw materials containing water of crystallization are TeO2·2OH, Zn(OH)2, and Na2CO3·10H2O. When these are treated with chlorine, the following reactions may be feasible:
 $${\rm{Zn}}{\left( {{\rm{OH}}} \right)_2} + {\rm{C}}{{\rm{l}}_{\rm{2}}}\left( {\rm{g}} \right) = {\rm{ZnO}} + 2{\rm{HCl}}\left( {\rm{g}} \right) + 0.5{{\rm{O}}_{\rm{2}}}\left( {\rm{g}} \right)\quad ,$$
 $${\rm{N}}{{\rm{a}}_{\rm{2}}}{\rm{C}}{{\rm{O}}_3} \cdot 10{{\rm{H}}_2}{\rm{O}} + 10{\rm{C}}{{\rm{l}}_{\rm{2}}}\left( {\rm{g}} \right) =\,\, {\rm{N}}{{\rm{a}}_{\rm{2}}}{\rm{C}}{{\rm{O}}_{\rm{3}}} + 20{\rm{HCl}}\left( {\rm{g}} \right) + 5{{\rm{O}}_{\rm{2}}}\left( {\rm{g}} \right)\quad ,$$
 $${\rm{Te}}{{\rm{O}}_{\rm{2}}}2\left( {{\rm{OH}}} \right) + {\rm{C}}{{\rm{l}}_{\rm{2}}}\left( {\rm{g}} \right) = {\rm{Te}}{{\rm{O}}_{\rm{2}}} + 2{\rm{HCl}} + {{\rm{O}}_{\rm{2}}}\left( {\rm{g}} \right)\quad .$$
For Eqs. (2)–(4), the Gibbs free energy (
 $\Delta G_{T}^0$
) changes as a function of temperature are expressed as:
 $$\Delta G_{{{T}}(1)}^0 = {\rm{109923}}{\rm{.8 {\hbox-} 219}}{{.920T}}\quad ,$$
 $$\Delta G_{{{T}}(2)}^0 = {\rm{1094797}}{\rm{.4 {\hbox-} 2088}}{{.413T}}\quad ,$$
 $$\Delta G_{{{T}}(3)}^0 = {\rm{206045}}{\rm{.4 {\hbox-} 328}}{{.275T}}\quad {\rm{.}}$$
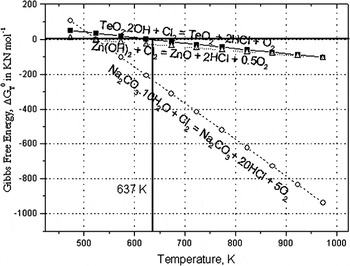
As seen in Fig. 1, ΔG is negative for Eqs. (2)–(4) above 637 K, indicating that the reaction is favorable. Therefore, temperatures >637 K will be required to remove water of crystallization.
Gibbs free energy as a function of temperature.

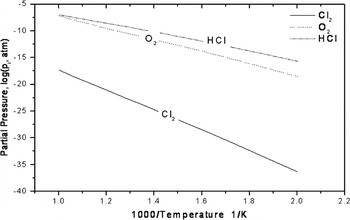
The equilibrium vapor pressures of the dominant species in the Te–Na–Zn–O–Cl–H system are computed by considering the multicomponent phase equilibria over the temperature range 500–1000 K, which is shown in Fig. 2. The FACTSAGE™ software program developed by Thermfact/CRCT (Montreal, Canada) and GTT-Technologies (Aachen, Germany) is used to compute the equilibrium vapor pressures. The results of computed equilibrium partial pressures of gaseous species illustrate that increasing the temperature enhances the formation of HCl, which means that the bond between the network former and hydrogen is broken at very high temperatures.
Comparison of the equilibrium partial pressures (log (p i, atm)) against temperature for gaseous species in the system.

The reduction of OH− in a glass melt can be achieved through gas bubbling using reactive (such as Cl2) and nonreactive (such as O2) gases. The nonreactive component of incoming dry gas removes OH− from glass melt by reaching equilibrium with the H2O content of the gas bubble. Reactive gases are more effective at removing OH− from the glass melt, as the gas bubble reacts with the OH− at the glass–bubble interface, and in the case of Cl2 gas, bubbling produces HCl gas which is removed from the melt through the reaction shown in Eq. (5). Reference Adams17
 $$2{{\rm{H}}_2}{\rm{O}} + 2{\rm{C}}{{\rm{l}}_2} \leftrightarrow 4{\rm{HCl}} + {{\rm{O}}_2}\quad .$$
II. EXPERIMENTAL
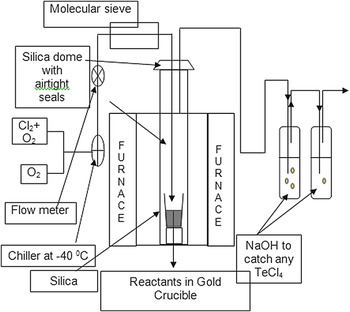
High-purity TeO2, ZnO, and Na2CO3 (99.99% pure) starting materials were weighed to produce a composition of 80TeO2, 10ZnO, and 10Na2O (mol%) and were ground and mixed in a glove box using a pestle and mortar. The raw materials were placed in a gold crucible and lowered into an electric tube furnace using a quartz cradle. Figure 3 shows the experimental set-up used for the treatment of the raw materials with a mixture of dry Cl2:O2 gas (10:90 vol%). The total volume of the chamber used for purification of the starting materials was 2.4 × 10⁻³ m3.
Setup for purification of raw materials.

The drying experiments that were conducted are divided into the following three groups:
-
(i) effect of predrying conditions: the predrying temperatures studied were between 623 and 723 K. At higher temperatures, the materials were partially melted. Drying was carried out at 623 and 723 K for 3 h with the following procedure. The glass batch was first heated to 400 K with a heating rate of 6 K/min in air. The temperature was then increased to the drying temperature while passing the Cl2 + O2 gas mixture at a flow rate of 0.5 L/min. After drying for 3 h, the temperature was increased to the melting temperature of 1098 K while purging the furnace with O2 gas. After 1 h, the samples were cast into preheated brass molds.
-
(ii) Effect of melting conditions: the raw materials were first dried as described above in A. After drying the batch materials at 623 K, the temperature of the furnace was raised to the melting temperature of 1073 K while the furnace was purged with Cl2 + O2 gas at a flow rate of 0.5 L/min. After melting for 60 min, dry O2 was purged through the furnace for 0, 15, or 30 min before casting the glass.
-
(iii) Effect of O2 bubbling duration: as-received starting materials were melted at 1073 K and then bubbled with standard grade O2 gas at a flow rate of 1 L/min for 0–105 min. The O2 gas was first passed through a coil of copper pipe at 223 K to freeze out any moisture in the gas. Glass melts were then cast into a preheated (568 K) brass mold and then annealed at 568 K for 3 h before being cooled to room temperature at a rate of 0.5 K/min.
The gas exiting the purification furnace was bubbled through 2-M NaOH solution to neutralize the residual Cl2 by producing NaCl and H2O. A glass composition of 80TeO2, 10ZnO, and 10Na2O was chosen, since it is a typical core glass composition for tellurite optical fibers. After polishing the samples to an optical finish (6 μm), FTIR spectroscopy was performed using Perkin-Elmer FTIR 1725x (Waltham, MA) and Bruker Vertex 70 (Coventry, UK) spectrometers to analyze the fundamental OH− absorption band.
III. RESULTS
A. Purification
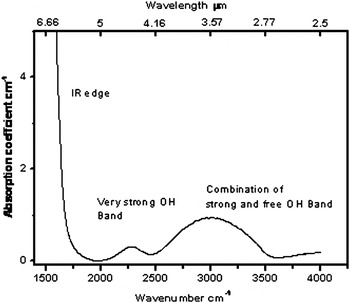
Figure 4 shows the infrared absorption spectrum for an 80TeO2–10Na2O–10ZnO glass. It can be seen that the IR multiphonon absorption edge for these glasses is located at around 1667 cm−1 (6 µm). The two absorption bands in Fig. 4 are assigned to OH− stretching vibrations. TeO2 glass has three basic structural units: TeO4 (trigonal bipyramid), TeO3 (pyramid), and an intermediate with TeO3+δ polyhedra. Each of these structures has a lone pair of electrons which can bond with OH−. This forms OH− groups in the vitreous glass host and the highly disordered hydrogen bonded OH− group results in the absorption bands becoming quite broad. Reference Adams17 A previous study in sodium silicate glasses classified OH− absorption into three groups, which are due to (i) the free OH− groups (at 3500 cm−1), (ii) strongly hydrogen-bonded OH− groups (at 2650 cm−1), (iii) the very strongly bonded OH− groups (at 2300 cm−1). Reference Scholze1
Classification of OH− peaks using infrared absorption spectroscopy of 80TeO2–10Na2O–10ZnO glass. Reference Ernsberger18

OH− groups are connected with the network of the glass former through hydrogen bonding. Reference Adams17 OH− ions are normally coupled to cations in the glass network, and in the case of tellurium oxide glass, Te4+, stronger association results in longer wave length absorption bands. For the free OH− groups, the distance between OH− ions is quite large, e.g., 0.79 nm in sodium silicate glasses. Reference Scholze1,Reference Sakka, Kamiya and Kamiya19 Therefore, the frequency of the fundamental vibration of free OH− is affected not by the association of OH− with other ions but by the association with the glass former cations. On the other hand, the strongly hydrogen bonded OH− groups will become insensitive to the local environment and the network strength because the distance between the strongly hydrogen-bonded OH− and another OH− will be much shorter, 0.255 nm in sodium silicate glasses. Reference Scholze1,Reference Sakka, Kamiya and Kamiya19 That is the reason for the tendency of OH− absorption band within germanotellurite glass systems to shift. Reference Feng, Tanabe and Hanada7
As per Beer–Lambert's law, the transmittance (T) is given by
 $$T = {I \over {{I_0}}} = \exp ( - {\rm{\alpha }}l)\quad ,$$
where I is the transmitted intensity, I 0 is the incident intensity, α is the absorption coefficient, and l is the thickness in centimeter. The absorption coefficient is related to the extinction coefficient according to
 $${\rm{\alpha }} = C*\varepsilon \quad ,$$
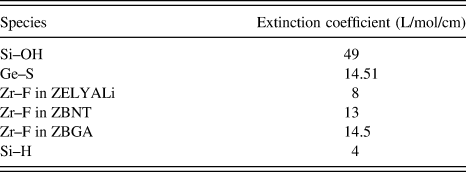
where C (mol/L) is the concentration of the absorbing ion and ε (L/mol/cm) is the extinction coefficient (or molar absorption coefficient). Table I summarizes extinction coefficients for various species as found in the literature. Reference Mitachi, Fonteneau, Christensen and Lucas20
Molar extinction coefficient of OH− in various glass hosts. Reference Mitachi, Fonteneau, Christensen and Lucas20

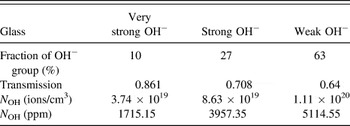
The content of the free OH− groups in glasses can be estimated from the measured absorption coefficient of the ∼3000 to 3500 cm−1 peak. Reference Scholze1,Reference Sakka, Kamiya and Kamiya19 The free OH− content N OH (ions/cm3) can be obtained using Eq. (7). Reference Sakka, Kamiya and Kamiya19
 $${N_{{\rm{OH}}}} = {N \over {{\rm{\varepsilon }}L}}\ln {1 \over T}\quad ,$$
where N is the Avogadro constant, L the glass thickness (cm), T is the transmittance, and ε is the molar absorptivity of the free OH− groups in the glass. The molar absorptivity of the free OH− groups in silicate glass is 49.1 L/mol/cm, as there is no relevant data for tellurite glass.
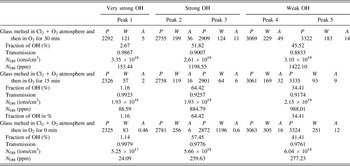
From Table II, the area of each band is proportional to the concentration of the absorbing species in the glass. Therefore, the areas can be used to calculate the fraction of each type of OH− present in the glass, assuming each type has approximately equal extinction coefficients. Using Eq. (7), the value of N OH (ions/cm3) is calculated and summarized in Table III. At room temperature, the molar volume of 80TeO2–10Na2O–10ZnO glass is 27.61 cm3/mol. Therefore, OH− ion concentration in ppm (N OH) is calculated using Eq. (8), where V is the molar volume and N is Avogadro's number.
 $${N_{{\rm{OH}}}}\left( {{\rm{ppm}}} \right) = {{{N_{{\rm{OH}}}}} \over {V/N}}*{10^6}\quad .$$
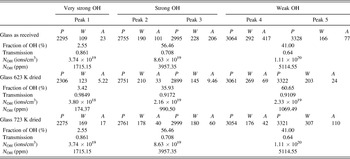
Position (P) cm−1, FWHM (W) cm−1, and areas (A) (cm−1)2 of OH− groups for 80TeO2–10Na2O–10ZnO glass before purification.

OH− groups for 80TeO2–10Na2O–10ZnO glass before purification.

B. Effect of predrying temperature
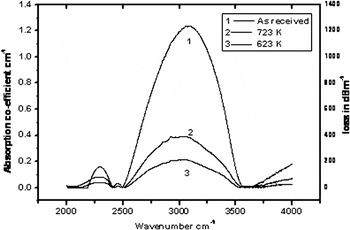
Figure 6 compares the infrared absorption spectrum of the samples purified at 623 and 723 K with a sample made from unpurified as-received raw materials.
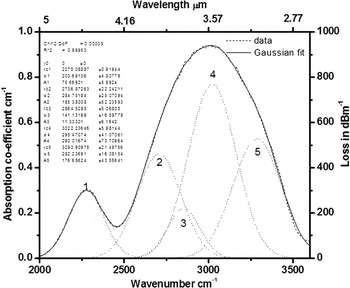
The Gaussian deconvolution of the OH− absorption bands in 80TeO2–10Na2O–10ZnO (mol%) glass.

The peak positions (P), FWHM (W), and areas (A) of the different OH− species and OH− content for individual peaks are calculated and summarized in Table IV. Table IV also summarizes the analysis of Gaussian fitting for the as-received starting materials compared to the materials dried at 723 K. According to thermodynamic calculations (see Fig. 1), samples purified at 723 K should exhibit less OH− species in comparison with samples treated at 623 K; however, the samples dried at 723 K show a larger amount OH− species in the glasses. This may be because of the incipient fusion and partial melting of the starting materials, which occurred at 723 K and which led to a significant reduction in the overall reaction surface area. Hence, it is essential to carry out purification below 723 K for this glass composition.
Position (P) cm−1, FWHM (W) cm−1, and areas (A) (cm−1)2 of OH− groups in glass samples purified at different temperatures.

Position (P) cm−1, FWHM (W) cm−1, and areas (A) (cm−1)2 of OH− groups in a glass sample purified at 623 K with different melting conditions.

C. Effect of melting conditions
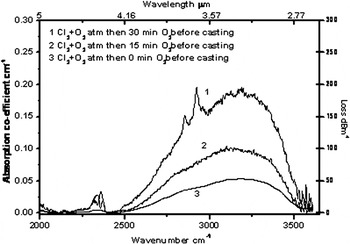
Figure 7 shows the effect of the melting conditions on the residual OH− content of the glass. In Fig. 7, A, B, and C refer to glasses melted in an atmosphere of flowing Cl2 + O2 gas followed by O2 gas for 30, 15, and 0 min. The small peak for curve A at around 2900 cm−1 could be due to the presence of crystals, as chlorine can cause slight instabilities in glass. Table V summarizes the positions (P), FWHM (W), and areas (A) of these bands. The areas under the curve have been used to calculate the fraction of each type of OH− present in the glass, assuming each type has approximately equal extinction coefficients. As seen in Figs. 6 and 7, the absorption loss at around 3.2 μm for the as-received starting materials is around 1000 dB/m and for the Cl2 + O2 purified glass is 60 dB/m.
Infrared absorption spectra of 80TeO2–10Na2O–10ZnO glasses for different drying temperatures.

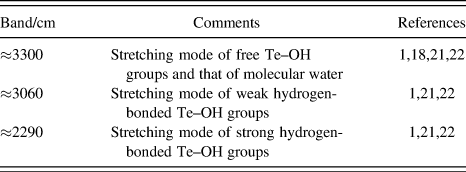
In sodium silicate glasses, OH− band broadening appears to be dependent on the glass structure, and typically, OH− ions are associated with the presence of nonbridging oxygen. This nonbridging site forms a hydrogen bond with silica, which gives broad OH− absorption. Reference Adams17 Scholze Reference Scholze1 reported that the absorption band at around 3500 cm−1 for alkali metal silicate glasses is attributed to the stretching mode of the free Si–OH groups. Ryskin Reference Ryskin and Stavitskaya21,Reference Ryskin and Nauk SSSR22 also identified a band at around 3500 cm−1 for hydrated crystalline silicates and attributed this to a stretching mode of the water molecule. It is therefore proposed that the band at around 3300 cm−1 in Fig. 5, which has a shoulder at 3060 cm−1, is due to free Te–OH groups and 3022 cm−1 is attributed to molecular water.
Infrared absorption spectra of 80TeO2–10Na2O–10ZnO glasses for different melting conditions.

There are two equilibrium conditions occurring during hydrolysis of the glass melt Reference Efimov, Kostyreva and Sycheva23 : (i) water vapor entering the melt as molecular water and (ii) molecular water in the melt hydrolysing the molten network. Therefore, the coexistence of these two equilibria in the melt seems to suggest the probable nonzero concentration of molecular water in any glass with a nonzero water content. Reference Efimov, Kostyreva and Sycheva23 Scholze Reference Scholze1 identified a band at around 2800 cm−1 for alkali metal silicate glasses and attributed this to the stretching mode of the Si–OH group that forms the weaker hydrogen bonding with the nonbridging oxygens (NBOs) of the Q2 or Q3 tetrahedron (where Q n is a SiO4 tetrahedron with n bridging oxygen bonds to the surrounding network). It is proposed in the current study that the band which occurs at around 3060 cm−1 for tellurite as shown in Fig. 5 is attributed to the stretching mode of the weakly hydrogen-bonded Te–OH groups.
Scholze Reference Scholze1 also identified another band at around 2350 cm−1 for alkali metal silicate glasses and assigned this to the stretching mode of Si–OH groups, which form the strongest hydrogen bonding with the NBOs of the isolated SiO4 tetrahedron Q0 (i.e., isolated SiO4 group with no bridging oxygens). Ryskin Reference Ryskin and Stavitskaya21,Reference Ryskin and Nauk SSSR22 identified the same band at 2350 cm−1 and attributed it to a stretching mode of the hydrogen-bonded Si–OH groups for crystalline hydrated silicates. It is proposed that the band which occurs at around 2290 cm−1 for tellurite glasses as seen in Fig. 5 is attributed to the stretching mode of the strongly hydrogen-bonded Te–OH groups. The assignments of these bands are summarized in Table VI.
Assignment of absorption bands.

As previously mentioned, tellurite glass has several structural units, namely [TeO4], [TeO3], and [TeO3+δ], and the bonding of O–H is comparatively stronger with [TeO3] than [TeO4]. The absorption band near 3.0–3.5 μm (2700–3200 cm−1) is caused by OH− stretching vibrations of the free OH−. The shifting of frequency is mainly due to the coupling constant of the OH− groups to the Te–O network (silicate 2.72 and fluoride 2.85 μm). In Fig. 5, curve 4 is attributed to the OH− attached to [TeO3], whereas curve 5 is OH− attached to [TeO4]. The overlap of curve 4 and 5 is due to [TeO3+δ], which is a combination of [TeO4] and [TeO3] units.
The absorption peak at 4.4 μm (2290–2400 cm−1) is due to stretching vibrations at 2350 cm−1. Reference Krasnov, Philipenko and Bobkova24 This band is ascribed to the presence of H bonding –O–H–O and coincides with the absorption band at 3.6 μm in silicate glasses. The oxide anion in OH− acts as an oxygen donor to the [TeO4] unit at the lone pair electron site at low concentrations, indicating transformation into a nonbridging donated oxygen site by accepting an oxide anion from OH−. Cl− ions break the hydrogen bond connected to different structural units; however, breaking of bonds with [TeO4] units occurs less readily than with [TeO3] units.
D. O2 bubbling
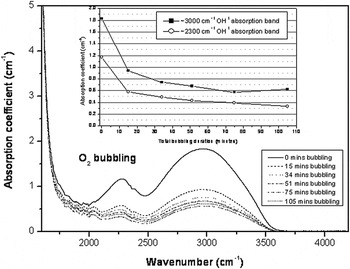
Figure 8 shows the results of bubbling an 80TeO2–10ZnO–10Na2O (mol%) composition of glass with O2 gas for varying durations. The figure shows the reduction of both the ∼3000 and 2300 cm−1 OH− bands. Initially, the rate of OH− removal is high, but as the equilibrium is reached between the OH− concentration in the glass and H2O in the gas bubble, the rate reduces until very little gains are made after 75 min total bubbling time.
Infrared absorption spectra of 80TeO2–10ZnO–Na2O glass with different O2 bubbling durations. The inset graph shows the trend of absorption coefficient reduction of the OH− bands at 3000 and 2300 cm−1 with total O2 bubbling duration.

IV. CONCLUSIONS
The absorption loss due to OH− in bulk glasses is reduced from 1000 to 60 dB/m. The three Gaussian fits have been used to identify the different species of OH− attached to different structural units. All the OH− species, free and attached to different Te units, can be removed by melting the starting raw materials in a reactive atmosphere of Cl2 + O2. However, results showed that introduction of O2 gas again has increased the absorption band near 3.2 μm. O2 bubbling of tellurite glass melts has also shown to reduce the OH− content of the glass.
ACKNOWLEDGMENTS
P. Joshi acknowledges financial help from Overseas Research Scholarship. The authors acknowledge the support from the Engineering and Physical Science Research Council under research Grant No. GR/R31454/01. Dr. Vilas Tathavadkar's help is acknowledged for thermodynamic calculations using FACTSAGE™ software program.