I. INTRODUCTION
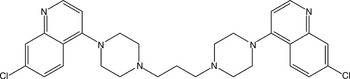
The title compound piperaquine (Figure 1), systematic name quinoline, 4,4′-(1,3-propanediyldi-4,1-piperazinediyl)bis(7-chloroquinoline), is bisquinoline anti-malarial drug which shows good activity against chloroquine-resistant Plasmodium strains (Divya et al., Reference Divya, Vasanth, Ramesh and Ramesh2014). Evidence suggesting the inhibition of the heme-digestion pathway in the parasite food vacuole is most convincing (Laskhmi and Mohan Gandhi, Reference Laskhmi and Mohan Gandhi2014). Piperaquine's bulky bisquinoline structure may be important for activity against chloroquine resistant strains and may act by inhibition of the transporters that efflux chloroquine from the parasite food vacuole (Reddy and Reddy, Reference Reddy and Reddy2014).
Structural formula of piperaquine.

II. EXPERIMENTAL
A. Sample preparation
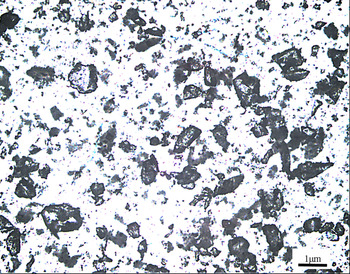
The title compound was purchased from Tianjin Heowns Biochemical Technology Co., Ltd., China, with 98% purity and characterized by Ultraviolet Visible (UV) and Fourier Transform Infrared Spectroscopy (FT-IR). The melting point and measured density of piperaquine are 199–200 °C and 1.346 g cm−3, respectively. Crystallization of piperaquine at room temperature was successful using chloroform as solvent. Then, part of crystals were dried and ground into powder (Figure 2).
(Color online) Optical microscopy image of piperaquine powder.

B. Diffraction data collection and reduction
X-ray powder diffraction measurement was performed at room temperature using an X'Pert PRO diffractometer (PANalytical Co., Ltd., Netherlands) with a PIXcel 1D detector and CuKα radiation (generator setting: 40 kV and 40 mA). The diffraction data were collected over the angular range from 4° to 50°2θ with a step size of 0.013 13°2θ and a counting time of 30 ms step−1.
The software package Material Studio 4.2 (Accelrys Co. Ltd., CA, USA) was used to process the data in the State Key Laboratory of Polymer Materials Engineering (Sichuan University, China). The X-ray powder diffraction pattern was pre-treated by subtracting the background, smoothing, and stripping off the Kα 2 component (Li et al., Reference Li, Wu, Pan, Cheng and Li2014). Automatic indexing results were obtained by the DICVOL91 method. The indexing results were then refined with the type of Pawley, which involves assigning the Miller indices (h, k, l) to each observed peak in the experimental powder X-ray diffraction (XRD) pattern (Wang et al., Reference Wang, Zhang, Wu, Pan, Su and Li2013).
C. Single-crystal XRD
XRD data for piperaquine were collected on a Xcalibur, Eos diffractometer. The crystal was kept at 293.15 K during data collection. The structure was solved with olex2 (Dolomanov et al., Reference Dolomanov, Bourhis, Gildea, Howard and Puschmann2009), a structure solution program using charge flipping, and refined with the ShelXL (Sheldrick, Reference Sheldrick2008) refinement package using least-squares minimization.
III. RESULTS
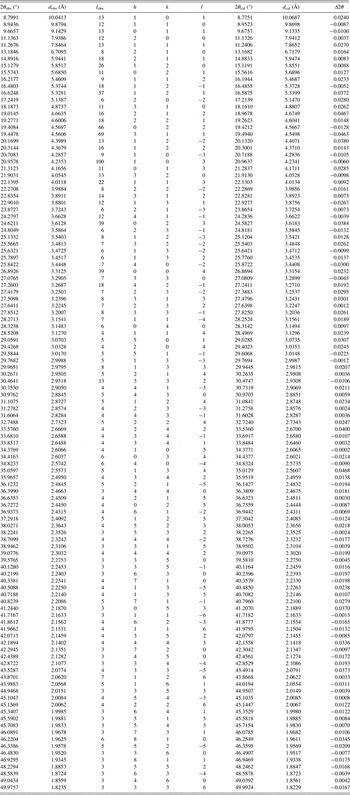
Pawley refinement results confirmed that piperaquine is monoclinic with space group P21/n and unit-cell parameters: a = 15.8865(1) Å, b = 12.5975(3) Å, c = 13.2647(3) Å, β = 91.2890(1)°, unit-cell volume V = 2654.02 Å3, and Z = 4. The values of 2θ obs, d obs, I obs, h, k, l, 2θ cal, d cal, and Δ2θ are listed in Table I.
X-ray powder diffraction data for piperaquine, C29H32Cl2N6. The d-values were calculated using CuKα 1 radiation (λ = 1.540 56 Å).

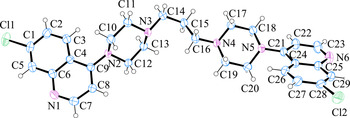
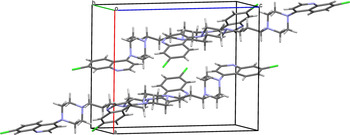
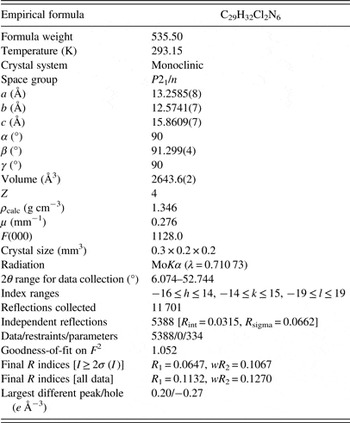
The single crystallographic data of piperaquine [a = 13.2585(8) Å, b = 12.5741(7) Å, c = 15.8609(7) Å, β = 91.299(4)°, unit-cell volume V = 2643.6(2) Å3, and Z = 4] and experimental data are listed in Table II. The figures were drawn with ORTEP-3 (Oak Ridge Thermal Ellipsoid Plot) (Figure 3) and Mercury (Figure 4). Piperaquine was arranged without intramolecular and intermolecular H bonding. Crystallographic data for piperaquine were deposited with the Cambridge Crystallographic Data Center (CCDC) with a supplementary publication number of CCDC-1030995.
(Color online) ORTEP drawing of molecular structure of piperaquine with the labeling of non-H atoms.

(Color online) Crystal packing of piperaquine.

Crystal and experimental data of piperaquine.

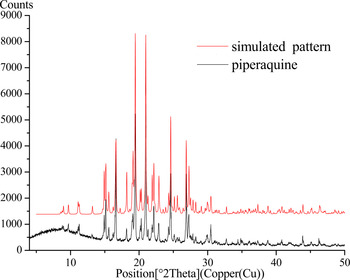
The comparison of X-ray powder diffraction pattern with the simulated pattern is shown in Figure 5. Results showed that both single-crystal and powder diffraction methods can get similar structure data.
(Color online) X-ray powder diffraction pattern of piperaquine using CuKα radiation and the simulated pattern of crystal structure.

SUPPLEMENTARY MATERIALS AND METHODS
To view supplementary material for this article, please visit http://dx.doi.org/10.1017/S0885715615000524
ACKNOWLEDGEMENTS
This work was supported by the Applied Basic Research Project of Sichuan Province (Grant No. 2014JY0042), the Testing Platform Construction of Technology Achievement Transform of Sichuan Province (Grant No. 13CGPT0049), and the National Development and Reform Commission and Education of China (Grant No. 2014BW011).