For if the persons are not equal, they will not have equal share; it is when equals possess or are allocated unequal shares, or persons not equal equal shares that quarrels and complaints arise. (Aristotle from Nichomachean Ethics)
Concerning the head of a State or a Family, I have heard the saying: he is not concerned lest his people should be poor, but only lest what they have should be ill-apportioned. He is not concerned lest they should be few, but only lest they should be divided against one another. (Confucius from Analects)
Over the past three decades or so, both mainland China and Hong Kong have experienced dramatic economic growth, accompanied by sharply increasing income inequality. As a successful model of a socialist transition economy, China's economic boom brought about an increase in GDP per capita by 8.8 times from 1978 to 2005, with an annual growth rate of about 9 per cent.Footnote 1 A renowned showcase of laissez-faire capitalism, Hong Kong's economy took off in the 1970s and was successfully transformed to a regional hub of business services in the 1990s, with an annual rate of 5.8 per cent from 1971 to 2001 in the growth of GDP per capita.Footnote 2
Despite the fact that the paths of economic development in these two Chinese societies may not be comparable in many aspects, both have been accompanied by a rapid increase in income inequality.Footnote 3 This defies the inverted U-shaped relationship between economic growth and income distribution observed in many other countries: that economic development first leads to an increase and then, beyond a certain point, to a decrease in income inequality.Footnote 4 The Gini coefficient of household disposable income per capita in China increased from 0.224 in 1985 to 0.449 in 2003.Footnote 5 In Hong Kong, the Gini coefficient of household income rose from 0.43 in 1971 to 0.45 in 1981 and further to 0.48 in 1991. A recent study revealed that Hong Kong's Gini coefficient was over 0.533 in 2006,Footnote 6 placing the city among the most income-unequal societies in the world, alongside the poorest African and Latin American countries.
With reference to past socialist egalitarianism, the sharp increase in income inequality has caused widespread social discontent that concerns policy makers in China. Some scholars have warned that high income inequality in China has far surpassed the threshold that could jeopardize social and political stability in the country.Footnote 7 Income inequality in Hong Kong, on the other hand, has always been maintained at a high level (with Gini coefficients above 0.4 over the past 25 years), and the public's discontent is not as pronounced as it is in mainland China, although income distribution has been used for political mobilization to press for democracy since 2003 in Hong Kong.Footnote 8
The contrast between China and Hong Kong in terms of public responses to increasing income inequality leads to a puzzling question: what amount of income inequality can be called “large”? In other words, what income gap is considered to be reasonable and what considered to be problematic? What are the social and political implications for the rising income inequality? This article makes a distinction between equality and equity in income distribution and argues that the perceptions of inequality and distributive justice, which invoke normative judgements concerning income inequality, are directly linked to public discontent and political action. Such normative judgements are based on the dominant cultural values and political ideologies of the society.Footnote 9 In this sense, China and Hong Kong provide two interesting cases for comparative studies because they share the Chinese culture but differ diametrically in ideological orientation towards inequality: one is associated with egalitarian socialism and the other with laissez-faire capitalism. Based on survey data collected in China (2005) and Hong Kong (2007), I examine the people's tolerance of inequality, their perceptions of legitimate earnings inequality and opportunities in the two Chinese societies, and how they differ from each other and from other countries.Footnote 10 Such analyses will shed new lights on the social and political consequences of rising income inequality in mainland China and Hong Kong.
Limitations of the Gini Coefficient as a Measure of Income Inequality
Among measures of income inequality, the Gini coefficient has remained the most popular, at least in part because of its ease of interpretation.Footnote 11 Many social commentators in mainland China and Hong Kong have cited the Gini coefficient to illustrate the growing income disparity seen in recent years, and some even suggested that the Gini coefficient should be used to monitor social and political stability: 0.2 or lower – egalitarian, 0.2 ~ 0.3 – relatively egalitarian, 0.3 ~ 0.4 – reasonable, 0.4 ~ 0.5 – alerting and above 0.5 – dangerous. According to this criterion, China's income inequality is approaching the dangerous zone.Footnote 12
However, the Gini coefficient has many limitations in comparing income inequality across countries and over time. First, it can be calculated at different levels, such as household, household per capita or individual person, on which data are not always consistently available. In general, if non-working spouses, children and retirees in the household are included in the calculation, the Gini coefficient for household income is greater than that for household income per capita, which is greater than that for individuals' work income.
Secondly, measures of income inequality vary under different definitions of income. For example, in a comprehensive database on cross-country income inequality constructed by the World Institute for Development Economics Research of the United Nations University, Gini coefficients in China are calculated based on household gross income, or disposable income per capita, or expenditure or consumption per capita from different data sources,Footnote 13 and there is no consistent measure for the country over the period of economic reform from 1978 to 2005 (also see footnote 5). Comparing the coefficients across nations can also be problematic because the measure of income inequality may be subject to the influence of income taxes, the efficiency of income use, welfare benefits, life quality and purchasing power. Even within China, a great difference in cost of living exists between urban and rural areas.
Finally, even if the coefficients are consistently measured at the household level over time, a temporal trend in increasing inequality may reflect a change in family structure, such as household size, the number of working household members, the age distribution of household members, their health conditions and education attainments, and so on. For example, an upsurge in the number of elderly households in Hong Kong has led to a rapid rise in the number of low-income families and thereby to the increase in income inequality. In response to criticism citing the high Gini coefficient, the Census and Statistics Department published a thematic report on household income distribution in Hong Kong, pointing out the difficulties encountered in analysing and comparing Gini coefficients. According to the report, after adjustments for taxes and social transfers, the Gini coefficient is reduced from 0.533 to 0.475, and the trend towards increasing inequality has remained largely stable over the past ten years.Footnote 14
Based on solid statistical data analysis, this thematic report has received neither much criticism nor much attention by the public in Hong Kong. In contrast, a remark on the limitation of using Gini coefficients to measure income inequality by Professor Li Yining 厉以宁, a well-known liberal economist, encountered harsh condemnation by the Chinese public via the internet. According to Li,Footnote 15 because of the dual social structure in China, under which rural and urban residents differ greatly in income sources, living standards, consumption behaviours and lifestyles, a single Gini coefficient may have overstated the degree of inequality; had it instead been computed for rural and urban areas separately, both Gini coefficients would be between 0.32 and 0.35, which fall within a reasonable zone. Hence, the gap between rich and poor and the trends towards social polarization may not be as serious as suggested by the single Gini coefficient.
Li may be right to some degree, for reasons similar to those laid out in the thematic report by the Hong Kong Census and Statistics Department, and especially in terms of the social and political implications of the increasing income inequality. A Chinese farmer in rural Guizhou province could never imagine the life of a senior-level professional working for a multi-national firm in Shanghai. In this sense, pooling their statistics to compute an inequality index makes little sense, particularly in terms of how those who lag behind would respond to the income disparities. Indeed, analysis shows that it is not the most disadvantaged people such as peasants who are most angry about current patterns of inequality in China.Footnote 16
Therefore, while the Gini coefficient provides a very powerful tool for monitoring temporal trends in the income inequality in a country and for comparing income distributions across countries as long as the measures are consistent, it has two major limitations. On the one hand, it can be manipulated both by left-wing analysts seeking to decry extreme inequalities and by right-wing pundits wishing to demonstrate that inequality is not a serious issue. On the other hand, the objective calculations of the Gini coefficient, or any other measures of inequality, no matter how sophisticated, involve no normative judgement of how large the income gap in a country should be.Footnote 17
Chinese Exceptionalism? Rhetoric on Equity and Equality in Income Distribution
Parties involved in the policy debate about rising income inequality have rarely made an explicit distinction between equality (pingdeng 平等) and equity (gongping 公平). Equality is a measure indicating what the distribution of income actually is, whereas equity is an ethical judgement on what the distribution of income should be. If everyone receives an equal share regardless of their contribution and performance, equality is achieved but equity is not for those who worked harder.Footnote 18 From a functionalist perspective, inequality and stratification in resource distribution are necessary in any modern society,Footnote 19 but such differentiation must be legitimate according to the dominant values of the society; that is, those who get more must deserve more, and those who get less also must deserve less.
For a long time Chinese people were said to favour egalitarianism (pingjun zhuyi 平均主义), which is often linked both to the long Chinese cultural tradition and to the short socialist past in the mainland. As Confucius articulated in his Analects, “he is not concerned lest his people should be poor, but only lest what they have should be ill-apportioned” (bu huan gua er huan bujun 不患寡而患不均).Footnote 20 Such egalitarian mentality was further enhanced by the income distribution policy during the socialist era since the 1950s. Hence, to improve efficiency and boost productivity, economic reforms in the late 1970s emphasized breaking the “iron rice bowl” (tie fanwan 铁饭碗) and enlarging the income gap. The policy, articulated as “efficiency as priority and equity as supplement” (xiaolu youxian, jiangu gongping 效率优先, 兼顾公平), has essentially ignored the equity issue in income distribution for almost two decades. To address the sharply rising income inequality, recent policies have been shifted to “paying more attention to equity” (gengjia zhuzhong gongping 更加注重公平) under the rubric of “a harmonious society” (hexie shehui 和谐社会), which, in President Hu Jintao's 胡锦涛 words, “should feature democracy, the rule of law, equity, justice, sincerity, amity and vitality. … All the people can work to their fullest abilities, be paid according to their hard work and get on well with each other.”Footnote 21
In spite of this policy shift, liberal economists continue to dismiss the usage of Gini coefficients and insist that the current income disparities should not be a great concern.Footnote 22 Those who express serious concerns about increasing income inequality are often labelled as “resenting the rich” (choufu xintai 仇富心态) or having the “red eyes” disease (hongyan bing 红眼病), a Chinese colloquial term for jealousy. In Hong Kong, such rhetoric is rarely heard, but it was recently aroused when a local business tycoon made the controversial comment that “Hong Kong is the most communist place in China.”Footnote 23
The implicit assumption of the rhetoric is that equality (or egalitarianism) is desired among those who complain about high income inequality. On the other hand, Chinese people seem to tolerate high inequality and believe in individual effort and merit-based disparities, partially because the tradition of the imperial examination system provided a channel for social mobility.Footnote 24 This is consistent with some liberal economists' suggestion that education is an important way to reduce inequality. As long as “equality in opportunities” (jihui pingdeng 机会平等) is achieved, inequality in socioeconomic outcome, regardless of how large it is, would not be a problem.Footnote 25 If equality in educational opportunities can be achieved, would inequality based on education be considered acceptable? This question touches upon the fundamental value of a society, namely, what is considered to be fair (equitable).Footnote 26 The objective calculation of the Gini coefficient, or of any other sophisticated measures of inequality, cannot be a substitute for the normative judgement of inequality.
In my view, much of the public debate and the government's concerns are related to the issue of equity. Over the past few decades, empirical research on the origins and development of people's norms about the distribution of income has flourished in Western sociology.Footnote 27 This article contributes to the literature by providing an empirical investigation of Chinese people's perceptions of inequality and distributive justice. Based on survey data collected in China and Hong Kong, I attempt to answer the following questions: first, do Chinese people tolerate a high degree of inequality or do they favour egalitarianism; second, how do Chinese people in China and Hong Kong differ in their perceptions of pay equity (distributive justice); and finally, how is the perception of distributive justice associated with the perception of opportunities?
Data, Variables and Measures
I analyse data from the China General Social Survey (2005) and the Survey on Social Inequality and Mobility in Hong Kong (2007). The Chinese General Social Survey is an annual survey of a national representative sample of the adult population aged 18 or above in both rural and urban China (except for Tibet). It uses a multi-stage stratified random sampling method. First, 125 principal sampling units are selected from 2,798 county or county-level districts, stratified by region, rural and urban populations, and education levels, then four second-level sampling units are selected in each principal unit, two third-level sampling units are selected in each second-level unit, and finally, ten households are selected in each selected third-level unit. One eligible person aged 18 or above is randomly selected from each sampled household to serve as the survey respondent. In all, 10,372 completed interviews are included in the sample, 6,098 from urban areas and 4,274 from rural areas. Because urban residents are over-sampled to yield enough cases for examination of variations within cities, we use sampling weights to correct for this over-sampling to compute figures representative of the general population in China.Footnote 28 In this article, I restrict the sample to those aged between 18 and 60, giving a total of 8,696 individuals.
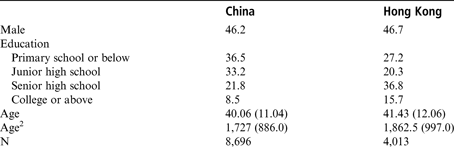
The Hong Kong survey is a large-scale, city-wide representative probability survey on social stratification and mobility among the adult population aged between 18 and 60. A two-stage stratified replicated sampling design is adopted for the survey. In the first stage, a random sample of addresses (or all households in the addresses sampled) is selected, with the type of housing and residential district as the stratification factor. This arrangement ensures that respondents living in different types of housing and different districts are sampled. In the second stage, a person aged between 18 and 60 in the sampled households is randomly selected and interviewed using the last birthday method. In all, 4013 interviews are included in the sample. To make the data representative of the general population, a weight is created based on the official statistics in terms of sex, age, education and household size from the 2006 Hong Kong population by-census data.Footnote 29 The descriptive statistics of the demographic characteristics for the samples are presented in Appendix A.
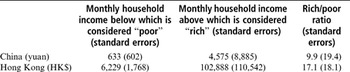
Both the China and Hong Kong surveys include some comparable questions on the subject's attitude towards income inequality and fair pay. First, respondents were asked about the perceived boundaries of “poor” and “rich.”Footnote 30 The ratio can be used to measure people's tolerance of income inequality.
Secondly, to make distinction between the empirical estimation of income inequality and ethical evaluations that people may have about their perceptions, respondents were asked to estimate how much people in particular occupations actually earn per month (“do earn”) and how much they should earn (“should earn”). In contrast to the large literature that has analysed statistical data to measure objective trends in income inequality, these questions capture people's perceptions and enable researchers to examine the issues more relevant to individuals' normative evaluations of income inequality. If the “do earn” and “should earn” are approximately equal, the income distribution can be construed as “fair.” By this measure, inequality and equity are empirically differentiable.
Finally, respondents were asked to answer a set of questions on their attitude towards inequality and perceptions of opportunities on a five-point scale (1 – strongly agree, 2 – agree, 3 – neutral, 4 – disagree, 5 – strongly disagree). These questions are linked to individuals' normative evaluations of income inequality in these two societies to account for why Chinese people have a high acceptance of inequality.
Results
Perceived boundaries of “poor” and “rich”
As mentioned above, respondents in both China and Hong Kong were asked about what average household income per month would be considered “poor” and what would be considered “rich.” Table 1 presents the mean monthly income considered as “poor” and “rich” in China and Hong Kong as a preliminary analysis of the difference in perception of inequality between the two Chinese societies.
Perceived Boundary for “Poor” and “Rich” in China and Hong Kong

Notes:
Data are weighted.
Sources:
China General Social Survey (2005); Hong Kong Social Inequality and Mobility Survey (2007).
As the results show, on average, respondents in China believe that a household monthly income below 633 yuan can be considered “poor” and a monthly income above 4,575 yuan can be considered “rich.” In Hong Kong, people believe that a household monthly income of HK$6,299 and below can be considered “poor” and a monthly income of HK$102,888 can be considered “rich.” The larger standard deviation of the second perceived figure suggests that there is much less consensus on what can be called “rich” than what can be called “poor” in both societies.
In the last column, I compute the rich-to-poor ratio, which indicates people's degree of tolerance of income inequality. In other words, as long as the household monthly income falls within the range, it is considered to be in the middle. A higher ratio indicates more tolerance of inequality. Results show that the ratio is 9.9 in the mainland and 17.1 in Hong Kong. As expected, the huge discrepancy suggests that people in the mainland are much less tolerant of income inequality than are people in Hong Kong, even though inequality measured by Gini coefficients is lower in China than in Hong Kong.
Actual and ethical inequality
In the China survey, respondents were asked to estimate the actual (“do earn”) and ethical (“should earn”) earnings of six occupations: farmers, peasant-workers, factory workers, professors, senior government officials (at provincial/ministerial levels) and executives in large state-owned enterprises. Lawyers and doctors were not included because these private-practice professionals are rarely visible to most Chinese people. In Hong Kong, eight occupations were included in this exercise: cleaners, factory workers, office clerks, lawyers, corporate executives, professors, doctors and senior government officials.
A key advantage of using the “do earn/should earn” questions is that many confounding factors can be held constant at the respondent level; that is, attitudes about what specific occupations “should earn” can be conditioned on what the individual believes they “do earn” so that individual errors in estimating actual earnings are directly controlled.Footnote 31 Moreover, these questions are clearly restricted to differences in the earnings of specific occupations thus avoiding complex issues such as household size, income sources, tax rates or welfare transfers. Indeed, these questions have also been used by International Social Survey Programmes elsewhere, thus enabling us to compare perceptions of distributive justice in China and Hong Kong with those in many other countries.Footnote 32
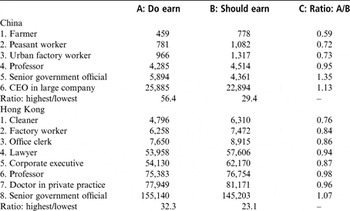
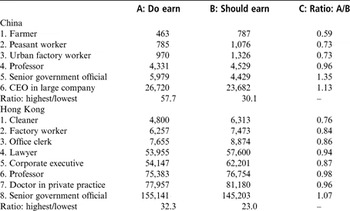
Table 2 presents the average monthly earnings of what respondents think that people “do earn” and “should earn” for the selected occupations in the mainland and Hong Kong. For example, Chinese farmers are estimated to earn 459 yuan per month and peasant workers 781 yuan per month. On the other hand, senior government officials at provincial/ministerial levels are estimated to earn 5,894 yuan a month and CEOs in large companies about 25,885 yuan a month. Even without the actual monthly earnings for these occupations, these figures make sense and are not far from reality. The highest paid occupation (CEO in large companies) earns 56.4 times more than the lowest paid (farmer).
Perceived Monthly Income Measured as “Do Earn” and “Should Earn” for Selected Occupations in China and Hong Kong

Notes:
Data are weighted.
Sources:
China General Social Survey (2005); Hong Kong Social Inequality and Mobility Survey (2007).
In the Hong Kong survey, the respondents estimate that cleaners earn about HK$4,796 per month and factory workers about HK$6,258, while doctors in private practice earn HK$77,949 per month and senior government officials HK$155,140. The highest paid occupation (senior government officials) earns 32.3 times as much as the lowest paid (cleaners). These figures are not objective but subjective assessments of actual pay. While the Gini coefficient indicates that earnings are distributed more unequally in Hong Kong than in China among the working population, mainland people tend to perceive higher income inequality than do people in Hong Kong.
Respondents were also asked how much people in these specific occupations should earn. The means of these “ethical” monthly earnings for these occupations are presented in Column B. Comparing Columns B and A suggests that in both China and Hong Kong, people generally believe that income inequality is very large and they favour less inequality, as expressed by higher “should earn” salaries for low-paid occupations and lower “should earn” salaries for high-paid occupations. Nevertheless, there is no evidence that people prefer absolute egalitarianism and want all occupations to be paid equally. In China, a gap of 29.4 times is considered acceptable, while a gap of 23.1 times is acceptable in Hong Kong.
One can also compare the “do earn” with “should earn” for each occupation and compute the ratio of Column A to Column B. An occupation is fairly paid if the ratio is close to 1, over-paid if the ratio is greater than 1 and underpaid if the ratio is less than 1. In China, people believe that, on the one hand, farmers are underpaid by 41 per cent ([1-0.59]*100), peasant workers are underpaid by 28 per cent and urban factory workers are underpaid by 27 per cent; on the other hand, managers and executives in large companies (most owned by the state) and senior government officials are overpaid, by 13 per cent and 35 per cent, respectively. This suggests that higher earnings for these two occupations, which are associated with public power and public assets, are considered less legitimate in China.
In Hong Kong, the sentiment about equitable pay is different. People believe that professionals like lawyers, doctors and professors are fairly paid (“do earn/should earn” ratios range from 0.94 to 0.98). However, they believe that cleaners are underpaid by 24 per cent and factory workers by 16 per cent. The only occupation that is considered overpaid is senior government officials, but the overpaid rate is only 7 per cent. This probably reflects the public's discontent with government policy on curbing income inequality. Interestingly, corporate executives are believed to be underpaid by 13 per cent. This may be because company size is not specified. A clear message from the ratio of “do earn” to “should earn” is that there is little egalitarian sentiment in Hong Kong. People's main concern about inequality is that the “poor” are too poor and thus need to be helped, but the “rich” are not said to be too rich. Perception of income inequality has therefore caused more widespread social discontent in mainland China than in Hong Kong.
One may argue that the “do earn/should earn” approach can give a misleading outcome if the perceptions of respondents on payment for their own occupation are taken into account, because few people will think that their jobs are overpaid. However, previous studies of occupational prestige show a consensus in rating occupational status, rather than respondents over-rating their own occupation.Footnote 33 This may also be applicable to occupational earnings. Appendix B presents the average monthly earnings of what respondents think that “people do earn” and what “people should earn” for selected occupations, excluding respondents' own occupations.Footnote 34 Results remain largely the same.
Pay equity: an international comparison
To place the results in a broader international context, I use the Gini coefficient to summarize each respondent's assessment of earnings inequality. Specifically, I calculate the Gini coefficients of estimates of actual earnings (“do earn” income) and ethical earnings (“should earn” income) among the listed occupations for each person. The ratio between the second Gini coefficient and the first indicates how much respondents' own estimate of the actual degree of inequality in pay among a range of occupations diverges from their own ethical inequality. This ratio is called the “fairness index.”
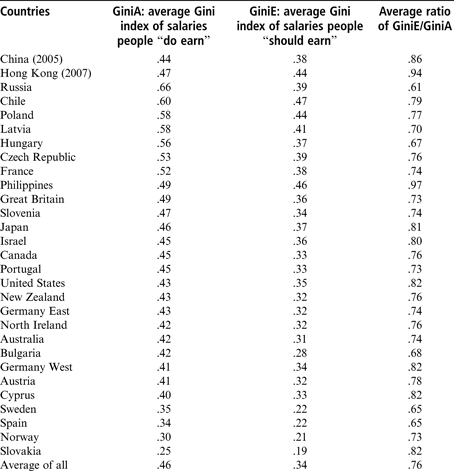
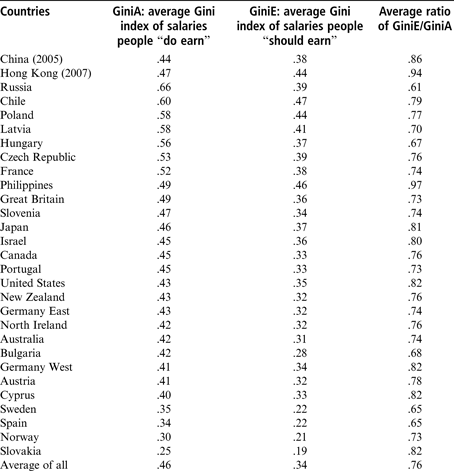
Table 3 presents the means of the two Gini coefficients and the fairness index in China and Hong Kong. Because the International Social Survey Programmes collected similar information in many other countries in 1999, I also include comparable figures from 27 countries varying by region, size, development level, institutional legacy and culture.Footnote 35
Perceived Actual and Ethical Inequality: Cross-Country Comparison
Notes:
Figures for other countries are calculated based on the data from the International Social Survey Programme, 1999 (see Lars Osberg and Timothy Smeeding, “‘Fair inequality’: attitudes towards pay differentials: the United States in comparative perspective,” American Sociological Review, Vol. 71 (2006), pp. 450–73, Table 3).
Results show that the Gini coefficient of the “do earn” income is 0.44 in China and 0.47 in Hong Kong. It should be noted that respondents' average estimates of the Gini coefficient are not estimates of income inequality in the labour market as a whole, because the occupations included in the surveys are only a small subset of all occupations.Footnote 36 There is a discrepancy between the actual Gini coefficient and the estimated Gini coefficient in some other countries, particularly post-socialist countries. In Russia, for instance, whereas the actual Gini coefficient is 0.31,Footnote 37 the Gini coefficient estimated by Russian respondents is 0.66. The sentiment captured in the divergence between actual and estimated income inequality may have important social and political consequences.
The second column shows that the Gini coefficient for the “should earn” income is 0.38 for China and 0.44 for Hong Kong. This difference suggests that people in the mainland tolerate less income inequality than people in Hong Kong, a finding consistent with the results in Table 1. However, according to the international standard (an average of 0.34), the perception of ethical (“should earn”) earnings inequality is high in both Chinese societies. Chinese people are therefore not particularly prone to egalitarian distribution of income.
Because people's perceptions of fair pay may be conditioned on how much inequality they think there is, the third column of Table 3 presents the ratio of the two Gini coefficients, which captures the acceptable perceived income inequality (fairness index). If the index equals 1, it means that the respondent considers the existing income inequality “fair”; the lower the index, the more unfair the respondent feels the existing income distribution is.
Again, respondents in both China and Hong Kong have high acceptance of the existing income inequality: the ratios are 0.86 and 0.94, respectively, whereas the average ratio for the other 26 countries is 0.76. Indeed, Hong Kong is ranked the second highest after the Philippines, and China is ranked the third highest. While determining if these figures are strictly comparable may require further investigation, the remarkable differences observed across countries suggest that respondents in both China and Hong Kong are more likely to think that income inequality is fair than are respondents in other countries, even though actual inequality has been very high in both societies.
For Hong Kong, the unusually high rate of acceptance of income inequality can be linked to the laissez-faire capitalism adopted since the colonial era. For a long time, Hong Kong has been considered as a land of opportunity where individual efforts and hard work will allow people to get ahead. This view has been constantly enhanced by the personal stories of successful businessmen and politicians who came from disadvantaged backgrounds.Footnote 38 Not incidentally, people in the United States, another “land of opportunity,” also have a high rate of acceptance of income inequality (the ratio is 0.82). The Gini coefficients that measure actual income inequality in both the United States and Hong Kong are among the highest of the high-income countries.
Probably as a result of the experience of socialist egalitarianism, Chinese people in the mainland seem to believe that income inequality is not as fair as the Chinese people in Hong Kong do. However, compared to other countries, people in the mainland still have very high normative support for income inequality. Kelly and Zagorski's researchFootnote 39 also found that people in Poland and Hungary, after the fall of communism, had more normative support for income inequality than their Western counterparts. In China, increasing income inequality has been perceived as a “necessary evil” to improve efficiency during the economic reforms.Footnote 40 China's rapid economic growth in the past few decades has also created a perception of new opportunities for those who have lagged behind.
Attitude about inequality and perception of opportunities
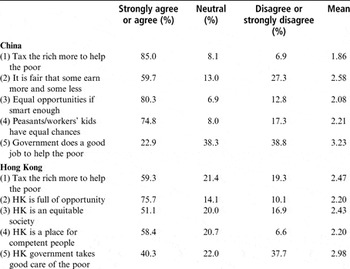
The extent to which people perceive income inequality to be equitable may be associated with the perceived opportunities in the society. In both the China and Hong Kong surveys, respondents were asked to answer a set of questions to measure their attitude towards inequality using a five-point scale (from strongly agree to strongly disagree). The five questions were not identical in the two surveys but were all related to attitudes towards inequality and perceptions of opportunity. Table 4 presents the respondents' answers to those questions (in percentages). For brevity, I aggregate “strongly agree” and “agree” into one category and “disagree” and “strongly disagree” into another. However, the mean is calculated on the five-point scale, with “strongly agree” coded as 1 and “strongly disagree” as 5. Therefore, a mean score lower than 3 (the average) indicates an attitude leaning towards “agree.”
Attitude about Inequality and Perception of Opportunities

Notes:
Data are weighted.
Sources:
China General Social Survey (2005); Hong Kong Social Inequality and Mobility Survey (2007).
Nearly 85 per cent of mainland respondents and 60 per cent of Hong Kong respondents agreed to tax the rich more to help the poor. Despite the general support for this leftist policy, people believe that there are still sufficient opportunities in both societies: in China, 80.3 per cent of respondents believe in “equal opportunities if smart enough” and 74.8 per cent agree that “peasants' and workers' children have equal chances”; in Hong Kong, 75.7 per cent of respondents agree that “Hong Kong is full of opportunities” and 58.4 per cent agree that “Hong Kong is a place for competent people.” On the other hand, many respondents do not think that the government has done sufficient work to curb the rising income inequality: only 40.3 per cent agreed that “the Hong Kong government takes good care of the poor” and an even lower percentage (22.9 per cent) in China stated that “the government did a good job to help the poor.”
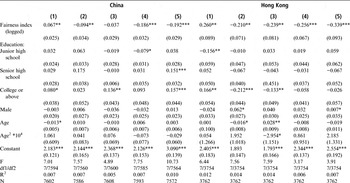
To what extent are the attitudes towards income inequality and perceptions of opportunities related to the fairness of income distribution in people's minds? Table 5 reports the results of a series of OLS regressions of the attitudes evaluated on the five-point scale on the fairness index.
Attitude about Inequality and Perception of Opportunity and Fairness in China and Hong Kong

Notes:
Data are weighted. Figures in the parentheses are standard errors. ***p < .001 **p < .01 *p < .05.
Because this index is highly skewed, I take the logarithm of the fairness index as the main independent variable in the linear regression analysis, and include education, gender, age and age square as the control variables. Education is measured in four levels and converted to three dummies in the model, and male is coded as a dummy variable (yes = 1). Except for question 3 in the China survey, the results show that the fairness index is a significant predictor of a person's attitude towards inequality. In both China and Hong Kong, if people believe that the perceived actual income distribution is fairer, they tend to disagree to tax the rich to help the poor (indicated by the positive coefficient) and tend to agree that there are equal opportunities and merit-based competition in the society (indicated by the negative coefficient). Hence, the relationship between the fairness index based on the “should earn” and “do earn” ratio and the perceptions of opportunities are associated with each other. Because of data limitation, the causal relationship cannot be established. A single index of fairness thus can be used to examine the social and political consequences of distributive justice in future research.
Summary and Conclusions
To sum up, this article has adopted a different approach to examining increasing income inequality in two Chinese societies with distinct institutional legacies: reforming socialist China and laissez-faire capitalist Hong Kong, both suffering from high income inequality. I make a distinction between equity and equality in the discussion of the social and political consequences of increasing income inequality. In particular, I argue that whether an income gap is large or not is subject to the normative/value judgement of the public. In this respect, both culture and institutions play an important role in legitimizing income inequality.
Using survey data collected in China and Hong Kong, I compare people's attitudes about income inequality and their perceptions of opportunities, and by implication their attitudes about government policies. The results dismiss the conventional wisdom that Chinese people tend to favour absolute egalitarianism. Instead, the analysis reveals that both societies have certain degrees of tolerance for income inequality, although respondents in China appear to be less tolerant of income inequality than those in Hong Kong.
A unique feature of the data analysed in this article is that respondents were asked to estimate the “do earn” and “should earn” income for a list of occupations, following the designs used in the International Social Survey Programme. Comparing the “do earn” and “should earn” income for each occupation shows that people in Hong Kong believe that the pay is fair in general: workers in each occupation deserve what they are paid except for those in the low-status occupations, who are underpaid, and senior government officials, who are slightly over-paid. In contrast, in China, although people also believe that farmers and workers are underpaid, they think that senior government officials and executives in large state-owned companies are overpaid by a large amount. This may explain why income inequality has led to a high degree of perceptions of unfairness and wide social discontent in the mainland.
Compared to most other countries with available data, both mainland and Hong Kong respondents have a very high rate of normative acceptance of income inequality. The Gini coefficients of “do earn” and “should earn” income are calculated to measure perceived inequality and legitimate inequality. The results suggest that perceived income inequality is not distorted in reality, that is, people have recognized the high income inequality in their societies. On the other hand, this high inequality is considered legitimate, as indicated by the fairness index determined by the ratio of the two Gini coefficients.
Why do people think that high income inequality is fair? I further examine perceived opportunities in China and Hong Kong based on a set of attitude questions and their relationships with the fairness of perceived income inequality. I found that both mainland and Hong Kong respondents are surprisingly optimistic about opportunities for social mobility and this is positively associated with their sense of the fairness of income distribution.
The perception of distributive justice also affects their support of government tax policies and their evaluation of government performance in addressing the problem of large income disparities. If people feel that the income distribution is unfair, they are more likely to support left-wing initiatives to tax the rich more to help the poor, and they are more likely to disagree with the statement that the government has done a good job to help the poor. Such subjective evaluations may lead to further political participation.
The findings of this article suggest the importance of a subjective dimension, which has largely been neglected, in studying the relationship between inequality and social/political stability in a society. As John Rawls put it, “a society is well-ordered, when it is not only designed to advance the good of its members but when it is also effectively regulated by a public conception of justice.”Footnote 41 Therefore, high inequality measured by Gini coefficients in the two Chinese societies may not necessarily lead to continuous and unsettling struggles that could challenge the legitimacy of the social institutions and the state, because there is a core Chinese belief that talent, education and hard work are the key routes to economic success as well as an optimistic perception of opportunities for mobility. This conclusion does not mean that political leaders in China and Hong Kong should not seriously address the problems of rising income inequalities, particularly the unmet needs of the most disadvantaged. Rather, if well informed about the subjective factors in income distribution, policy makers could do more to alleviate the social discontent and anger about rising inequality that may pose great challenges to social and political stability.
Descriptive Statistics for Demographic Characteristics of the Samples Included in Analysis: China and Hong Kong Surveys
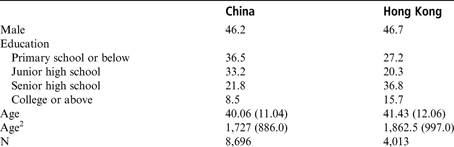
Notes:
Data are weighted. Figures in the parentheses are standard errors for continuous variables.
Sources: China General Social Survey (2005); Hong Kong Social Inequality and Mobility Survey (2007).
Perceived Monthly Income Measured as “Do Earn” and “Should Earn” for Selected Occupations in China and Hong Kong (Excluding Respondents' Own Occupation).

Notes:
Due to data limitation, respondents' occupations cannot be matched exactly to the listed occupations here. In calculating the averages of “do earn” and “should earn” for a specific occupation, I exclude respondents with approximately similar occupations.
Sources:
China General Social Survey (2005); Hong Kong Social Inequality and Mobility Survey (2007).