Introduction
Carbon nanotubes (CNTs) have drawn tremendous attraction due to their excellent electrical, mechanical, and thermal properties in the applications of conductive and high-strength composite materials, smart structures, energy conversion and storage devices, chemical sensors, and nanoelectronic devices, probes, and interconnects [Reference Liu, Sun, Lin, Zhou, Wang, Fan and Jiang1, Reference Kang, Heung, Kim, Lee, Gollapudi, Subramaniam, Narasimhadevara, Hurd, Kirikera, Shanov, Schulz, Shi, Boerio, Mall and Ruggles-Wren2, Reference Han, Yu and Ou3, Reference Martin, Che, Lakshmi and Fisher4, Reference Li, Lu, Ye, Cinke, Han and Meyyappan5, Reference McEuen, Fuhrer and Park6]. Several major techniques have been developed to synthesize CNTs, such as arc-discharge [Reference Journet, Maser, Bernier, Loiseau, de la Chapelle, Lefrant, Deniard, Lee and Fischer7], laser ablation [Reference Scott, Arepalli, Nikolaev and Smalley8], gas-phase catalytic growth from carbon monoxide [Reference Nikolaev, Bronikowski, Bradley, Rohmund, Colbert, Smith and Smalley9], and chemical vapor deposition (CVD) from hydrocarbons [Reference Cassell, Raymakers, Kong and Dai10]. Although arc-discharge and the laser ablation techniques are simple and straightforward, they are limited in lab-scale production. In addition, product recovery and purification for these techniques are very laborious. Due to these limitations the gas-phase catalytic growth and CVD techniques have been developed, where CNTs are produced by decomposition of carbon-containing gases. As seen from various CVD applications, large-scale production of well-aligned CNTs with high yield and purity is possible [Reference Baddour and Briens11]. However, these techniques normally require sophisticated procedures and instruments, such as vacuum or inert gas protection, high energy density, high temperature, and/or high atmospheric pressure, which make them costly. Moreover, poor solubility and dispersibility are other issues due to strong van der Waals force that restricts the application of CNTs, especially in reinforcing composite materials [Reference Premkumar, Mezzenga and Geckeler12]. This dispersibility issue can be resolved by growing the CNTs into carbon fibers through conventional thermal heating [Reference Fraczek-Szczypta, Bogun and Blazewicz13] and CVD methods [Reference Thostenson, Li, Wang, Ren and Chou14], but the reaction setup is still time-consuming, expensive, energy inefficient, and complicated. In this regard, microwave-assisted heating has been considered as an alternative approach due to its incredible advantages, such as rapid volumetric heating, high selectivity, higher reaction rate, reduced reaction time, and increasing yields of products, compared with conventional heating methods [Reference Zhang and Liu15].
Microwave technology has been commonly applied in material synthesis as a major energy source in heating the components in the reactions. Among the large number of microwave-assisted chemical reaction systems, solid state reactions are more scarce compared with the liquid-mediated systems, especially the solid state reaction systems using semiconductor/conductor as the microwave absorber. For example, in our earlier studies, conducting polypyrrole (PPy) powders with moderate conductivity were used as the active component in the microwave-assisted reaction [Reference Liu, Wang, Kushvaha, Poyraz, Tippur, Park, Kim, Liu, Bar, Chen and Zhang16]. Upon microwave irradiation, these conducting polymers generated tremendous heat within a very short period, i.e., 15 s, to convert another reactant, the orange-colored ferrocene powder to black CNTs, which will automatically grow on the conducting PPy substrate. This facile approach can be translated to many other reaction systems to make different nanocomposites [Reference Liu, Wang, Kushvaha, Poyraz, Tippur, Park, Kim, Liu, Bar, Chen and Zhang16, Reference Liu, Zhang, Wang, Poyraz, Cook, Bozack, Das, Zhang and Hu17, Reference Liu, Chen, Zhang, Poyraz, Guo, Zhang and Zhu18, Reference Liu, Zhang, Poyraz, Zhang and Xin19, Reference Liu, Zhang and Xin20, Reference Liu, Zhang, Poyraz, Smith, Kushvaha, Tippur and Zhang21, Reference Poyraz, Flogel, Liu and Zhang22, Reference Poyraz, Cook, Liu, Zhang, Nautiyal, Hohmann, Klamt and Zhang23, Reference Poyraz, Liu, Liu and Zhang24, Reference Poyraz, Zhang, Schroder and Zhang25]. In this work, we plan to use similar strategy to synthesize CNT-grafted carbon black and graphene, i.e., use microwave irradiation to heat the carbon black or graphene, for the decomposition of ferrocene precursors to hopefully grow CNT in situ on the surfaces of the carbon substrates. Our hypothesis is that the CNT growth on the carbon surfaces is dependent on the surface energetic states and binding site distribution of the carbon materials used. Materials with higher surface affinity, in another words, more reactive materials, get better CNT growth on the surface. To test our hypothesis, the general surface energetic states of carbon substrates will be measured to correlate with the quality of CNT growth.
Adsorption calorimetry has been used to quantify the surface energetics of nanomaterials and binding site distribution of heterogeneous catalysts and porous matrices [Reference Wu, Guo, Sun and Navrotsky26, Reference Wu, McDonald, Quan, Ushakov, Zhang, Long and Navrotsky27, Reference Wu, Guo, Sun and Navrotsky28, Reference Wu, Gassensmith, Gouveîa, Ushakov, Stoddart and Navrotsky29, Reference Wu, Guo, Sun and Navrotsky30, Reference Wu and Navrotsky31, Reference Navrotsky, Ma, Lilova and Birkner32, Reference Navrotsky, Mazeina and Majzlan33, Reference Ushakov and Navrotsky34]. We found that, in general, adsorption of probe molecules favors the most exothermic binding at near-zero coverage. Subsequently, the adsorption tends to be less exothermic until reaching plateaus representing surface sites of the same energetic states. Multiple plateaus may appear as a function of gas/vapor pressure or loading, indicating surface site distribution.
Here, to further our understanding of microwave-assisted fabrication of CNTs on different carbon surfaces, integrating two unique methodologies, microwave-assisted CNT synthesis and adsorption calorimetry, we attempted to perform a calorimetric study on the surface energetics of a model system with four carbon-based samples, including two substrates, carbon black and graphene, and CNT-grafted carbon black and graphene. Specifically, the enthalpies of ethanol adsorption were directly measured at 25 °C. We also interpreted and discussed the evolutions of partial molar entropy and chemical potential of ethanol adsorption as the ethanol loading on sample surface increases. Our study on this model system demonstrated that ethanol adsorption calorimetry could serve as a tool to explore the energetic landscape of carbon materials.
Results and discussions
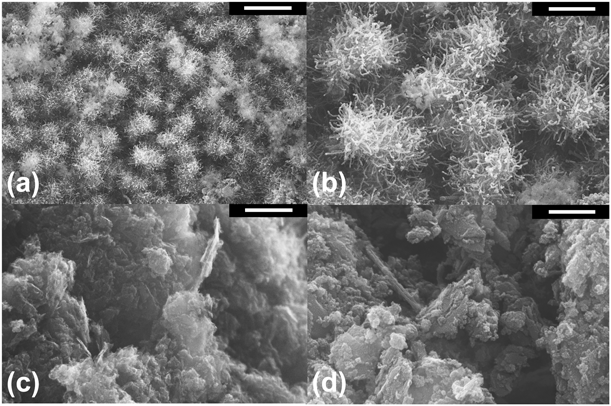
The growth and morphology of CNTs on carbon black and graphene powders were revealed by scanning electron microscopy (SEM). After microwave irradiation, CNT forests were grown intensively over the carbon black particles, covering nearly the entire surface with extruded, entangled nanofibrous assembly [see Figs. 1(a) and 1(b)]. On the other hand, owing to the thick flake–like morphology of graphene, it is challenging to observe the growth of CNTs on graphene substrate with the current SEM resolution [Figs. 1(c) and 1(d)].
SEM images of (a, b) CNT-grafted carbon black powder and (c, d) CNT-grafted graphene powder. Scale bar: (a) 3 µm, (b–d) 1 µm.

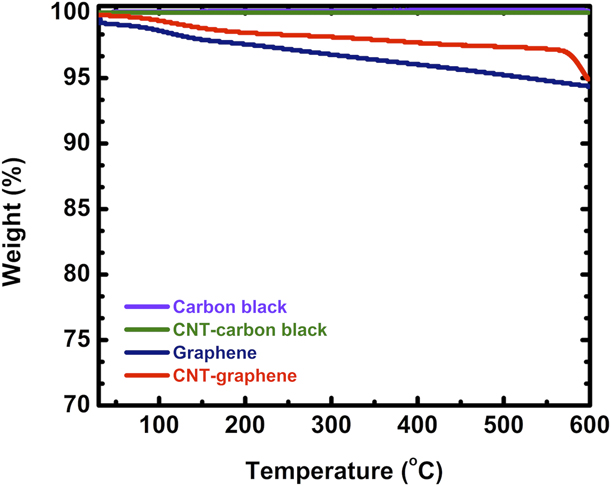
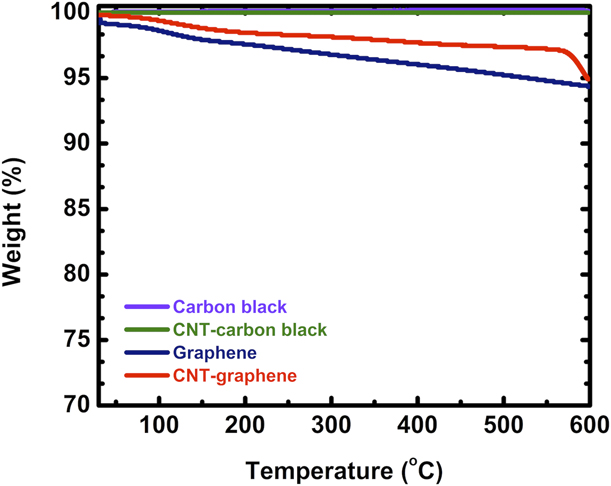
The thermogravimetric analysis (TGA) profiles are presented in Fig. 2. All samples analyzed show weight loss less than 5 wt% even at 600 °C. This is because all these carbon samples have been treated at temperatures above 600 °C prior to TGA experiments, either during carbon substrate synthesis or during microwave-assisted fabrication of CNTs. In addition, such minimal weight loss also highlights the hydrophobic nature of these carbon samples. According to the TGA profiles shown in Fig. 2, we choose 200 °C as the degas pressure before nitrogen adsorption–desorption isotherm analysis and adsorption calorimetry. We anticipate hydrophobic sample surfaces, which are unfavorable to hydration and prefer to be bonded and covered by small organics, such as ethanol, hexane, and acetone.
TGA profiles of all samples studied.
The specific area of each sample is obtained by Brunauer–Emmett–Teller (BET) analysis on the nitrogen adsorption–desorption isotherm (see Fig. 3). The results suggest that after microwave-assisted CNT growth, the graphene-based materials exhibit a significant surface area decrease from 630.6 m2/g for graphene to 183.2 m2/g for CNT-grafted graphene, while both carbon black and CNT-grafted carbon black show comparable low surface area around 4 m2/g, specifically, 4.6 m2/g for carbon black and 4.1 m2/g for CNT-grafted carbon black. The low surface areas of carbon black–based samples are also directly reflected by the nitrogen adsorption isotherms with negligible uptake under the analysis condition. The surface area decrease phenomena for graphene-based samples are anticipated since high-temperature microwave treatment typically leads to significant particle growth and surface area decrease for nanomaterials. Notably, even after microwave synthesis at temperature higher than 1000 °C, CNT-grafted graphene still has a relatively high surface area of 183.2 m2/g. Unfortunately, the surface areas of carbon black and CNT-grafted carbon black samples are too low to allow subsequent adsorption calorimetry analysis. Therefore, we merely performed ethanol adsorption calorimetry on the graphene substrate and CNT-grafted graphene.
Nitrogen adsorption–desorption full isotherms (−196 °C) of all samples studied.

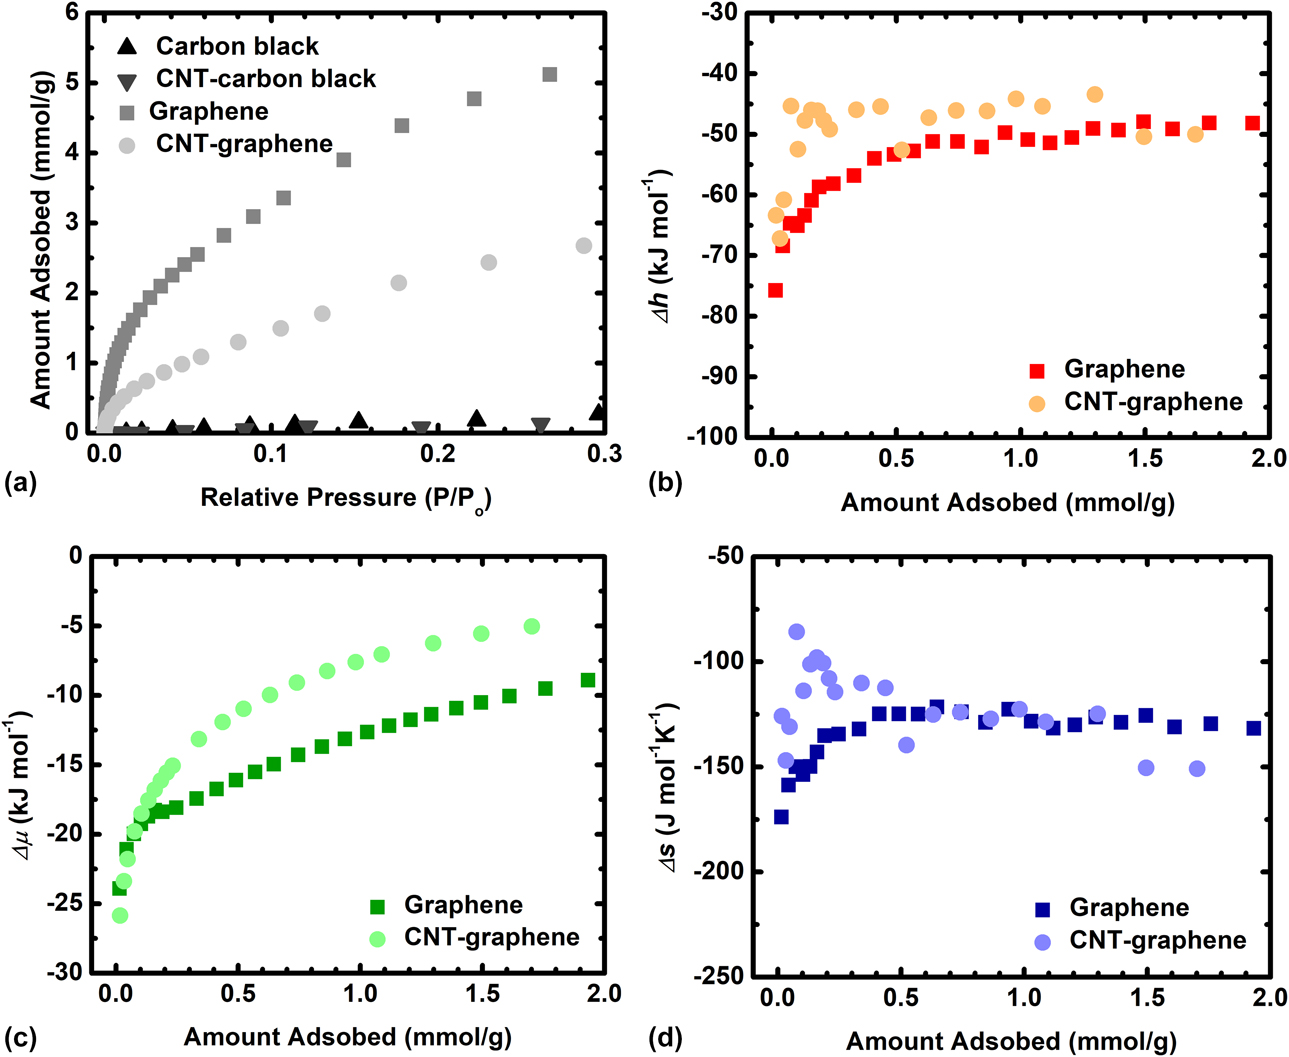
The ethanol adsorption calorimetry results are plotted in Fig. 4. Generally, ethanol adsorption from high vacuum to vapor saturation leads to type II isotherm, suggesting favorable adsorbate–adsorbent interfacial binding, followed by adsorbate–adsorbate intermolecular interactions on (ethanol–ethanol lateral hydrogen bonding within the monolayer) or above the adsorbent surface (ethanol multilayer or cluster formation) [see Fig. 4(a)]. The differential enthalpies of ethanol adsorption curves are presented in Fig. 4(b). Specifically, at near-zero surface coverage, the differential enthalpy of adsorption is −75.7 kJ/mol ethanol for graphene substrate and −63.4 kJ/mol ethanol for CNT-grafted graphene. It is very likely that after the microwave synthesis process, the surface defects of the graphene substrate, which lead to more exothermic binding, are repaired by the high temperature at above 1000 °C. Similar phenomena have been observed in our earlier studies on other solid-state materials, in which the thermally treated silica glass sample presents less exothermic ethanol adsorption enthalpy at near-zero coverage [Reference Wu, Guo, Sun and Navrotsky30, Reference Li, Sun, Xu, Guo and Wu35]. Subsequently, differential adsorption enthalpy of each sample tends to be less exothermic gradually and reaches an enthalpy plateau, indicating the conclusion of adsorbate–adsorbent interfacial interactions. Interestingly, the plateau position of the graphene substrate (−55.8 kJ/mol ethanol) appears to be more exothermic than that of the CNT-grafted graphene (−49.7 kJ/mol ethanol) by approximately 5–6 kJ/mol ethanol. This suggests that the surface energy of CNT-grafted graphene is probably slightly lower than that of the graphene substrate. Notably, the positions of these two plateaus are both more exothermic than that of the condensation enthalpy of ethanol at 25 °C, −42.3 kJ/mol ethanol. This is a strong evidence suggesting that ethanol–surface binding is more favorable than ethanol–ethanol interactions. Moreover, ethanol is able to wet and cover the surface of carbon as water does on nanoparticles and hydrophilic materials. Hence, ethanol is an appropriate molecular probe to explore the energetic landscape of carbon-based materials [Reference Navrotsky, Ma, Lilova and Birkner32, Reference Navrotsky, Mazeina and Majzlan33, Reference Ushakov and Navrotsky34]. In sharp contrast, in our earlier study, we found that surface binding of ethanol [Reference Wu, Guo, Sun and Navrotsky30] on calcite [Reference Wu and Navrotsky31] and silica glass results in ethanol clusters instead of ethanol layer covering the surface. This is because that at saturation, on these materials the ethanol–surface binding is less favorable than ethanol–ethanol intermolecular interactions.
(a) Isotherms and corresponding (b) differential enthalpies (c) chemical potential, and (d) partial molar entropies plots of ethanol adsorption at 25 °C on graphene substrate and CNT-grafted graphene.
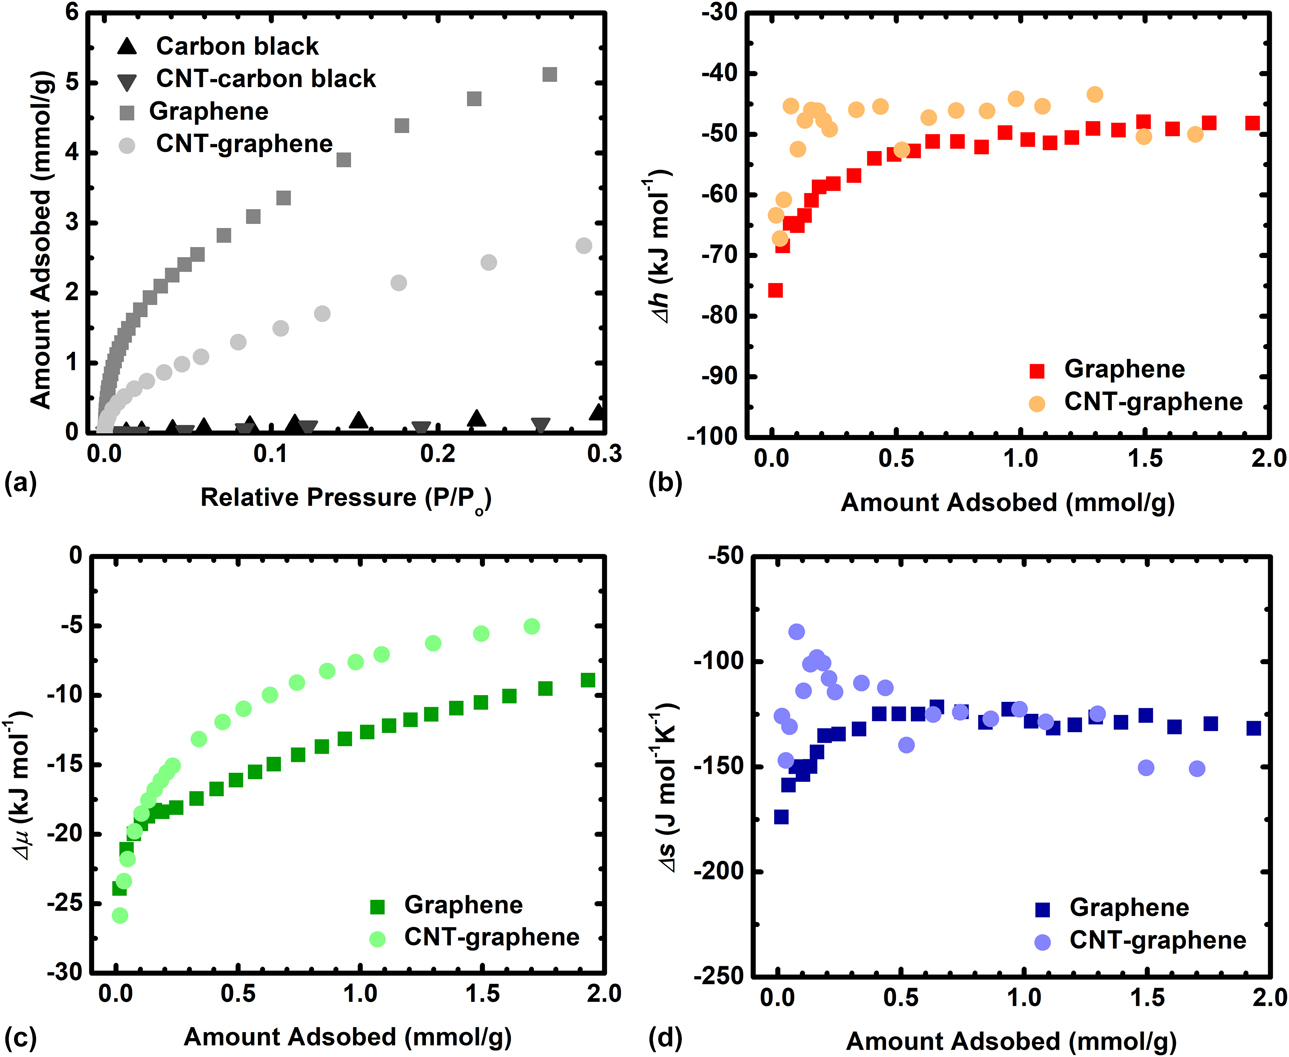
We further derived the partial molar properties of ethanol adsorption, including chemical potential (partial molar free energy) and partial molar entropy of adsorption [see Figs. 4(c) and 4(d)] [Reference Wu, McDonald, Quan, Ushakov, Zhang, Long and Navrotsky27]. The chemical potential is directly converted from the ethanol adsorption isotherm using Δμ = RT ln(p/p o), in which p/p o is the relative pressure of ethanol. The partial molar entropy of adsorption plot is derived by using the following relation, Δμ = Δh − TΔs. The Δμ plot exhibits similar trend as that of enthalpy, less exothermic as the ethanol loading/coverage increases. At near-zero coverage, the steep ascent of the plot reflects strong driving force for ethanol–carbon surface binding. The differential entropy of ethanol adsorption plot appears to be less negative as ethanol pressure increases. The near-zero difference strongly suggests that upon saturation the ethanol layer is liquid-like, wetting the carbon surface [Reference Wu, Guo, Sun and Navrotsky30].
This calorimetric study on microwave irradiation fabricated CNTs on carbon substrates highlights the potentially important role of surface properties of the carbon substrate for growth of surface species. It is possible that metallocene–substrate interactions will determine the wetting (clustering or film coating) and distribution of the metallocene precursor on the substrate surface. Therefore, further exploration of the thermodynamics of substrate surfaces is necessary and will provide quantitative insights guiding the microwave-assisted CNT fabrication. In our subsequent studies, we plan to perform similar surface energetics results on a series of substrates for CNT growth. Examples include glass fibers, fly ash, and ceramics. Indeed, the impacts of surface energetic states and defects of carbon substrate also play critical roles governing the nanoparticle growth. Very recently, we have demonstrated that by chemically tuning the defect concentration on reduced graphite oxide (rGO) nanosheets, we successfully obtained FeF3·0.33H2O/rGO composites with well-defined interfacial bonding, high particle loading, and enhanced cycling stability [Reference Qiu, Fu, Zhan, Lu and Wu36]. The corresponding calorimetric studies on the FeF3·0.33H2O–rGO interfacial energies are being carried out.
Conclusions
In summary, we performed an adsorption calorimetric study to estimate the surface energetic states of two substrates and two products in microwave-assisted CNT growth, carbon black, graphene, and CNT-grafted carbon black and graphene. We have successfully measured the differential enthalpies of ethanol adsorption on the graphene substrate and CNT-grafted graphene at 25 °C. However, we were not able to perform adsorption calorimetry on the two carbon black-based samples due to their very low surface areas (∼4 m2/g). This study suggests that on the carbon materials we used, the ethanol–surface binding is preferred, while the ethanol–ethanol intermolecular interactions are less favorable. Therefore, ethanol adsorption calorimetry is an appropriate method to study the thermodynamics of carbon surfaces.
Experimental methods
Material fabrication—CNT growth on carbon substrates
CNTs were grown on different carbon substrates through microwave-initiated approach. In a typical preparation process, equal weight (∼50 mg each) of ferrocene powder and carbon substrate (i.e., carbon black, graphene, conducting polymers) were physically mixed in solid state using a speed mixer at 2000 rpm. Subsequently, the mixture was subjected to microwave irradiation at 1250 W for 30–60 s. The carbon substrates absorbed the microwave energy, which was converted to heat, leading to rapid temperature increase to above 1000 °C. During this process, microwave heating triggered the decomposition of ferrocene to iron catalyst and cyclopentadienyl, which served as the carbon source for CNTs formation. Other constituents were released in gaseous forms. Such fabrication of CNTs could be implemented on different carbon substrates by ultra-fast microwave irradiation under ambient conditions.
Scanning electron microscopy
The morphology of all samples was analyzed using SEM on JSM-7500F, JEOL (Tokyo, Japan) at an acceleration voltage of 20 keV with a working distance of 10 mm. A small amount of sample (powder) was shaken off on the carbon tape, attached on top of a 12.5 mm sample holder. The excess of powder was blown away carefully using compressed air. Subsequently, the sample was gold sputter-coated to create a thin layer (∼10 nm) of conductive metal prior to loading into the electron microscope.
Thermogravimetric analysis
TGA was carried out using a Netzsch STA 449 (Selb, Germany) instrument to obtain the weight percentage of pre-adsorbed species and to identify the degas pressure used of nitrogen adsorption–desorption and ethanol adsorption calorimetry experiments. In each measurement, about 20 mg of sample was placed in an alumina crucible. TGA data were collected from 30 to 600 °C at 10 °C/min in nitrogen flow (20 cm3/min).
Nitrogen adsorption–desorption isotherm analysis
Full nitrogen adsorption–desorption isotherm analysis was performed at −196 °C, in which a Micromeritics 3Flex (Norcross, Georgia) instrument was employed. Before nitrogen adsorption–desorption measurement, the sample was degassed at 200 °C to remove pre-adsorbed species. The BET equation was applied to calculate the specific surface area of each sample.
Ethanol adsorption calorimetry
The ethanol adsorption calorimetry at 25 °C was performed to investigate the surface energetics of the carbon substrates before and after CNTs formation [Reference Wu, Guo, Sun and Navrotsky28, Reference Wu, Guo, Sun and Navrotsky30, Reference Wu and Navrotsky31, Reference Li, Sun, Xu, Guo and Wu35]. The customized adsorption calorimetry setup we used features a gas dosing manifold (Micromeritics 3Flex, Norcross, Georgia) and a Calvet-type microcalorimeter (Setaram, Sensys, Evo, Setaram Instrumentation, Caluire-et-Cuire, France) [Reference Ushakov and Navrotsky34, Reference Li, Sun, Xu, Guo and Wu35]. In each experiment, about 20 mg of sample was introduced into one branch of a customized silica glass forked tube. The other branch of the forked tube was left empty acting as a thermodynamic reference. Then, we introduced the forked tube into the microcalorimeter, which was also connected to the gas dosing system for degas (<10−6 mmHg) at 100 °C for 24 h to remove pre-adsorbed species. In each calorimetric analysis, the ethanol vapor was dosed (1 µmol per dose) into the forked tube incrementally. After each dose, the system was equilibrated for 2 h to reach adsorption equilibrium, indicated by a flat calorimetric baseline. Each adsorption equilibrium resulted in a corresponding calorimetric peak. The ethanol adsorption isotherm and corresponding calorimetric curve were recorded simultaneously. The differential enthalpy of adsorption (kJ/mol) was calculated by integration of the area under the calorimetric peak (J/g), followed by dividing the amount of ethanol vapor adsorbed at equilibrium (mmol/g). A Calisto Processing software (AKTS, Akoustis Technologies Inc., Huntersville, North Carolina) was employed to integrate the peak area and analyze the calorimetric data.
Acknowledgments
This work was supported by the institutional funds from the Gene and Linda Voiland School of Chemical Engineering and Bioengineering at Washington State University. Di Wu and Xiaofeng Guo acknowledge the fund of Alexandra Navrotsky Institute for Experimental Thermodynamics. Xianghui Zhang and Chen Yang are supported by Chambroad Scholarship.