1 Introduction
According to engineering analyses, supermarkets appear to have ample, largely unadopted, energy- and emission-reducing investment options that pay back within only a few years (McKinsey & Company, 2009; Navigant Consulting, 2009; Carbon Trust, 2010). This situation is suggestive of an “energy-efficiency paradox” – the observation that households and businesses seem to forgo energy-saving investments that have a higher upfront cost than the alternative but are expected to save money in the long run due to reduced energy costs (Jaffe & Stavins, Reference Jaffe and Stavins1994; Klemick & Wolverton, Reference Klemick, Wolverton and Shogren2013). As fossil fuel combustion and industrial processes accounted for almost 80% of total greenhouse gas (GHG) emission increases between 1970 and 2010, better understanding of potential barriers to energy efficiency investment is an important area of research (IPCC, 2014).
Barriers to energy-efficient investment for supermarkets are of particular interest because they are the most electricity-intensive type of commercial building. Within supermarkets, the refrigeration system accounts for more than 40% of electricity consumption, on average (U.S. EPA, 2008a ). In aggregate, supermarket refrigeration alone accounts for 2–3% of energy consumption in U.S. commercial buildings (Navigant Consulting, 2009). Refrigeration equipment also typically relies on high global warming potential hydro-fluorocarbons as coolant. For the typical U.S. supermarket, GHG emissions more than double when the impact of refrigerant leaks is added to that of electricity consumption (U.S. EPA, 2011). In addition, U.S. energy efficiency standards do not apply to the refrigeration system as a whole, and many technologies and practices are not currently mandated. This is an important characteristic of the energy efficiency paradox, as the apparent potential for net cost savings to private firms is observed absent regulation.
While supermarkets are large energy users, energy and refrigerant account for a relatively small proportion of expenditures. Product inventory is the overwhelming expense in supermarket budgets (about 75% of sales), followed by labor (about 10% of sales); energy costs are about 1–2% of sales, and annual refrigerant replacement cost is well under 1% (King, Leibtag & Behl, Reference King, Leibtag and Behl2004; U.S. EPA, 2008a ; U.S. EPA, no date; FMI, 2015). This situation contrasts with other energy-intensive sectors such as heavy-duty trucking, in which energy use is one of the largest business expenses. In addition, the grocery industry is dominated by several large retail chains. In 2013, Walmart was the top grocery retailer, accounting for about 20% of U.S. sales; the top three traditional supermarket chains – Kroger, Safeway and Publix – together accounted for another 16% of sales (U.S. DOA, 2016).Footnote 2 However, frequent consolidation and divestiture across national and regional supermarket chains mean that rankings are fluid from year to year among the top 20 retailers, and competition for sales is intense. Because of low profit margins in the industry (about 1–2% of sales), reducing costs could have a sizable impact on the bottom line (U.S. EPA, 2008a ). One report notes that “a 10% reduction in energy costs for the average supermarket is equivalent to increasing net profit margins by 16%” (U.S. EPA, 2008b ).
The literature on commercial buildings highlights several potential barriers to adoption of energy-saving technologies. These include lack of information about energy consumption and split incentives (or principal-agent problems), especially in cases where the building owner is responsible for energy-consuming investments but the tenant pays energy costs. Analyses of commercial buildings in the U.S. and Germany have found that energy-efficient investments are more likely in owner-occupied space (Schleich & Gruber, Reference Schleich and Gruber2008; Andrews & Krogmann, Reference Andrews and Krogmann2009). However, other studies have shown that energy efficiency investments are fully capitalized into rents and sales prices in U.S. commercial buildings, suggesting minimal asymmetric information between landlords and tenants (or sellers and purchasers) (Eichholtz, Kok & Quigley, Reference Eichholtz, Kok and Quigley2010, Reference Eichholtz, Kok and Quigley2013; Papineau, Reference Papineau2013).
Behavioral anomalies such as anchoring bias, as well as institutional factors such as company size and earnings, have been shown to affect firm energy investment decisions (DeCanio, Reference DeCanio1998; DeCanio & Watkins, Reference DeCanio and Watkins1998; Klotz et al., Reference Klotz, Mach, Klapthor, Tunstall and Harrison2010). There could be scope for “rational inattention” to energy and refrigerant consumption if precisely optimizing these factors has a negligible impact on store profits (Sallee, Reference Sallee2014). Consistent with this explanation, analyses of commercial buildings have found that firms with lower energy use or energy intensity are less likely to adopt energy-efficient technologies (Schleich & Gruber, Reference Schleich and Gruber2008; Andrews & Krogmann, Reference Andrews and Krogmann2009; Schleich, Reference Schleich2009). Loss aversion, which could be relevant to commercial refrigeration given uncertainty in future energy prices and performance of new technologies, has been documented in the context of household investment decisions (Greene, Reference Greene2011; Greene, Evans & Hiestand, Reference Greene, Evans and Hiestand2013). However, competitive forces and market experience can moderate tendencies toward systematic behavioral failures in firms (List, Reference List2003, Reference List2004; Shogren & Taylor, Reference Shogren and Taylor2008).
Very few studies on the barriers to adopting energy-efficient technologies and practices in commercial buildings focus on supermarkets. Sullivan and Gouldson (Reference Sullivan and Gouldson2013) found that investments by United Kingdom (UK) supermarket chains to reduce energy and GHG emissions intensity were limited to technologies with an expected positive financial return. Ochieng et al. (Reference Ochieng, Jones, Price, Ruan, Egbu and Zuofa2014) found that UK supermarkets tended to focus on technologies that meet regulatory requirements, forgoing those with perceived negative effects on customer appeal. Other reports discuss the technological complexity, tradeoffs with customer appeal and reliability, and site-specific requirements as potential barriers to investing in energy efficiency for supermarket refrigeration (e.g., Navigant Consulting, 2009; Carbon Trust, 2010).
Given limited data to rigorously examine energy- and emission-reducing investments in supermarket refrigeration, we conduct focus groups and interviews to gain insight, or at least clues, into the potential for an energy efficiency paradox in this sector. Researchers have used qualitative methods to collect information on building energy management and design (e.g., Pellegrini-Masini & Leishman, Reference Pellegrini-Masini and Leishman2011; Gul & Menzies, Reference Gul and Menzies2012), and heavy-duty trucking fuel economy investments (Klemick, Kopits, Wolverton & Sargent, Reference Klemick, Kopits, Wolverton and Sargent2015a ).Footnote 3 Two studies also have used interviews to examine supermarket technology investments (Sullivan & Gouldson, Reference Sullivan and Gouldson2013; Ochieng et al., Reference Ochieng, Jones, Price, Ruan, Egbu and Zuofa2014).Footnote 4 While our approach represents a preliminary step toward understanding possible barriers to adoption of energy-reducing technologies in supermarket refrigeration, it could inform development of future surveys or quantitative research in this area. Information about perceived barriers most relevant for supermarket refrigeration may help guide which policy interventions might be appropriate for addressing them, or may suggest ways to improve the engineering-based payback calculations made by analysts to include the full cost of adoption.
The paper is organized as follows. Section 2 describes the methodology and key characteristics of participating supermarkets. Section 3 discusses adoption of energy- and emission-reducing refrigeration technologies and descriptive evidence of a “payback gap” – in which firms only adopt technologies whose operating cost savings offset higher upfront costs in substantially less time than equipment lifetime – among participants. Section 4 discusses descriptive evidence, gleaned from participants’ statements, of various barriers that might explain this gap. The final section concludes.
2 Methodology
The economics literature identifies three broad explanations for an energy efficiency paradox: market failures, behavioral anomalies, and analytical gaps in typical net present value (NPV) calculations (e.g., Gillingham, Newell & Palmer, Reference Gillingham, Newell and Palmer2009). Market failures that could lead to suboptimal firm investments include imperfect information about new technologies’ availability, performance, or other characteristics (e.g., Schleich & Gruber, Reference Schleich and Gruber2008); split incentives, in which the individual responsible for making investments does not bear the energy or refrigerant costs (e.g., Schleich & Gruber, Reference Schleich and Gruber2008; Andrews & Krogmann, Reference Andrews and Krogmann2009); and liquidity constraints if a firm cannot obtain financing to cover upfront capital costs.Footnote 5 Behavioral anomalies, which occur when individuals make decisions inconsistent with profit or utility maximization, could also inhibit technology adoption (e.g., Robinson & Hammitt, Reference Robinson and Hammitt2011; Sallee, Reference Sallee2014; Bernheim, Reference Bernheim2016). Analytical gaps between methods used to calculate engineering-based payback and how firms make investment decisions reflect factors not typically accounted for in NPV analyses that could affect the attractiveness of new technologies include tradeoffs with customer appeal or reliability, store-specific considerations, and higher opportunity costs of capital than assumed in engineering calculations (e.g., Klemick et al., Reference Klemick, Kopits, Wolverton and Sargent2015a ; Helfand & Dorsey-Palmateer, Reference Helfand and Dorsey-Palmateer2015).
2.1 Focus group and interview protocol
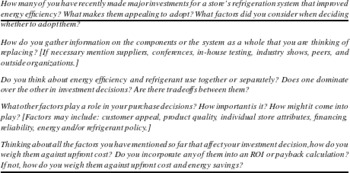
We follow a semi-structured funnel question design to facilitate discussion in the focus groups and interviews.Footnote 6 We begin by asking how firms make refrigeration investment decisions and what information sources they rely on to make those decisions. We then ask a series of questions about the roles energy efficiency and refrigerant leaks play in investment decisions. The questions are open ended to allow participants to identify factors we may not have anticipated (Table 1). Prompts to elicit information related to specific hypotheses from the literature are used as needed. Participant information collected via questionnaire on adoption of specific energy- and refrigerant-saving technologies is used to promote discussion of particularly appealing or unappealing features. We end by discussing the ways previously identified considerations are reflected in payback calculations, if at all, and reasons why firms require that investments payback over a relatively short time period. We used three nonanonymous interviews to pilot these questions.
Sample questions from the moderator’s guide.

After completing the interviews and focus groups, we performed content analysis to evaluate responses (Best & Radcliff, Reference Best and Radcliff2005). We used a directed approach to develop codes based on barriers to energy efficiency identified in the literature (Hsieh & Shannon, Reference Hsieh and Shannon2005). We tested the coding algorithm through independent classification of the same transcript, discussion of differences in coding, and revisions to the coding algorithm or its application to achieve consistency. We offer descriptive evidence about each barrier but stop short of summative content analysis.Footnote 7 The open-ended design of the focus group and interview protocol also makes comparisons using statistical tests of differences difficult to implement.
2.2 Participant screening and sample summary
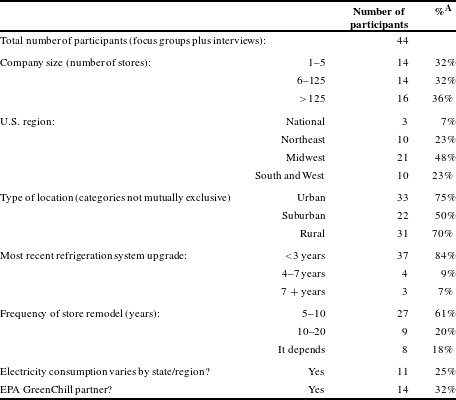
In 2013, we conducted focus groups and interviews with 44 managers and owners involved in major purchase and maintenance decisions for refrigeration systems at U.S. supermarkets.Footnote 8 Of the six focus groups, two were with small companies, three with medium-sized companies, and one with large companies.Footnote 9 The focus groups had an average of six participants. Eight phone interviews were conducted with representatives from one small and seven large companies.Footnote 10 We excluded hypermarkets (i.e., supermarkets combined with department stores such as Walmart) and wholesale clubs (e.g., Costco) since they are much larger, sell a wider range of goods, and dedicate a smaller portion of the store to refrigeration.
Participants were recruited through collaboration with state or national associations and industry experts.Footnote 11 Over 80% of the managers recruited participated in a focus group. There was no obvious pattern with regard to participation by company size, most likely because managers were already away from their stores for a conference. Company affiliation was used to avoid duplication when recruiting but was otherwise masked to protect participant confidentiality with the exception of three nonanonymous interviews. To ensure we did not only include industry leaders in reducing energy or refrigerant use, significant efforts were made to recruit firms that do not participate in EPA’s voluntary GreenChill program.Footnote 12 In spite of these precautions, we expect that participants are likely more interested in energy and technology issues, on average.
Supermarket participant summary.

A Percentage based on total number of participants.
Summary statistics demonstrate that companies are divided fairly evenly by size (Table 2). All regions are represented, with some companies having stores in multiple regions. Stores range from new to 60 years old (on average 22 years). Over 80% of participants reported making a major refrigeration upgrade within the last three years, though not necessarily in energy efficiency. Remodeling of stores occurs less frequently; about 60% of participants remodeled a store every five to ten years.Footnote 13 As discussed later in the paper, the remodel cycle is typically driven by a desire to enhance sales rather than energy efficiency. About a third of participants are GreenChill partners.
3 Do Participants’ Statements Indicate a “Payback Gap”?
We begin by discussing if there is a “payback gap” in investment decisions – i.e., supermarkets require energy savings to offset adoption costs in substantially less time than the amount of time that the technology will be in use. Participants’ statements in almost every focus group and interview indicated that supermarkets do indeed consider payback calculations when making energy efficiency related investment decisions and that the expected payback period for investments is much shorter than equipment lifetime. Several interviewees noted more flexibility for new stores, but paybacks were still substantially shorter than equipment lifetime. (Some interviewees declined to discuss their firm’s specific payback requirements.)
In many cases the metric most salient to participants for determining whether an investment will pay for itself was not the lifetime of the equipment but rather the likelihood that it would be replaced during the next major store remodel (recall this is a five to ten-year cycle for the majority of participants). One participant explained: “We like two-year paybacks, and I’ve gotten some stuff approved with three-and-a-half to four year paybacks. But you’ve got to remember …you may remodel that store in five years” (INT#5, LG). Based on the questionnaire, we find that 63% of participants replaced at least some of their display cases during a remodel. In addition, several participants retrofitted existing cases to add doors or LED lighting during a remodel. While focus group and interview discussions often centered on visible energy efficiency upgrades (e.g., display cases), questionnaire responses indicate that about half of the participants also upgraded components of the refrigeration system that are not visible to customers during a remodel (e.g. compressors, condensers).
Regarding emerging technologies, a few firms across three different focus groups expressed a willingness to experiment even if the payback period is longer. At least one participant piloted a new refrigerant in case it eventually meets their required return on investment (ROI). Some participants expressed a willingness to try emerging technologies for reasons that are difficult to quantify: “We did one project [that], even with incentives, [had] a seven-year payback. But it’s also [about] public relations – going green” (FG#3, MD).
Payback for specific technologies
A supermarket refrigeration system consists of many components that act together as one system. Display cases, compressor racks, condensers, and walk-in refrigerators and freezers are the major components. Display cases showcase refrigerated and frozen food items for sale; walk-ins and compressors are in the back of the store, not visible to the customer, and condensers typically are on the roof. While display cases and compressors are responsible for about 85% of the system’s energy consumption, engineering studies identify opportunities within all system components to improve energy efficiency at net cost savings (Navigant Consulting, 2009; Carbon Trust, 2010). In addition, there are potential savings from reducing leaks in the extensive network of piping that deliver refrigerant gas in a conventional system.
We asked participants about 26 existing and emerging practices and technologies that have been identified in recent studies to potentially improve energy efficiency or reduce refrigerant emissions across the key refrigeration components described above (Navigant Consulting, 2009; Carbon Trust, 2010; U.S. EPA, 2013). Practices and technologies expected to have the shortest payback periods (less than two years) according to published engineering estimates include advanced condenser design; high efficiency fan motors; floating head pressure in walk-ins; strip curtains and night blinds; leak detection and repair; recommissioning; cleaning, maintenance and repair; and adjusting store temperatures closer to the ambient temperature. Emerging technologies expected to have longer payback periods (over 8 years) include low-global warming potential (GWP) refrigerant alternatives and alternative system configurations to reduce refrigerant charge.
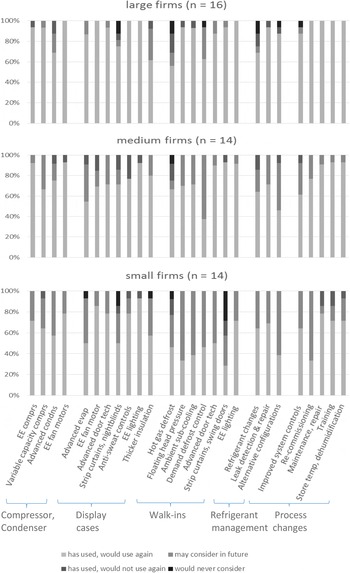
Participant use of refrigeration technologies, by firm size.

Figure 1 summarizes responses by firm size and major refrigeration component. In many cases adoption patterns broadly correlate with expected payback estimates. High efficiency fan motors; recommissioning; cleaning, maintenance and repair; and adjusting store temperature – all with short expected payback periods – are among the most widely used strategies. There are a few exceptions; technologies with relatively short payback periods that are less widely adopted include strip curtains and night blinds, hot gas defrost, and demand defrost controls. As discussed in Section 4.4, participants noted that tradeoffs associated with these technologies, such as reliability and aesthetic concerns, make them less attractive to adopt. Advanced refrigerant management strategies such as refrigerant changes and alternative system configurations, which are not necessarily expected to yield a positive ROI, are among the least widely used.
As Figure 1 indicates, adoption of many strategies was noticeably higher among large firms and lower among small firms. For example, aside from energy-efficient lighting, less than half of the smaller firms used energy-saving technologies for walk-ins. Only 38% of small firms tried alternative refrigerant system configurations, whereas 46% of medium-sized firms and 88% of large firms used them. This is true even among the most widely adopted technologies. For instance, only 71% of small firms adjusted store temperatures, while this technique was utilized by 93% of medium firms and 100% of large firms to reduce energy use.
Payback calculations
Participants in all the focus groups and interviews stated that their companies make payback calculations, but the level of sophistication varied by firm size and type of investment. Many of the larger firms used spreadsheets or other formal quantitative analysis. One interviewee stated, “[we] try to include everything that…has real value in the payback calculation” (INT#4, LG). Examples of factors that participants included in payback calculations were maintenance and repair costs, and utility incentives. The larger supermarkets paid a high degree of attention to the energy costs included in these analyses. One participant said, “You have to understand that energy is close to 50%, for the refrigeration systems alone, of our utility bill. So it’s definitely high on our radar” (FG#4, LG).
Several focus group participants indicated that while they rely on more sophisticated calculations when contemplating bigger investments, they do not always apply the same standard to analysis of small-scale investments. Others, particularly small companies, regularly rely on qualitative assessment. As one participant noted, “I look at ROI, but I don’t get into [the] deep detail of it. I just get an idea” (FG#2, SM). Another mentioned that to “put together a nice little spreadsheet with a return on investment analysis …doesn’t happen” (FG#1, MD). Others mentioned factors that, while important, are not considered in a quantitative calculation. For instance, “We don’t figure [maintenance costs] in dollars. We [ask], are parts easily available, how difficult are they to work on?” (FG#6, SM). Another participant noted, “How do you put a value on [customer appeal]? That appeal that you get is like a new car smell...I don’t know if it’s really quantifiable” (INT#6 LG, N-ANOM).
4 Do participants’ statements indicate barriers to technology adoption?
In this section, we discuss the participants’ statements from the focus groups and interviews about potential barriers to the adoption of energy- or refrigerant-reducing refrigeration technologies. We also discuss the extent to which any identified barriers may result from market failures or instead be characterized as costs that make technologies genuinely less attractive to firms but are not accounted for in typical engineering-based NPV analyses. When possible, we identify statements made by participants that are consistent with behavioral anomalies, though it is often not possible to separate out this effect from other explanations.
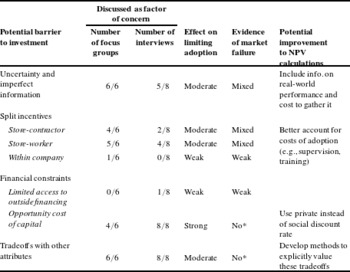
In particular, we organize the discussion around four general categories of potential barriers to technology adoption: uncertainty and imperfect information, split incentives, financial constraints, and tradeoffs with other valued attributes. For each of the four categories, Table 3 summarizes our results based on how often a particular barrier was discussed as a factor of potential concern (pervasiveness), the degree to which this barrier was identified as limiting adoption of energy efficiency related investments (strength), descriptive evidence that the barrier may result from a market failure, and potential improvements that could be made to engineering-based NPV calculations to address analytic gaps.
Evidence of barriers to investment and potential market failures.

* No is used when a barrier is not classified as a market failure, while weak is used to signal that while it is possible a barrier could be due to a market failure we find little evidence that this is the case.
While these measures are inherently subjective – they are based on our interpretation of participant statements – in general we find that some aspect of each potential barrier was a pervasive concern among participants. As discussed in detail below, there is also descriptive evidence that many of these factors moderately limit investment in refrigeration energy efficiency. However, only uncertainty/imperfect information and split incentives appear to be barriers that may result from a market failure. In those cases, we characterize the descriptive evidence as mixed because participants often developed strategies that at least partly overcome the primary investment barrier. Finally, in several areas, we suggest potential improvements to engineering-based NPV calculations that would better align these calculations with the way supermarkets actually make investment decisions.
4.1 Uncertainty and imperfect information
Past research has discussed the potential for underinvestment in technological innovation because the knowledge associated with such innovations typically has a public good component (Jaffe, Newell & Stavins, Reference Jaffe, Newell and Stavins2005). The market for energy-saving technologies is no exception; knowledge and technology adoption (i.e., learning-by-doing and learning-by-using) externalities have been identified as potential contributors to an energy efficiency paradox (Gillingham, Newell & Palmer, Reference Gillingham, Newell and Palmer2009; Gerarden, Newell & Stavins, Reference Gerarden, Newell and Stavins2015). Consistent with this hypothesis, participants in all focus groups and five interviews revealed a pervasive concern about uncertainty and lack of reliable information on the performance of new refrigeration technologies and a reluctance to be the first adopter (Table 3). In the discussion below, we highlight several statements indicating that uncertainty and imperfect information are barriers to technology adoption that represent a learning-by-doing or learning-by-using market failure. At the same time, some participants acknowledged that large chains play an important role in serving as early adopters and disseminating information about new technologies, suggesting that the barrier is only moderate in severity and that the market failure does not unduly inhibit technological progress in the industry.
Refrigeration technologies display certain characteristics that make waiting to invest attractive: They are “lumpy,” long lived, and irreversible; resale markets are thin or nonexistent; the timing of investments is often flexible; and new technologies entail risk given uncertainty about future system performance and electricity prices (McDonald & Siegel, Reference McDonald and Siegel1986). Researchers note that these features can contribute to the energy efficiency paradox because individuals expect a technology to improve over time with experience (Ansar & Sparks, Reference Ansar and Sparks2009). While this response is rational from the perspective of an individual supermarket, it is also potentially indicative of a market failure caused by learning-by-doing externalities if the benefit of waiting is a function of the cumulative number of systems installed.
As noted in Table 3, many participants expressed concern about the uncertain payoff and imperfect information associated with refrigeration investments. One explained, “Anything could happen. The environment changes. Things are variable. There’s no guarantee what your payback is going to be” (FG#6, SM). Another stated, “There is a lot of liability associated with running a supermarket chain, so the return on investment has to be commensurate with that liability or risk” (INT#8, LG, N-ANOM). Participants in two focus groups and one interview mentioned uncertainty regarding future refrigerant phase-outs as hindering adoption of some currently allowed refrigerants: “The lack of direction or predictability on the regulatory side has led us all to scratching our heads…. What’s right for right now? Will it be right in eight years? It also makes us slow adopters of new technology” (FG#4, LG). The three interviewees who did not express concern about uncertainty all represented large chains, indicating that this barrier may be more relevant for small and medium-sized firms in our sample.
Participants in five focus groups and four interviews specifically noted that uncertainty associated with new technologies spurred them to wait for other supermarkets to experiment first, suggesting positive externalities associated with the knowledge that stores generate when they test new equipment.Footnote 14 One participant explained, “I know somebody else eventually will be a beta site, and they’ll work through all the problems. I’ll be more than happy to be the second or third generation” (FG#1, MD). Participants in two focus groups and two interviews expressed a desire to be on the “leading edge” rather than the “bleeding edge” of new technology. (One small company even stated it wanted to avoid the “leading edge.”) This view was shared by some larger chains: “...there’s some uncertainty in what the future is going to look like; you want to hold what you’ve got for a little while, and see who’s doing what” (FG#4, LG).
Other managers highlighted that recent improvements in refrigeration technologies justified their previous reticence to invest. Several participants noted recent improvements in technology options and information: “… it’s far more predictable now than it was five years ago. You know you’re going to get energy savings” (FG#4 SM), and “It’s probably easier today to get information than it’s ever been” (INT#3 LG), suggesting that the potential for knowledge-related externalities has not completely hindered adoption of new technologies in this market.
A few participants in five focus groups expressed a significant concern with downside risk. One participant explained, “… if [a technology is] still relatively new, I want to assess the risk of bad, bad things happening” (FG#1, MD). Another participant stated, “… with smaller chains, you don’t have as much room for error. You can’t make many mistakes because they can have a devastating effect on your company” (FG#5, MD). Such cautious attitudes toward adopting new technology when the payoffs are uncertain could be driven by a rational calculation that the downside risk outweighs the upside, though a few participants also expressed views that appear consistent with loss aversion. Loss aversion occurs when individuals put greater weight on losses than on gains of equivalent value as they assess risky options relative to the status quo. Loss aversion is often classified as a behavioral anomaly because it generates behavior that is inconsistent with utility- or profit-maximization (Tversky & Kahneman, Reference Tversky and Kahneman1992).
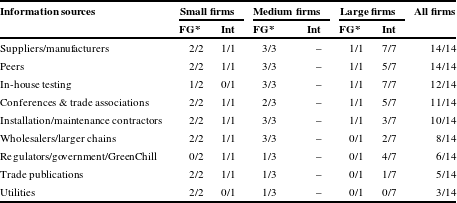
Given participants’ widespread concern with uncertainty about technology performance as a barrier to investment, it seems plausible that better information about these technologies could help to accelerate adoption. Participants discussed the information sources they currently use and trust when deciding whether to invest in a new technology. The most common information sources across all types of firms included suppliers/manufacturers, industry peers, in-house testing, and conferences and trade associations (Table 4). While suppliers/manufacturers were mentioned in all focus groups and interviews, participants noted that “you take [their information] with a grain of salt” (FG#1 MD). Skepticism is driven in part by the high degree of heterogeneity across stores: “Refrigeration is very location-specific, as far as what’s going to work. [Manufacturers] advertise a certain capability at a certain set of conditions, and if you happen to be there it works as advertised, but in my case that very seldom happens” (FG#4 LG). Participants in all focus groups and half of the interviews also mentioned contractors but expressed mixed views about the reliability of this information source. For instance, both small-firm focus groups mentioned that while contractors have hands-on experience, they are not always familiar with emerging technologies.
Companies of different sizes utilized different strategies to gather information about new technologies (Table 3). In-house testing was mentioned as an important source in all medium and large-firm focus groups and interviews: “We’ll get numbers from our vendors. We’ll test for ourselves... It’s really our own testing and comparisons that help drive a decision” (INT#1 LG). It is used less by small firms, who may lack resources to implement their own tests or in-house expertise to evaluate available information. One participant emphasized this contrast, stating: “In a previous position, I worked for a company that’s global. We tried all kinds of things, but we were not only trying it for our company, we were also trying it for sister companies. In my role now with over 100 stores, you just can’t afford to make mistakes” (FG#5 MD). Another small-firm representative noted, “It sounds like a lot of the systems have different advantages associated with them, and I don’t have the expertise to know what’s best” (FG#1 MD). All of the small and medium-sized firm focus groups and interviews mentioned looking to the largest chain stores to learn about new technologies. A medium-sized firm explained, “If you’re a major couple-hundred-store player, you’re willing to try some new things .... I will go to [a peer at a larger company] and say, ‘… Tell me about what’s worked, because we don’t invest as often as you do’” (FG#3 MD). Small firms also mentioned relying on trade publications and utilities, while medium and large firms rarely mentioned these sources. Government programs and utilities both ranked low on the list.
Information sources used by supermarkets to research new technologies.

* Because the views expressed during the focus group discussions could not be attributed to individual participants, each focus group is counted as a single observation for purposes of tabulating results.
One barrier to conducting in-house testing for small and medium-sized firms is the need for sophisticated monitoring systems to measure how new technologies affect energy and refrigerant use. A majority of participants tracked energy (89%) and refrigerant use (77%), but the likelihood of monitoring increased with firm size: 79% and 57% of small companies monitored energy and refrigerant use, respectively, compared to 100% and 94% of large companies. (Medium-sized companies fell in between.) Larger chains mentioned systems that allow them to “monitor all of the energy use down to each store level, sometimes even further into a submeter, sometimes to different technologies” (INT#6 LG N-ANOM). In contrast, a participant from a medium-size firm explained, “There’s so many other things going on in the store … it’s hard to measure what impact [a technology] had” (FG#1 MD). Energy use has received more scrutiny than refrigerant use. Less than a third of participants reported their firm’s refrigerant leak rate. An interviewee admitted that when his company first joined GreenChill, they did not know what a leak rate was (INT#7 SM, N-ANOM). That said, as refrigerant replacement costs have risen due to regulatory requirements, conservation has become more of a priority.
Industry reliance on testing of new technologies by large chains to address performance uncertainty suggests the presence of learning-by-using externalities, which may lead to suboptimal investment. At the same time, the supermarket industry displays characteristics of a “privileged group” in which large chains provide a public good because private benefits outweigh costs, leading to beneficial spillovers for others (Olson, Reference Olson1965). While information is underprovided relative to the social optimum (a market failure), privileged groups may lead to some level of public goods provision. However, diversity of technology options and heterogeneity in store conditions still means that collecting and assessing information poses a transaction cost to firms. This transaction cost is not accounted for in NPV projections. Better accounting for the costs of testing and gathering information about new technologies could yield NPV calculations that are more consistent with firm decision making.
4.2 Split incentives
Split incentives can occur when the person that makes capital investment, use, or maintenance decisions does not pay the energy or refrigerant costs. In other cases, individuals that do not bear the energy or refrigerant costs also may behave in ways that undermine the effectiveness of the energy- or refrigerant-saving technologies (Jaffe & Stavins, Reference Jaffe and Stavins1994; Gillingham, Newell & Palmer, Reference Gillingham, Newell and Palmer2009). We discuss three possible split incentive problems for supermarket refrigeration: between the company purchasing equipment and the contractor installing, repairing, or maintaining it; between store managers paying energy bills and workers using refrigeration technology; and between store departments involved in refrigeration decisions.Footnote 15
In general, we find weak descriptive evidence of within-company split incentives, and moderate descriptive evidence of potential split incentives between store managers and contractors, and between store managers and workers (Table 3). However, participants also frequently used strategies designed to re-align the incentives of contractors and workers with those of store management (e.g., supervision, performance based evaluation criteria, training, technology). As a result, we find mixed descriptive evidence of a potential market failure in these cases. This also leads us to suggest that when firms train their workers or increase oversight of contractors to ensure the proper operation of new technologies, analysts should include these costs in their NPV calculations.
Store–contractor relationships
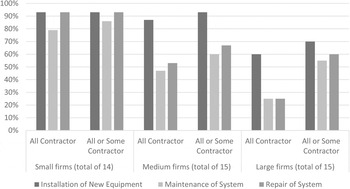
Figure 2 presents information from questionnaires administered to individual participants on the extent to which they rely on contractors versus in-house technicians for installation, maintenance, and repair (who play a large role in determining system energy consumption and refrigerant leakage). With regard to maintenance and repair, the majority of small and about half of medium-sized firms relied entirely on contractors. About 25% of large firms in the sample relied entirely on contractors for repairs; another 30–35% used a mix of contractors and in-house technicians. Participants of all sizes relied on contractors for installing new equipment.
Participant use of contractors for servicing refrigeration systems.

Almost all focus group and interview participants agreed that the decision of whether to upgrade a piece of equipment or major component of a store’s refrigeration system is up to store or company management. That said, due to extensive reliance on outside contractors by many stores, there appears to be the potential for split incentives.
Most participants seem to trust their technicians’ judgment. For instance, one company stated that they rely on “the guy with the dirty hands who knows a heck of a lot more … than we do” (FG#6, SM). As noted previously, small and medium firms frequently mentioned contractors as a valuable source of information about new technologies, while larger firms were less likely to do so. Some participants noted that contractors may be less proactive about recommending new technologies if they are unfamiliar with how to maintain them.
Participants noted several strategies that could partially mitigate some split incentives. For instance, several highlighted the importance of working with the same contractor over time. “We’ve got a company that we’ve used for the last 15 years, and they’re reliable; they take care of us” (FG#2, SM). If the contractors understand store priorities then they are more likely to look out for equipment that can improve its energy consumption. Participants also mentioned the need to carefully monitor contractor activities and installation of new equipment. Some scheduled regular meetings with contractors; others specified post-installation performance requirements or even brought in third party verifiers.
Finally, a few participants noted that the contract structure itself can affect the degree to which contractors proactively identify repairs and engage in preventative maintenance to reduce energy use or refrigerant leaks (FG #6, SM; INT #5, LG; INT #7, N-ANOM, SM). When a supermarket pays a flat monthly fee, participants acknowledged that there may be a disincentive for the contractor to aggressively address maintenance issues or to stay current with the latest energy-saving technologies. Explicit system performance metrics built directly into the contract can help alleviate this problem but were not used by all participants.
Store–worker relationships
Split incentives between firms making investments to reduce energy or refrigerant use and workers using equipment was recognized as a common problem by participants in five focus groups and four interviews. One participant described a typical situation with walk-in coolers: “Usually, [workers] are going in and out … their hands are full and it’s harder for them to open the door. It’s human nature to prop that door open… you are thinking, ‘well, I’m coming right back’ but then the customer calls …” (INT#7 LG, N-ANOM).
Participants in these focus groups and interviews also discussed the ways in which they tried to reduce these split incentives. Some invested in training, letting workers know the impact of leaving doors open or overloading cases. However, because of high staff turnover, stores often had to retrain workers to avoid problems arising anew. Others offered rewards or raises tied to reducing energy use or refrigerant leaks: “Some of our biggest energy savings have been because of getting our [workers] involved in the process… we have a little reward system for stores who show the most energy reductions” (FG#3, MD). Another common strategy was to invest in monitoring technology or automatic controls: “If an operator is doing something that is going to cause them to use more energy – a good example of this is leaving freezer doors open for walk-in coolers – then we have alarms in place that notify them to shut the doors” (INT#6 LG, N-ANOM). Other participants stated that they avoid certain technologies that are easy to misuse (e.g., night blinds).
Within-company departmental relationships
It is possible that departments within a company with different responsibilities do not communicate effectively and make decisions that are not in the best interest of the firm (DeCanio, Reference DeCanio1998; DeCanio & Watkins, Reference DeCanio and Watkins1998). Whether this reflects misaligned incentives, asymmetric information between departments, or possible behavioral anomalies is unclear. In general, we heard little from participants to suggest lack of coordination between departments. While half of the focus groups and seven interviews discussed how decisions are made within their company, acknowledging that sometimes different departments are tasked with different responsibilities (e.g., maintenance, electricity bills, engineering, sustainability), participants in only one focus group acknowledged that this sometimes represented an additional barrier to investment in energy efficiency due to the need to convince others that an investment would not hurt sales or would improve product quality. For the medium and larger companies, decisions across departments were coordinated: “You’ve got the energy folks [looking] over the energy bill. The facilities folks and the maintenance folks looking at the maintenance expense. You’ve got the sustainability folks looking at emission activities. Usually we’d have one broader group … that can be accountable for all those parts” (FG#4, LG). Among smaller companies, the same person usually handled energy bills, maintenance, and sustainability issues: “I am the energy committee. I wear many hats” (FG#3, MD).
4.3 Financial constraints
In reviewing participants’ statements on whether firms face financial constraints when considering energy- or refrigerant-saving technology investments, we distinguish between two types of constraints: limited access to outside financing, also referred to as liquidity constraints, and competition from within the firm for other uses of existing funds, also referred to as the opportunity cost of capital. We do not find much descriptive evidence to suggest that firms are not making energy-efficient investments in refrigeration due to limited access to outside financing. However, competition among projects within the firm for available funds does seem to be a substantial barrier to investment (Table 3). While the former – when it exists – may result from a market failure, the latter does not. We also suggest that analysts consider using private discount rates – which are typically higher than those used to inform government policy – when evaluating the implications of private investment decisions.
Limited access to outside financing
Liquidity constraints may contribute to limited adoption of technologies if firms cannot obtain sufficient funds to cover upfront costs (Gillingham, Newell & Palmer, Reference Gillingham, Newell and Palmer2009). While participants varied in their use of cash or external financing for major investments, the majority felt that access to outside financing was not a barrier to energy-saving investments. That said, one interviewee – from a small firm – mentioned that access to capital during the 2008–2010 recession limited new investments, noting: “The bank wouldn’t give you any money …. For two or three years it was very difficult, so that obviously affected what you were going to buy. You had to do it out of cash flow” (INT#7 SM N-ANOM).
In every focus group and interview, participants also discussed rebates from utilities or government programs as a way to ease capital constraints or make energy-saving investments more attractive. Many characterized them as a major factor in tipping the scales toward adopting an energy-saving technology. One manager said, “We always look for rebates when it comes to energy efficiency projects, and often those rebates impact the financials in such a way that it’s a ‘go’ with the rebate, and if for some reason you can’t get the rebate, it’s a ‘no go’” (INT#4 LG). Another large chain mentioned that they often roll out energy-saving investments in states with the most attractive rebate programs first (INT#8 LG N-ANOM).
Opportunity cost of capital
Participants in four focus groups and all interviewees raised competing uses of capital or particular ROI or internal payback requirements as an explanation for limited investment in emission- or energy-saving technologies that appear financially attractive based on engineering-based NPV calculations. One participant explained that they may see a higher return from investments in technologies such as barcode scanners, cash registers, security systems, and computer software unrelated to refrigeration (FG#6 SM). Another participant stated that investments that make the inventory look more attractive compete with energy-savings upgrades (FG#4 LG).
Interviewees emphasized the need for consistency across projects within the firm: “You have to meet your economic goals, so any projects, any technology that we would evaluate would have to meet a return on investment” (INT#6 LG N-ANOM), and “If you’re not making a certain return with all the money you spend, then your stockholders may as well put that money in T-Bills” (INT#8 LG N-ANOM). Such statements suggest that managers expect projects to have a payback consistent with the firm’s cost of capital, and that certain energy-saving refrigeration investments fail in this regard. Participants also highlighted the importance of the discount rate assumed in engineering-based NPV calculations. If a firm’s internal rate of return is higher than the assumed discount rate, then lack of adoption may indicate a rational decision to pursue more attractive opportunities available to the firm. Use of a consistent rate of return for investments within a company does not suggest the presence of a market failure. NPV analyses of new technologies would better reflect the likely benefits for firms if calculated using private discount rates faced by supermarkets rather than the social discount rate (e.g., as is often done in engineering-based analyses of regulation or other policies).
4.4 Tradeoffs with other refrigeration attributes
Participants described a number of tradeoffs between energy efficiency and other attributes for new refrigeration technologies that were considered when making investment decisions. In particular, tradeoffs with store-specific considerations, customer appeal, reliability or maintenance, and refrigerant emissions were frequently discussed as a factor of concern (Table 3). While acknowledging that it is often challenging to explicitly quantify these tradeoffs in a payback calculation, participants suggested that these factors may make a new technology genuinely less attractive for a supermarket to adopt even when there are no additional barriers to investment. Thus, one way to improve analyses of new technologies would be to develop methods that analysts could use to explicitly account for these tradeoffs in NPV calculations.
Store-specific tradeoffs
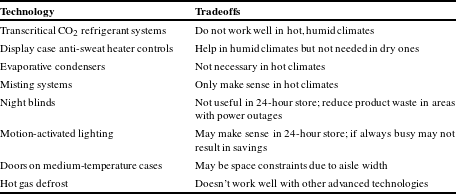
Participants in all of the focus groups and interviews identified store-specific tradeoffs as a top factor they considered when upgrading a supermarket’s refrigeration system. Many mentioned that compatibility with store layout and other system components affect technology choice. Upgrades to existing stores are more complicated than building a new store: “We have to be a lot more flexible in our solutions for existing buildings… you have structural issues you’re dealing with, and those circumstances drive those decisions” (FG#4, LG). For example, it is not always possible to install doors on medium-temperature cases in existing stores with narrow aisles (Table 5). In addition, if a new technology requires configuration changes (e.g., other components of the system also need upgrading), installation or maintenance costs may increase. On the other hand, some participants noted that in certain circumstances stores could experience even greater energy savings than anticipated because technology adoption also speeds up replacement of components no longer compatible with the new system. Other participants focused on store-specific tradeoffs related to heterogeneity in location: ambient temperature, humidity, and elevation affect refrigeration performance and may tilt investment toward or away from particular energy-efficient technologies.
Examples of store-specific tradeoffs that affect energy and refrigerant savings.

Tradeoffs with customer appeal
Every focus group and interview also mentioned potential tradeoffs with customer appeal as important factors in refrigeration technology investments. Participants agreed that the purpose of a supermarket is to sell groceries: “customer appeal and merchandising and operations are king in our world” (INT#3, LG). Sales and customer perceptions were described as particularly important for display case investments, the only major refrigeration system component visible to customers. One participant stated, “Energy savings would be the cherry on top; it would be nice but it wouldn’t be the make or break decision on why we would buy a case” (INT#7 SM, N-ANOM). Another discussed strip curtains in this context, stating, “It’s just not the sign I want to give to my customers. To me, I feel like those things get really dirty and we’re an upscale gourmet market” (FG#4, SM). Participants also expressed concern about indirect impacts on sales – for instance, how certain technologies affect product freshness.
Participants expressed mixed views about whether tradeoffs actually exist between sales and energy efficiency or refrigerant reductions. Newer efficient technologies tend to improve product quality because they maintain a more consistent temperature, reducing spoilage. One interviewee and participants in four focus groups praised advances in LED lighting in display cases that reduce energy use, improve product appearance, and avoid spoilage (FG#1 MD; FG#2 SM; FG#4 LG; FG#6 SM; INT#7 SM, N-ANOM). Two focus groups mentioned glycol secondary loop systems and leak detection technology as displaying synergies between refrigerant reductions and product quality (FG#2, SM; FG#6, SM).
The technology that best highlights the relationship between energy efficiency and customer appeal is doors on medium-temperature display cases. While doors on freezer cases have been industry standard for decades, supermarkets only recently began to widely consider doors on refrigerated cases. Seven interviewees and a subset of participants in every focus group have introduced refrigerated cases with doors into their stores, though some focus group participants are only starting to consider them or have no plans to invest in the near future. All participants who adopted doors on cases agreed that they yield substantial energy savings while also enhancing customer comfort and improving product freshness and longevity by maintaining consistent temperatures.
The discussion regarding doors on display cases underscores that it can often take a long time for a technology to become standard industry practice, especially when there is concern that it could impact product sales. The longstanding industry perception has been that doors discourage purchases – particularly impulse buys – by creating a barrier between product and customer. A focus group participant explained, “Years ago, the consensus was the customer wouldn’t take the time and energy to open that door; they were going to walk right by” (FG#2, SM). Many participants noted that they encountered skepticism from senior managers concerned that depressed revenues would outweigh cost savings. Skepticism has eroded in recent years as large chains installed doors and industry studies estimated minimal impacts on sales (Fricke & Becker, Reference Fricke and Becker2010; Gary, Reference Gary2010). However, participants reported that adoption of doors has remained low for particular products – fresh meat, beer, and wine – where managers expect more sizable sales impacts.
Tradeoffs with equipment reliability or maintenance
Every focus group and five interviewees ranked reliability as a top factor when making a major upgrade to a refrigeration system. The goal for many participants is a store that is “100% running all the time with minimal breakdowns” (INT#5 LG). Participants discussed reliability in terms of expected down time, availability of qualified service technicians, and access to replacement parts. Many participants gave examples of technologies that are more energy efficient but less reliable or require more maintenance than the current alternative, which undercuts potential net cost savings. For instance, variable speed drives (control devices that adjust electric motor speed) “create a maintenance issue when they fail or don’t work, and they’re rather expensive” (FG#3 MD). Participants in two focus groups and two interviews also discussed new compressors in this context. One participant explained, “I can be as energy-efficient as I want, but if I lose one compressor I just threw all that savings out the window” (FG#4 LG). Several participants also mentioned that hot gas defrost, which used to be standard for defrosting display case evaporators, is hardly used anymore due to incompatibility with other technologies (FG#2 SM; FG#4 LG; INT#2 LG).
Participants expressed concern about finding trained technicians to service new energy-efficient technologies: “You don’t want to put something in and nobody can service it at midnight when it breaks down” (FG#4 LG). Others emphasized a desire for equipment that is not too complex: “We’re here to sell groceries and we’re pretty good at that. We’re not great at maintaining mechanical systems. … If I’ve got an option of taking a bulletproof compressor that will take use and abuse and misuse versus something that’s a little bit more energy efficient but … is going to require a lot more maintenance, I’m taking the bulletproof one every day, without a second thought” (INT#3 LG).
While discussed less frequently, a few participants also noted that there are sometimes synergies between new, energy-efficient technologies and reliability or maintenance. For instance, LED lights are replaced less frequently than incandescent lights.
Tradeoffs between energy and refrigerant use
Three focus groups and one interviewee identified reducing refrigerant leaks as a key consideration for refrigeration upgrades since repeatedly replacing refrigerant in an old system can be costly: “There’s nothing that will turn your head more to looking at whether or not you should make an investment than having $8,000 or $10,000 just get evaporated in your store” (FG#5, MD). Participants pointed out that federal regulations have put upward pressure on the prices of certain refrigerants and drive other refrigerant decisions.
However, there is little agreement among participants on the nature of potential synergies or tradeoffs between energy and refrigerant use. Hot gas defrost was raised as an example where tradeoffs could occur (FG#2, SM; INT#6, N-ANOM). While this type of system may be more energy efficient, it requires more refrigerant charge and has a higher likelihood of leaks. Tradeoffs between refrigerant and energy use in secondary loop systems were discussed in the context of a potential conflict between DOE and EPA regulations: “It’s a catch-22 because you’ve got… the DOE wanting you to save energy, and the EPA wanting you to [address] global warming, and the secondary systems, they’re great on the global warming side but on the energy side, they’re not” (FG#3, MD). One participant opined that when there is only a small energy penalty associated with a new refrigerant, it may still be worth adopting to reduce emissions. Another participant commented, “the jury [is still out] as far as whether [our own system will] have an energy penalty or not” (INT#8, N-ANOM, LG).
Participants also noted examples where synergies occur. Since older equipment tends to leak more refrigerant and is less energy efficient, upgrading it will likely improve both (FG#2, SM). New display cases may be more energy efficient and need less refrigerant; automatic controls allow for better monitoring and control of energy and refrigerant. Several participants noted that if systems are leaking refrigerant they are also using a lot of energy, making leak detection systems a good investment.
5 Conclusion
In general, participants’ statements are consistent with the idea of limited or slow investment in many seemingly profitable energy- or refrigerant-reducing technologies. Barriers to adoption that were frequently discussed include uncertainty and imperfect information about the performance of new technologies, high opportunity costs of capital within firms, and potential impacts on sales or tradeoffs with other valued attributes not typically included in simple NPV calculations. Split incentives between firms and contractors and/or workers may also be affecting investment decisions to some degree. We do not find strong descriptive evidence that many of the factors identified as barriers to investment in this study are a result of market failures that could lead to suboptimal market outcomes. While split incentives between firms and contractors and/or workers were frequently discussed as a factor of concern, participants described actions they had taken to at least partially mitigate these problems, such as training workers and cultivating long-term relationships with contractors. Participant statements about information spillovers among firms also suggest that consideration of policies aimed at reducing imperfect information may be worthwhile. In particular, given that firms appear to trust information and results based on the real-world experiences of their peers, targeted rebates or pilot programs that accelerate adoption of some technologies seem likely to be more effective than government testing programs. It is also worth noting that, while some statements made by participants are also potentially indicative of behavioral anomalies, we are not able to separate out this effect from other explanations.
With regard to NPV calculations produced by analysts in an effort to predict what technologies supermarkets should be investing in to reduce energy and refrigerant use, we conclude that at least a portion of the apparent energy efficiency paradox may be due to inconsistencies between these calculations and the way that firms actually make investment decisions. To minimize such inconsistencies, analysts could use private discount rates that reflect firms’ opportunity cost of capital, incorporate more refined real-world estimates of technology performance and the cost to firms of conducting testing needed to gather such information, and the value of tradeoffs with other valued attributes into NPV calculations.
We remind the reader of a few caveats when interpreting the results of this study. By its very nature, information from focus groups and interviews is only suggestive. It is not drawn from a representative sample of the industry. In particular, participants may be more interested in technology and sustainability issues than nonparticipating supermarkets. The focus on traditional supermarkets also limits generalizability of the results (e.g., they cannot be applied to the hypermarket or wholesale club experience). Despite these caveats, the results may help inform future analyses or development of surveys on barriers to energy-efficient investments in the supermarket industry, as well as policy discussions of how to better promote energy and refrigerant reductions from supermarkets and commercial buildings more generally.