


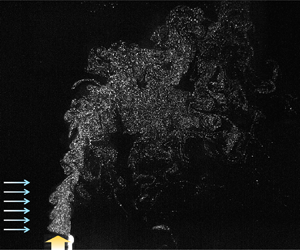



1. Introduction
The dispersion of solid particles in a fluid flow, irrespective of the scale of the phenomenon, is a significantly important issue in nature and industrial applications (Guha Reference Guha2008). For example, tracking and predicting particle trajectories and concentrations is gaining increasing attention, as the spreading of toxic pollutants and hazardous biological particles in air has become a serious issue. In solid–gas two-phase flows, solid particles interact with a carrier-phase flow, by which they are preferentially concentrated or dispersed. Thus, it is important to predict particle behaviours from the interactions with the vortical structures in the flow to develop countermeasures to control them (Marchioli & Soldati Reference Marchioli and Soldati2002; Gibert, Xu & Bodenschatz Reference Gibert, Xu and Bodenschatz2012). In general, the particles preferentially gather in regions with a lower vorticity and higher strain rate, corresponding to the outsides of the vortices and converging flows; this is called the preferential concentration (Maxey Reference Maxey1987; Squires & Eaton Reference Squires and Eaton1991; Anderson & Longmire Reference Anderson and Longmire1995). Compared with studies on local (in sub-millimetre scale) clusterings of particles affected by turbulence structures, a full investigation regarding how particles disperse on a relatively larger scale owing to vortical interactions has not been conducted (Abdelsamie & Lee Reference Abdelsamie and Lee2012; Tagawa et al. Reference Tagawa, Mercado, Prakash, Calzavarini, Sun and Lohse2012; Liu et al. Reference Liu, Shen, Zamansky and Coletti2020). In this sense, a particle-laden upward jet with crossflow is an interesting problem for enhancing our knowledge of this issue. When a vertical jet interacts with a horizontal crossflow, well-defined large-scale vortical structures are induced downstream; these determine the particle dispersions and concentrations. Furthermore, this phenomenon is commonly found in volcanic ash dispersions, fine dust pollutants emitted from smokestacks, air conditioners and gas burners in indoor environments, combustion of solid fuel and solar thermal reactors (Steinfeld Reference Steinfeld2005; Nathan et al. Reference Nathan, Mi, Alwahabi, Newbold and Nobes2006).
As one of the canonical flows, the interaction of a jet with crossflow has been investigated widely in various configurations (Plesniak & Yi Reference Plesniak and Yi2002; Sau et al. Reference Sau, Sheu, Hwang and Yang2004; Plesniak & Cusano Reference Plesniak and Cusano2005; Mahesh Reference Mahesh2013). For example, in terms of physical behaviours such as the flow kinematics, vortical structures and entrainment, a single-phase upward jet with crossflow has been extensively investigated. When the fluid densities of the jet and crossflow are the same, the velocity ratio ( $R$) of the jet velocity (
 $U_j$) to that of the crossflow (
 $U_c$) determines the overall flow characteristics (Fric & Roshko Reference Fric and Roshko1994; Kelso, Lim & Perry Reference Kelso, Lim and Perry1996; Su & Mungal Reference Su and Mungal2004; Sau & Mahesh Reference Sau and Mahesh2008; Chauvat et al. Reference Chauvat, Peplinski, Henningson and Hanifi2020). According to Mahesh (Reference Mahesh2013), the vortical structures from the jet-crossflow interaction change at a critical velocity ratio (
 $R_{crit}$) of 1.0–2.0. Owing to the crossflow-induced higher-pressure region above the jet exit, in general, an adverse pressure gradient exists on the windward side of the vertical jet, and decreases as
 $R$ increases (Andreopoulos Reference Andreopoulos1982; Kelso et al. Reference Kelso, Lim and Perry1996). Thus, the jet flow decelerates at the leeside of the jet exit with a higher
 $R\ ({>}2.0)$, but separates earlier near the exit when
 $R$ is lower
 $({<}2.0)$. The adverse pressure gradient also forces the crossflow boundary layer to separate upstream of the jet; it evolves into shear-layer vortices resembling Kelvin–Helmholtz rollers. Finally, it contributes to the formation of counter-rotating vortex pairs (CVPs), horseshoe and wake vortices at a higher
 $R$
 $({\sim }2.0\text {--}6.0)$ (Fric & Roshko Reference Fric and Roshko1994; Sau et al. Reference Sau, Sheu, Hwang and Yang2004; Muppidi & Mahesh Reference Muppidi and Mahesh2005). A simplified schematics of vortical structures are illustrated in figure 1. Kelso et al. (Reference Kelso, Lim and Perry1996) suggested that the tilting and folding of jet vortex sheets owing to the shear-layer instability leads to the formation of the CVP. The horseshoe vortices (spanwise vortices moving around the jet) interact with the wake vortices (with opposite signs) and lift away from the wall to the leeside of the jet, causing the CVP to persist downstream (Fric & Roshko Reference Fric and Roshko1994). For a lower
 $R$
 $({<}2.0)$, the crossflow boundary-layer vorticity is much stronger than the leading-edge vorticity inside the jet (their signs are opposite); thus, the flow fields are dominated by hairpin vortices (Acarlar & Smith Reference Acarlar and Smith1987; Sau & Mahesh Reference Sau and Mahesh2008). Although the dependence of a vortical structure on
 $R$ is well understood for a single-phase flow, the dynamics of solid particles as induced by the vortical interactions in a solid–gas two-phase flow have not been investigated in detail.
Schematic of the vortical structures in an upward jet in crossflow (Smith & Mungal Reference Smith and Mungal1998; Su & Mungal Reference Su and Mungal2004; Plesniak & Cusano Reference Plesniak and Cusano2005; Mahesh Reference Mahesh2013).

In general, it is understood that the preferential concentration of particles is maximized when the particle Stokes number ( $St$), i.e. the ratio of particle relaxation time scale (
 $\tau _p$) to background flow characteristic time scale (
 $\tau _f$), is close to
 $1.0$. This phenomenon has been investigated for a small-scale flow structure, where
 $\tau _f$ corresponds to the Kolmogorov scale or Taylor microscale, at which high-vorticity gradients and dissipative motions prevail (Squires & Eaton Reference Squires and Eaton1991; Abdelsamie & Lee Reference Abdelsamie and Lee2012). Using Voronoï tessellation, Liu et al. (Reference Liu, Shen, Zamansky and Coletti2020) analysed the essential conditions for the particle cluster (
 $St \gtrsim 1.0$) to sustain, and showed that particles with higher inertia and gravitational settling allow the cluster to survive longer (up to 40 times of Kolmogorov time scale). Through a scale-wise analysis using wavelet decomposition, Bassenne, Moin & Urzay (Reference Bassenne, Moin and Urzay2018) showed the scale-dependent characteristics of the preferential concentration. When the
 $St$ (based on the Kolmogorov scale) is approximately
 $1.0$, particles agglomerate along particular streaks as thin clusters, and the total energy of the concentration fields has the highest peak in the high-wavenumber (small-scale) portion of the spectrum. For
 $St \simeq 10.0$, the peak of the total energy is skewed to the low-wavenumber (large-scale) portion of the spectrum, and has the highest value in the region with less preferentially concentrated broad clouds.
Despite previous contributions providing insights on particle behaviours, there is a need for further study on the particle dispersion pattern from vortical interactions on a relatively large scale, and understanding its mechanisms is essential. There have been a few studies regarding simpler flow geometries. Longmire & Eaton (Reference Longmire and Eaton1992) experimented that the particle dispersion is more affected by convection of the coherent vortex structures than by diffusion in a low-speed particle-laden air jet. By observing the self-organizing dispersion process in a plane wake, Tang et al. (Reference Tang, Wen, Yang, Crowe, Chung and Troutt1992) showed that particles gather at the boundaries of large vortices when  $St = 1.0$, and that the particle motions highly depend on
 $St$. In this wake topology, only vortex stretching exists, and affects the particle migration. For a mixing layer, Wen et al. (Reference Wen, Kamalu, Chung, Crowe and Troutt1992) observed that the vortex folding process forces particles to move into the vortex cores, even at
 $St = 1.0$. Wang, Zheng & Tao (Reference Wang, Zheng and Tao2017a) investigated the transport of PM10 particles (with sizes less than
 $10\ \mathrm {\mu }\textrm {m}$) in a turbulent boundary layer. High-speed motions (with a higher shear stress) in the upper logarithmic layer transported the particles along the vertical direction; in contrast, low-speed motions caused streamwise particle transportation, owing to the lower shear stress.
Therefore, it is necessary to investigate particle dispersions as affected by complex and coherent flow structures. We experimentally investigate the particle distribution in a vertically ejected particle-laden jet, with and without crossflow, focusing on the combined effects of  $St$ and
 $R$ on the dispersion characteristics. The Reynolds number of the vertical jet with crossflow is 1170–5200 based on jet exit size, and we use silicon particles (sizes of
 $6$,
 $53.6$ and
 $205.5\ \mathrm {\mu }\textrm {m}$, respectively) as the solid phase. The range of considered
 $St$ is 0.01–27.42, and
 $R$ is classified as 1.0–1.2 (strong crossflow), 3.0–3.5 (weak crossflow) and
 $\infty$ (no crossflow). Since we are interested in the interaction of particles with the larger-scale vortices (of spatially varying coherency) in the jet, the flow time scale to calculate
 $St$ corresponds to the bulk flow scale rather than the turbulence scale used in previous studies. Details of the definition of
 $St$ are explained in § 2.2. In this study we explain the mechanism of particle dispersion based on measuring the particle distribution and gas-phase flow structures. Then, we classify the regimes of the particle dispersion (concentration) patterns in terms of the dynamics of the CVPs in the flow, which is extended to empirical particle dispersion models. This type of analysis has not been provided before, and we believe that this study will be quite meaningful, as it will provide new insights into the interactions between the solid particles and complex flow structures in the flow.
The remainder of this paper is organized as follows. In § 2 we explain the experimental set-up (method for measuring the particle dispersion) and characterize the conditions of each phase. The overall vortex dynamics of the single-phase gas flow is discussed in § 3. This is followed by § 4 with a discussion of the detailed data and analysis of the corresponding particle behaviours, along with their pattern classifications and development of empirical particle dispersion models. In § 5 we further discuss the mechanisms of particle dispersion. A summary and outlook are given in § 6.
2. Experimental set-up and procedures
2.1. Flow facility for an upward jet with a crossflow
The experiments were conducted in a wind tunnel ( $2075\ \textrm {mm}\times 600\ \textrm {mm}\times 800\ \textrm {mm}$ in the horizontal (
 $x$), transverse (
 $y$) and vertical (
 $z$) directions, respectively), as shown in figure 2(a). The test section was made of
 $10$ mm thick transparent acrylic plates. At the exit of the test section, a high-efficiency particulate air filter was installed to filter out particles (or seeders for particle image velocimetry), and to prevent flow distortions owing to backflow. From a nozzle exit at the bottom, the upward jet (the bulk velocity varied as
 $U_{j} = 1.0\text {--}3.5\ \textrm {m}\ \textrm {s}^{-1}$) was ejected through a long stainless steel square pipe with a length (
 $L$) and side length (
 $D$) of 400 and
 $22.5$ mm, respectively (the aspect ratio of which is large enough to have a fully developed flow at the exit). The Reynolds number of the vertical jet with crossflow was
 $Re_{D} = \bar {u}_{m}D/\nu = 1170\text {--}5200$, where
 $\bar {u}_{m}$ is the time-averaged maximum air velocity measured directly above the exit and
 $\nu$ is the kinematic viscosity of air. Throughout this paper, an upper bar denotes the time-averaged value. To ensure the uniformity of the jet and crossflow, a stainless mesh screen (wire diameter and opening size of
 $0.5$ mm and
 $2.67$ mm, respectively) was installed at the exits. The pipe was spaced
 $300$ mm apart from the side walls of the test section. Considering the spreading rate of the jet at a similar
 $Re_D$, it was assumed that the jet was not affected by the interference of the side wall (Kwon & Seo Reference Kwon and Seo2005; Fellouah, Ball & Pollard Reference Fellouah, Ball and Pollard2009). The horizontal crossflow was blown through a rectangular duct toward the vertical jet, generated by a brushless DC blower fan (
 $\text {maximum air volume} = 7.7\ \textrm {m}^{3}\ \min ^{-1}$) installed near the test section floor. The velocity profiles measured at the exit of the vertical jet (at
 $z/D = 0$) and horizontal crossflow (at
 $x/D = -13.3$) are shown in figure 2(b). As shown, the crossflow is approximately symmetric and has a velocity peak at
 $z/D \simeq 2.0$. Jet exit fluid velocity exhibits the common feature of a parabolic profile (Mi, Nobes & Nathan Reference Mi, Nobes and Nathan2001; Zhang et al. Reference Zhang, Xu, Pollard and Mi2013; Lau & Nathan Reference Lau and Nathan2014, Reference Lau and Nathan2016). For the particle velocity at the jet exit, the profile with
 $St \ll 1.0$ follows the fluid velocity, and the gravity effect increases as
 $St$ becomes higher (particles tend to fall down near the edge of the exit). It should be noted that the crossflow did not fully cover the cross-sectional area of the test section; rather, the fan outlet size was
 $-3.7 \leqslant y/D \leqslant 3.7$ and
 $0 \leqslant z/D \leqslant 2.93$, indicating that the crossflow partially covered the
 $y$–
 $z$ plane of the test section. This is a specific condition but we intended to mimic the wind blowing along a locally confined area near the particle source (much closer to situations found in nature and industrial sites, which are normally non-uniform) and it is more suitable to investigate particle dispersion in terms of the interaction with the vortical structure of which the coherency varies spatially. The bulk velocity of the crossflow (
 $U_c$) varied up to
 $3.0\ \textrm {m}\ \textrm {s}^{-1}$; thus, the ranges of the velocity ratio were
 $R = U_{j}/U_{c} = 1.0\text {--}1.2$, 3.0–3.5 and
 $\infty$.
(a) Experimental set-up for measuring the continuous-phase (air) flow structure and dispersed solid particle concentration in  $x$–
 $z$ and
 $x$–
 $y$ planes with a particle image velocimetry and high-speed imaging (camera and lasers are shown for
 $x$–
 $z$ plane measurement). (b) Time-averaged velocity profiles for the crossflow and vertical jet measured at the exit of the crossflow duct (
 $x/D = -13.3$) and jet pipe (
 $z/D = 0$), respectively:
 $\bullet$, gas velocity;
 $\blacksquare$, red, particle velocity (
 $St = 0.013$);
 $\blacksquare$, light pink, particle velocity (
 $St = 1.07$);
 $\square$, particle velocity (
 $St = 15.71$).

2.2. Description of the solid particles
Considering the properties (density, chemical compositions and so on) of fine dust pollutants commonly found in nature (Li et al. Reference Li, Shao, Wang, Shen, Yang and Tang2010; Hu et al. Reference Hu, Peng, Sun, Yue, Guo, Wiedensohler and Wu2012), we consider  $99.9\,\%$ silicon spherical particles (density
 $\rho _{p} = 2.33\ \textrm {g}\ \textrm {cm}^{-3}$) as the dispersed phase. These were loaded in the vertical jet using an in-house fluidized-bed type seeding device (figure 2a). As shown in figure 3, the mean particle diameter (
 $\bar {d}_{p}$) was varied as
 $6$,
 $53.6$ and
 $205.5\ \mathrm {\mu }\textrm {m}$, respectively, and the particle size followed a Gaussian distribution with a standard deviation around
 $15\,\%$. The particle size distribution was measured using a particle size analyser (Mastersizer 2000, Marvern Panalytical Ltd.) in a 10 gram sample per each group of size. This apparatus uses a laser diffraction technique based on the principles of static light and Mie scattering theory; smaller (larger) particles scatter the light at larger (smaller) angles. With this range of particle size distribution (figure 3), the range of Stokes number does not change significantly in orders. Therefore, in the same group of particle size, it is expected that the specific particle dynamics under the interaction with the flow is retained. In addition, previous studies also used particles with a comparable level (9–17 %) of standard deviation in size (Anderson & Longmire Reference Anderson and Longmire1995; Hwang & Eaton Reference Hwang and Eaton2006; Dou et al. Reference Dou, Bragg, Hammond, Liang, Collins and Meng2018). The modulation of the continuous-phase flow turbulence owing to the interaction with the dispersed phase is also an important issue in a multiphase flow (Hwang & Eaton Reference Hwang and Eaton2006; Abdelsamie & Lee Reference Abdelsamie and Lee2012; Kim, Lee & Park Reference Kim, Lee and Park2016; Lee & Park Reference Lee and Park2020), but this was not the point of this study. Thus, we focused on the particle behaviours owing to the background flow (i.e. one-way coupling). The particle volume fraction (
 $\phi = \text {total}$ solid particle volume/test section volume) was determined as approximately
 $2 \times 10^{-7}$ (
 $0.3\ ({\pm }0.03$) gram of particles were used per each trial of measurement); this was sufficiently low to assume that the effects of the particles on the air flow and particle-to-particle collisions were negligible (Elghobashi Reference Elghobashi2006).
Probability density function (p.d.f.) of particle size considered in the present study.

To characterize the dynamics of the particles, we considered the particle Stokes number,  $St = \tau _{p}/\tau _{f}$. The flow time scale was defined as
 $\tau _{f}=D/\bar {u}_{m}$, and the particle relaxation time scale was the ratio of particle settling velocity (
 $V_s$) to gravitational acceleration (
 $g$). A similar definition of flow time scale based on the bulk flow scale was also adopted for investigating the larger-scale particle dispersion (Fessler & Eaton Reference Fessler and Eaton1997; Lau & Nathan Reference Lau and Nathan2014, Reference Lau and Nathan2016). The slip velocity
 $(v-u)$ of the particle tends to saturate to a settling velocity as the drag force (
 $F_D$) is balanced with the gravitational force (
 $F_G$). Here,
 $u$ and
 $v$ is the velocity of air flow and particle, respectively. Given a single rigid particle released in stagnant air, the equation for particle motion for balanced state is defined as
 $m_{p}(\textrm {d}v/\textrm {d}t)=F_{G}-F_{D}=1/6(\rho _{p}-\rho _{g}){\rm \pi} \bar {d}_{p}^{3}g-F_{D}=0$, where
 $m_p$ is the mass of a particle,
 $\rho _p$ and
 $\rho _g$ are the density of the particle and gas (air), respectively. The drag force depends on the particle Reynolds number (
 $Re_p$), which is based on the slip velocity, i.e.
 $Re_{p}=\rho _{p}\bar {d}_{p}|v-u|/\mu$ (
 $\mu$: dynamic viscosity of air) (see table 1). When
 $Re_{p} < 1$, which applies to most of the present cases, the viscous effect is much stronger than the inertia, and the Stokes’ drag holds as
 $F_{D} = 3{\rm \pi} \mu (v-u)\bar {d}_{p}$. As
 $Re_p$ increases over
 $1.0$, the drag force transitions to be proportional to the square of the slip velocity, as
 $F_{D} = C_{D}({\rm \pi} /8) \rho _g\bar {d}_{p}^{2}(v-u)^{2}$. We used
 $C_{D}=(24/Re_{p})\cdot (1+0.15Re_{p}^{0.687})$ for the drag coefficient, which has been validated for
 $1 < Re_{p} < 800$ (Schiller & Neumann Reference Schiller and Neumann1933). For the present lower
 $\phi$, the particle–particle interactions were negligible, and the above relation for a single-particle was used without modification (Fessler & Eaton Reference Fessler and Eaton1997; Lau & Nathan Reference Lau and Nathan2016). Therefore, the Stokes number was calculated as
 \begin{equation} St=\frac{\tau_{p}}{\tau_{f}}= \left\{ \begin{array}{@{}ll} \sqrt{\dfrac{4\rho_{p}\bar{d}_{p}}{3\rho_{g}C_{D}g}} \dfrac{\bar{u}_{m}}{D} & \mbox{for}\ 1 < Re_{p} < 800, \\ \dfrac{\rho_{p}\bar{d}_{p}^{2}}{18\mu} \dfrac{\bar{u}_{m}}{D} & \mbox{for}\ Re_{p} \leqslant 1. \end{array}\right. \end{equation}
As shown, the gravitational effect is additionally included for cases with higher  $Re_{p}$. Based on varying the jet velocity and particle size together, the present experiments were performed in the range of
 $St = 0.01\text {--}27.42$. The detailed flow variables considered in the present study are listed in table 1.
Summary of the considered experimental parameters of gas and solid phases.

2.3. Velocity measurement of the solid and gas phases
In the present configuration it was not possible to distinguish the silicon particles and seeders for particle image velocimetry (PIV) in the optically obtained images for the velocity measurements. Thus, the velocity fields of the solid particles and background flow were measured separately. This approach was acceptable as the solid–gas flow belonged to a one-way coupling regime (Fessler & Eaton Reference Fessler and Eaton1997; Fu, Wang & Gu Reference Fu, Wang and Gu2013), and the same vortex structures as those measured in a single-phase flow determine the particle motion in the two-phase flow. For the PIV of the air flow, high-purity liquid polyol (fog fluid standard, Dantec Dynamics) was atomized into oil droplets (nominal diameter of  $1\ \mathrm {\mu }\textrm {m}$) by smoke generators (Safex, Dantec Dynamics), and was fed into both the vertical jet and crossflow openings as tracers (figure 2a). As a light source, a
 $5$ W continuous wave (CW) laser (RayPower 5000, Dantec Dynamics) with a wavelength of 532 nm was used to illuminate the measurement plane. To measure the velocity of the solid particles, we used the same set-up, except for employing silicon particles instead of the seeders for the PIV. A particle tracking method (PTV) would be more adequate to measure the velocity of individual particles; however, it is quite difficult to apply if the size of the particle is much smaller than the pixel size and the solid fraction is high, like the present study. Poelma, Westerweel & Ooms (Reference Poelma, Westerweel and Ooms2007) explained that less than
 $100$ particles in an image is suitable to apply PTV; which is not satisfied in the present study. When the PTV is not feasible, a PIV has been commonly used to measure the solid particle velocity in investigating the particle-laden flows (Anderson & Longmire Reference Anderson and Longmire1995; Tóth, Anthoine & Riethmuller Reference Tóth, Anthoine and Riethmuller2009; Lau & Nathan Reference Lau and Nathan2014, Reference Lau and Nathan2016; Liu et al. Reference Liu, Jiang, Zhang and Li2016). A high-speed camera (SpeedSense M310, Dantec Dynamics) equipped with a 50 mm lens (Nikon) was used to capture raw images at a speed of 3200 frames per second. The measurements of the velocities and particle distributions (see § 2.4) were performed at the same locations. For the three-dimensional analysis, we perform the measurements on multiple
 $x$–
 $z$ (side view; at
 $y/D = 0$,
 $0.5$,
 $1.0$ and
 $2.0$) and
 $x$–
 $y$ (top view; at
 $z/D = 0.5$,
 $1.0$,
 $2.0$,
 $5.0$ and
 $10.0$) planes. For the
 $x$–
 $z$ plane measurement, the size of the field of view (FoV) was
 $-4.0 \leqslant x/D \leqslant 4.0$ and
 $-0.6 \leqslant z/D \leqslant 34.0$ for the cases without crossflow, and
 $-2.3 \leqslant x/D \leqslant 15.0$ and
 $-0.7 \leqslant z/D \leqslant 11.0$ for the cases with crossflow. To cover the large side view FoV in the case without crossflow, the FoV was divided into three segments and measured. For the
 $x$–
 $y$ plane measurement, the FoV size is
 $-5.0 \leqslant x/D \leqslant 10.5$, and
 $-7.0 \leqslant y/D \leqslant 7.0$. The spatial resolution of the velocity measurement was
 $0.01D-0.014D$ or
 $37.5\bar {d}_{p}-52.5\bar {d}_{p}$, based on the smallest solid particle (
 $\bar {d}_{p} = 6\ \mathrm {\mu }\textrm {m}$). As we did not focus on particle gathering in the turbulence scales, this was considered sufficient for understanding the vortex-induced particle dispersion. A cross-correlation algorithm based on a fast Fourier transform was used to evaluate the velocity vectors for each pair of tracer (or particle) images, with an interrogation window (IW) of
 $32 \times 32$ pixels (
 $50\,\%$ overlap). Spurious vectors were detected by the normalized median test (Westerweel & Scarano Reference Westerweel and Scarano2005), and were replaced with the average of the surrounding vectors in a
 $3 \times 3$ grid.
Experimental uncertainties in velocity measurement are caused by various sources (Raffel, Willert & Kompenhans Reference Raffel, Willert and Kompenhans2007). When the velocity evaluated using the PIV technique is expressed in relation to  $M$ (magnification factor),
 $\Delta t$ (time interval between successive images) and
 $\Delta s$ (particle displacement during
 $\Delta t$), the uncertainty in the measured velocity can be estimated as
 $\delta (u)=\sqrt {(\delta (M)^{2} + \delta (\Delta t)^{2} + \delta (\Delta s)^{2}}$; percentage errors (
 $\delta$) in obtaining each variable are combined (Lawson et al. Reference Lawson, Rudman, Guerra and Liow1999; Kim, Kim & Park Reference Kim, Kim and Park2015; Choi & Park Reference Choi and Park2018). During the calibration, we used a two-dimensional calibration target, and
 $\delta (M)$ was found to be approximately 0.3–0.4 %, with
 $M = 266\text {--}499\ \mathrm {\mu }\textrm {m}\ \textrm {pixel}^{-1}$. For the time separation, the inter-fame time was 500 ns, and the corresponding
 $\delta (\Delta t)$ was
 $0.15\,\%$. Finally, as affected by the pixel resolution of
 $0.1$ pixels,
 $\delta (\Delta s)$ was estimated to be approximately
 $0.7\,\%$ for
 $\Delta s = 6.6$ pixel. Therefore, the overall uncertainty in the measured velocity was approximately
 $1.0\,\%$.
2.4. Measurement of particle concentration
The particle concentration was quantified based on the light intensity of the Mie scattering signal from the solid particles, which is proportional to the particle number density. This is known as planar nephelometry (PN) (Birzer, Kalt & Nathan Reference Birzer, Kalt and Nathan2012; Lau & Nathan Reference Lau and Nathan2014). We used a planar laser sheet, the same as that used in the PIV, as a light source. The relative light intensity (proportional to the particle concentration) shows up as a different grey-scale level of each pixel in the images; these are thus quantified as indexes for relative particle concentrations in post-processing for noise removal (Birzer et al. Reference Birzer, Kalt and Nathan2012), as shown in figure 4(a). First, the grey-level in each pixel was calculated and normalized in a range of  $0$ (black) to
 $1.0$ (white). Considering that the grey-level (light intensity) represents the relative particle concentration, we subtracted the grey-level distribution of the background image (taken at the same condition except for the particles) from that of the raw images, for the purpose of noise removal (typically, the normalized grey-level values below
 $0.1$). Then, the concentration (
 $\varTheta$) per IW was evaluated as an area fraction, where
 $\varTheta = (\text {sum of the grey-level values contained in IW})/(\text {IW area})$ (figure 4a). Here, the size of the IW (
 $32 \times 32$ pixels) was the same as that of the PIV measurement. Meanwhile, when measuring the cases without crossflow on the
 $x$–
 $z$ planes, two CW lasers were arranged vertically to minimize the effects of non-uniform illumination owing to the large FoV (figure 2a). By using two lasers, we found that the low-light-intensity region at the edges of the laser sheet could be compensated for, and a full illumination on the entire FoV was achieved.
Particle concentration measurement by PN: (a) raw image of solid particles and a schematic diagram to calculate light intensity of an IW (yellow colour: pixels identified as being occupied by solid particles; grey colour: noise); (b) correction of non-uniform laser light sheet; (c) correction of measured particle concentration.

As we optically measured the particle concentration based on light scattering in a relatively large FoV, the spatial non-uniformity of the incident laser power could affect the results (Kalt & Nathan Reference Kalt and Nathan2007). When the particle volume fraction is smaller than  ${\sim } 10^{-5}$ (
 $2 \times 10^{-7}$ for the present cases), the attenuation of light power owing to particle shadows is known to be negligible (Kalt, Birzer & Nathan Reference Kalt, Birzer and Nathan2007; Cheong, Birzer & Lau Reference Cheong, Birzer and Lau2016). However, we attempted to compensate for the possible distortions owing to particles and the quality of the laser sheet. As a first step, we measured the level of light attenuation along the beam direction, and the effect of the laser sheet profile. We introduced uniformly distributed oil droplets into the FoV, and measured the reflected light intensity (i.e. the grey-level). As the smoke was distributed uniformly, this provided us with information on the power intensity irregularity in the laser sheet. Based on the measured oil droplet field image, we determined the correction constant (
 $C^{*}$) per IW;
 $C^{*}$ was defined as
 $C^{*}(i, j) = 1.0 + S_{md} - S_{laser}(i, j)$, where
 $S_{laser}$ is the laser light intensity value of each IW and
 $S_{md}$ is the median value of
 $S_{laser}$. Here
 $S_{laser}$ was calculated by the same method to obtain
 $\varTheta$, and was normalized by its own maximum value in the FoV. In this study,
 $(i, j)$ represented the coordinates of the IW. As shown in figure 4(b), the correction factor was higher near the laser outlet and lower at the edge of the laser sheet. Using this map of
 $C^{*}$, the measured raw values (concentration) were calibrated; biased concentration values at positions with higher (lower) power intensity than
 $S_{md}$ were corrected. Once the correction factor was obtained, it is multiplied by the raw particle concentration (
 $\varTheta$) values in each IW, and the corrected concentration (
 $\varTheta _{c}$) was obtained as
 $\varTheta _{c}(i, j) = \varTheta (i, j)\cdot C^{*}(i, j)$. An example is shown in figure 4(c). Together with previous studies (Kalt & Nathan Reference Kalt and Nathan2007), this correction procedure prevented excessive data distortion in locations where the laser power intensity was drastically biased.
For the corrected (calibrated) raw images, we evaluated the particle concentration distribution, which was further normalized ( $\hat {\varTheta } = \bar {\varTheta }_{c}/\bar {\varTheta }_{b}$) by the bulk concentration (
 $\bar {\varTheta }_{b}$), defined as follows (Lau & Nathan Reference Lau and Nathan2014):
 \begin{equation} \bar{\varTheta}_{b} = \frac{1}{D^{2}V_{j}}\int^{D/2}_{{-}D/2}\int^{D/2}_{{-}D/2}\bar{\varTheta}_{exit}(x, y)\bar{v}_{exit}(x, y)\,\textrm{d}x\,\textrm{d}y. \end{equation}
Here,  $\bar {\varTheta }_{exit}$ and
 $\bar {v}_{exit}$ are the time-averaged local concentration and velocity of the particles, respectively, and
 $V_{j}$ is the bulk particle (solid-phase) velocity, measured at the jet exit (
 $z/D = 0$).
3. Description of continuous-phase flow structures
Before discussing the particle dispersion in detail, the important features of the continuous-phase flow in terms of the time-averaged fields are explained. Figure 5 shows the kinematics of the jet centreline with or without crossflow, as compared with available data in the literature. The trajectories of the time-averaged jet centreline on the  $x$–
 $z$ plane show a streamline starting at the centre of the jet exit (Yuan & Street Reference Yuan and Street1998; Su & Mungal Reference Su and Mungal2004) (figure 5a). As shown, they follow the typical tendency of the decay (diffusion) characteristics of a jet. With crossflow, the jet centreline trajectory tilts toward the leeward side of the exit, which becomes stronger as
 $R$ decreases. Compared with previous studies, the deflection of the present jets is less, in spite of the lower
 $R$. This is because the crossflow blows from a local region near the wind tunnel floor (not covering the entire
 $y$–
 $z$ plane, as in previous studies). It is further noted that the deflection of the jet depends on
 $Re_{D}$ and
 $R$. The jet centreline trajectory can be fitted with a power law of
 $z/D = a(x/D)^{b}$, where
 $a$ and
 $b$ are empirical constants (Mahesh Reference Mahesh2013), and it is found that the exponent
 $b\ ({=}0.60\text {--}0.66)$ in larger
 $R$ cases is larger than that
 $({=}0.17\text {--}0.40)$ in smaller
 $R$ cases. This indicates that the jet evolves farther downstream with a higher
 $R$. Likewise, the constant
 $a\ ({=}1.5\text {--}2.1)$ in smaller
 $R$ cases is smaller than that
 $(a = 6.5\text {--}8.9)$ in larger
 $R$ cases. In detail, the jet in the lower
 $R$ cases is not affected by the Reynolds number (
 $Re_D$), but the jet deflection is determined by the combined effect of
 $R$ and
 $Re_D$ in the cases of higher
 $R$ (weak crossflow). That is, as the Reynolds number increases to
 $Re_{D} = 4030$ (
 $R = 3.5$), the jet is tilted more than that of
 $Re_{D} = 1640$ (
 $R = 3.3$), despite the slightly higher
 $R$ (so that the constant
 $a\ ({=}6.8)$ is smaller than the latter
 $({=} 8.9)$). In the same vein, Muppidi & Mahesh (Reference Muppidi and Mahesh2005) explained that it is difficult for a jet to penetrate a stronger crossflow even with the same
 $R$ because of the thinner crossflow boundary layer, so the jet deflects toward the crossflow-streamwise direction.
Centreline jet characteristics of the continuous-phase flow: (a) jet centreline trajectory; (b) centreline jet velocity ( $\bar {u}_{z,c}/\bar {u}_{zo,c}$) decay along the radial direction; (c) vertical turbulence intensity (
 $u'_{z,c_{rms}}/\bar {u}_{z,c}$) along the centreline. In (a),
 $\times$, Yuan & Street (Reference Yuan and Street1998) (
 $R = 3.3$);
 $\square$, Su & Mungal (Reference Su and Mungal2004) (
 $R = 5.7$). In (b,c),
 $\blacksquare$, Fellouah et al. (Reference Fellouah, Ball and Pollard2009) (
 $Re_{D} = 10,000$);
 ${\bigstar}$, red, Mi, Xu & Zhou (Reference Mi, Xu and Zhou2013) (
 $Re_{D} = 6000$);
 $\blacktriangle$, red, (Tong & Warhaft Reference Tong and Warhaft1994) (
 $Re_{D} = 140\,000$) for a vertical jet flow, and
 $\lozenge$, Keffer & Baines (Reference Keffer and Baines1963) (
 $R = 4.0$);
 $+$, Muppidi & Mahesh (Reference Muppidi and Mahesh2007) (
 $R = 5.7$) for a round jet in crossflow.

Figure 5(b) shows the time-averaged vertical velocity ( $\bar {u}_{z,c}$) profiles along the jet centreline, normalized by
 $\bar {u}_{zo,c}$ at the jet exit. Here, the position of the jet centreline is expressed as the radial (
 $r$) distance from the jet exit as
 $r/D = \sqrt {((x/D)^{2}+(y/D)^{2}+(z/D)^{2}}$. For a typical straight jet (without crossflow), the velocity does not undergo a decay up to
 $z/D \simeq 5.0$ (Fellouah et al. Reference Fellouah, Ball and Pollard2009; Mi et al. Reference Mi, Xu and Zhou2013). This is because the effective mixing by the issued jet does not spread sufficiently wide to penetrate the centreline near the jet exit, and the entrainment of ambient flow is not substantial there, i.e. inducing a ‘potential core’ (Namer & Ötügen Reference Namer and Ötügen1988). Unlike previous studies, the jet flow in this study begins to decelerate immediately after the jet exit, with a small peak at the
 $z/D$ range of
 ${\sim } 1.0\text {--}2.0$; this is attributed to the encouraged entrainment of the surrounding air to the jet centre (at
 $z/D < 5.0$) from the enhanced turbulence, via the mesh screen installed at the jet exit. At
 $z/D > 10.0$, the decay of
 $\bar {u}_{z,c}$ along the radial distance has no significant variation with
 $Re_{D}$, and is similar to the others. Nevertheless, it is possible to model the decay of the jet velocity along the vertical (
 $z$) direction as
 $\bar {u}_{z,c}(z)/\bar {u}_{zo,c}=B/(z/D -z_{\circ }/D)$, with the reference position denoted as
 $z_{\circ }$ (Pope Reference Pope2003); this model holds for the region of monotonically decaying behaviour. For the present cases, the decay constant (
 $B$) is empirically determined as 4.97–6.2 (
 $Re_{D} = 1740\text {--}5200$), approximately agreeing with the values from previous studies (
 $5.04$ and
 $5.9$ at
 $Re_{D} = 4000$ and
 $6000$, respectively (Mi et al. Reference Mi, Xu and Zhou2013);
 $5.59$ at
 $Re_{D} = 10\,000$ (Fellouah et al. Reference Fellouah, Ball and Pollard2009)). This implies that the present flows follow the self-similar characteristics of a fully developed jet. With crossflow, the centreline velocity (
 $\bar {w}_{c}$) decays faster as
 $R$ decreases. For a higher
 $R\ ({\sim }3.0)$, the decaying rate of
 $\bar {u}_{z,c}$ is similar to that of jets without crossflow up to
 $r/D = 5.0\text {--}6.0$, and becomes slightly faster downstream. Compared with the previous studies (
 $R \simeq 4.0\text {--}5.7$) with a round jet in crossflow (Keffer & Baines Reference Keffer and Baines1963; Muppidi & Mahesh Reference Muppidi and Mahesh2007),
 $\bar {u}_{z,c}$ decreases more slowly despite a smaller
 $R \sim 3.0$. That is,
 $\bar {u}_{z,c}$ decays at a rate of
 $(r/D)^{-1.3}$ for a transverse jet with crossflow (Smith & Mungal Reference Smith and Mungal1998; Muppidi & Mahesh Reference Muppidi and Mahesh2007), but it decays at a rate of
 $(r/D)^{-0.4}-(r/D)^{-0.3}$ for the present cases of
 $R \sim 3.0$. Then, the decaying rate of
 $\bar {u}_{z,c}$ changes at
 $r/D \simeq 10.0$ in the previous studies, but it is quite constant for the present cases. This is because the mass flux of the locally blown crossflow is too small to sufficiently bend and separate the jet toward the leeside of the jet. Rather, the sudden change of the decay rate in
 $\bar {u}_{z,c}$ appears for the cases of
 $R \sim 1.0$. As the crossflow becomes stronger (
 $R \sim 1.0$), the centreline jet velocity experiences a sharp decrease earlier (up to
 $r/D = 3.0-4.0$), and then the decaying slope becomes similar to that of a vertical jet. Here,
 $\bar {u}_{z,c}$ decays at a rate of
 $(r/D)^{-1.4} - (r/D)^{-0.7}$ for the upstream jet with a strong crossflow, which is similar to the cases of higher
 $R$ in previous studies. Although the jet evolution at a certain value of
 $R$ does not match with the previous studies, due to the partial crossflow specific to the present study, the trend in the change of jet velocity with
 $R$ agrees with each other. Compared with
 $Re_D$, the velocity ratio is more influential in determining the decaying pattern of the jet; within a similar range of
 $R$, the decay rate becomes slower with increasing
 $Re_D$.
The fluctuating nature of the jet (the root-mean-square of the vertical velocity ( $u'_{z,c_{rms}}$) along the centreline) is shown in figure 5(c). In general, the turbulence intensity is measured to be higher than that in previous studies, especially near the jet exit, owing to the mesh screen at the jet exit. In the self-similarity region (
 $z/D > 10.0$), the turbulence intensity tends to be saturated for a vertical jet (Tong & Warhaft Reference Tong and Warhaft1994; Fellouah et al. Reference Fellouah, Ball and Pollard2009; Mi et al. Reference Mi, Xu and Zhou2013); this is also found for the present case of
 $Re_{D} = 5200$. When
 $Re_D$ is lower, the turbulence intensity continues to increase, even after
 $z/D \simeq 10.0$ (Namer & Ötügen Reference Namer and Ötügen1988; Suresh et al. Reference Suresh, Srinivasan, Sundararajan and Das2008; Xu et al. Reference Xu, Pollard, Mi, Secretain and Sadeghi2013). Suresh et al. (Reference Suresh, Srinivasan, Sundararajan and Das2008) explained that this is because the large-sized vortices, mostly forming in a lower
 $Re_{D}$ jet, cause more entrainment and jet decay, preventing the jet from approaching the fully developed state. With crossflow, the turbulence intensity increases with decreasing
 $R$ and
 $Re_D$; it is affected more by the change in
 $R$ than by that in
 $Re_D$. This is because the flow characteristics including the turbulence along the centreline are governed by the dynamics of CVP. When the velocity ratio is small (strong crossflow),
 $u'_{z,c_{rms}}$ starts to increase sharply at
 $r/D = 2.5$, owing to the wake vortices near the floor (Fric & Roshko Reference Fric and Roshko1994). A slight decrease in
 $R$ increases the effect of the wake vortex, causing
 $u'_{z,c_{rms}}$ to increase more rapidly downstream (detailed vortical structures are discussed below). As
 $R$ increases (weak crossflow), however, the influence of
 $Re_D$ becomes stronger. Up to
 $r/D = 6.0$, a stronger turbulence is induced with a higher
 $Re_D$, which is reversed downstream. Meanwhile,
 $u'_{z,c_{rms}}$ of a previous study (
 $R = 4.0$, Keffer & Baines Reference Keffer and Baines1963) approaches the same value as that in the potential cores of a jet (without crossflow), and increases dramatically in the downstream, showing a much higher value than those of
 $R \sim 3.0$ cases. These phenomena will be theoretically discussed further in regards to the pressure distribution (mechanism of CVP formation).
Figures 6 and 7 show the time-averaged non-dimensional vorticity contours and velocity vector fields (normalized by  $D$ and
 $\bar {u}_{m}$) for different
 $R$ values (without and with crossflow, respectively) on the
 $x$–
 $z$ and
 $x$–
 $y$ planes. Without crossflow (
 $R = \infty$), the vortical structure in the
 $x$–
 $z$ planes simply shows a pair of transverse vortical structures (
 $\omega _{y}^{*}$) that gradually dissipate along the vertical direction (figure 6a). In the horizontal planes the flow structure is much less coherent, and the vertical vorticity (
 $\omega _{z}^{*}$) component, much smaller than
 $\omega _{y}^{*}$ in the
 $x$–
 $z$ planes, is scattered and dispersed out of the jet centre (figure 6b). The strength of
 $\omega _{z}^{*}$ does not decay much along the vertical direction, as it is driven by the diffusive spreading motion, rather than the jet inertia. In contrast, in the
 $x$–
 $z$ planes, the vortical structures become wider along the vertical (up to
 $z/D = 20.0$) and transverse (up to
 $y/D = 1.0$) directions, and are mostly driven by the jet inertia.
Vorticity ( $\bar {\omega }_{y}^{*}= \bar {\omega }_{y}D/\bar {u}_{m}$ or
 $\bar {\omega }_{z}^{*}= \bar {\omega }_{z}D/\bar {u}_{m}$) contours and velocity vectors in a time-averaged air jet flow without crossflow (
 $Re_{D} = 2450$): (a)
 $x$–
 $z$ planes at
 $y/D = 0$,
 $0.5$ and
 $1.0$; (b)
 $x$–
 $y$ planes at
 $z/D = 0.5$,
 $2.0$,
 $5.0$ and
 $10.0$. Velocity vectors are normalized by
 $\bar {u}_{m}$.

Vorticity ( $\bar {\omega }_{y}^{*}= \bar {\omega }_{y}D/\bar {u}_{m}$ or
 $\bar {\omega }_{z}^{*}= \bar {\omega }_{z}D/\bar {u}_{m}$) contours and velocity vectors in a time-averaged air jet flow with crossflow: (a,b)
 $R = 3.0$ (
 $Re_{D} = 2440$); (c,d)
 $R = 1.1$ (
 $Re_{D} = 1170$). Velocity vectors are normalized by
 $\bar {u}_{m}$.

When the jet encounters the crossflow, the vortical structures on the  $x$–
 $z$ planes are deflected to the leeward side and a coherent flow structure, i.e. the CVP is observed on the
 $x$–
 $y$ planes. Its dynamics is governed by the velocity ratio. For a higher velocity ratio (
 $R = 3.0$ at
 $Re_{D} = 2440$, for example), the negative
 $\omega _{y}^{*}$ on the windward side is slightly larger than the positive one on the leeward side, owing to the development of jet shear-layer vortices (figure 7a). The shear-layer vortices contribute to the folding of the jet vortex sheets and the tilting of its trajectory, such that a structured CVP is induced (figure 7b). Owing to these ‘tilting and folding’ behaviours, the contours of the transverse vorticity and the vectors of the jet velocity are bent more to the leeward side near the jet exit on the jet shear plane (
 $y/D = 0.5$ and
 $1.0$) than on the jet-centre plane (
 $y/D = 0$) (figure 7a) (Kelso et al. Reference Kelso, Lim and Perry1996; Cortelezzi & Karagozian Reference Cortelezzi and Karagozian2001). Although the magnitude of the
 $\omega _{z}^{*}$ contained in the CVP increases, it is still lower than
 $\omega _{y}^{*}$. In the
 $x$–
 $z$ planes the transverse vortices with opposite signs move away from each other at
 $z/D$ of approximately
 $5.0$; at this location, the CVP is disturbed, and disappears. Rigorously speaking, it is more adequate to say that the coherency of the CVP disappears, based on the vorticity measurements; however, for the concise expression, we will use ‘collapse of CVP’ in the below. This is related to the local crossflow that covers the partial area; the formation of shear-layer vortices outside of the crossflow area is not observed and
 $\omega _{z}^{*}$ contained in the CVP drastically decreases. As
 $R$ becomes as low as
 $1.1$, however, the positive
 $\omega _{y}^{*}$ on the leeward side is significantly enhanced in the
 $x$–
 $z$ planes (figure 7c). This is caused by the stronger crossflow boundary-layer vortices, which play a role in bending the jet significantly toward the leeward side. Owing to the bending, a large hairpin vortex is created near the jet exit (Mahesh Reference Mahesh2013). The head of the hairpin vortex is represented as a positive transverse vortex at the
 $x$–
 $z$ planes (
 $y/D = 0$ and
 $0.5$) (figure 7c) and two legs are shown as a large CVP at
 $x$–
 $y$ planes of
 $z/D = 0.5$ and
 $1.0$ (figure 7d). At this smaller
 $R$, the magnitudes of
 $\omega _{z}^{*}$ and
 $\omega _{y}^{*}$ are comparable to each other (the vorticity contained in the CVP is slightly higher than that in the hairpin head). The distance between the counter-rotating vortices on the
 $x$–
 $y$ plane increases as well.
Figure 8 shows the instantaneous CVP structure in  $x$–
 $y$ planes, comparing the cases of
 $R = 3.0$ and
 $1.1$. Similar to the time-averaged flow fields, it is observed that the CVP forms near the jet exit and evolves (deflected horizontally) depending on the velocity ratio. The integrity and size of the instantaneous CVP are greater for the lower
 $R$ and the distance between the vortex pair is also larger than that of the higher
 $R$ case. For higher
 $R$, the crossflow passes around the CVP above the jet exit and is entrained into the jet at the leeside of the jet exit. Along the vertical direction, the CVP is developed by the entrained crossflow up to
 $z/D \simeq 5.0$ (figure 8a). On the other hand, for lower
 $R\ ({=}1.1)$, the strong counter-rotating vortices are further distanced from each other along the lateral direction because the jet and crossflow are separated at the windward side of the jet near the jet exit (
 $z/D < 2.0$) (figure 8b). The separation of jet and crossflow is attributed by an adverse pressure gradient above the jet exit (see below) which is the cause of CVP formation proposed by previous studies (Fric & Roshko Reference Fric and Roshko1994; Sau et al. Reference Sau, Sheu, Hwang and Yang2004; Muppidi & Mahesh Reference Muppidi and Mahesh2005). The time-averaged and instantaneous vortical structures in the present square jet with a partial crossflow matches with previous studies (Sau et al. Reference Sau, Sheu, Hwang and Yang2004; Plesniak & Cusano Reference Plesniak and Cusano2005), which explained that the square jet also interacts with the crossflow like the behaviour of the round jet and forms the same vortical structures, the CVP. This is important because our major focus is the experimental and theoretical establishment of a particle dispersion pattern resulting from the interaction between the particles and spatially developing coherent vortical structure like the CVP.
Instantaneous vorticity ( $\omega _{z}^{*}= \omega _{z}D/\bar {u}_{m}$) contours and velocity vectors in the instantaneous air jet flow with crossflow in
 $x$–
 $y$ planes at different
 $z/D$'s: (a)
 $R = 3.0$ (
 $Re_{D} = 2440$); (b)
 $R = 1.1$ (
 $Re_{D} = 1170$). Velocity vectors are normalized by
 $\bar {u}_{m}$.

The dynamics of the CVP can be understood by analysing the pressure distribution in the flow (Muppidi & Mahesh Reference Muppidi and Mahesh2005). To achieve this, we estimate the pressure distribution based on the time-averaged velocity field. By taking the divergence of the Reynolds-averaged Navier–Stokes equation in the Cartesian coordinate system, we can obtain an elliptic equation for the pressure (called the Poisson equation), expressed as
 \begin{equation} \nabla^{2}\bar{p} = \rho_g \frac{\partial}{\partial x_i} \left(-\frac{\partial}{\partial x_{i}}(\bar{u}_{i}\bar{u}_{j}) + \nu\nabla^{2}\bar{u}_{j}-\frac{\partial}{\partial x_{i}}\overline{u'_{i}u'_{j}}\right). \end{equation}
By solving this equation based on the measured velocity field, we obtain the pressure field; (3.1) is spatially integrated using a Poisson solver based on a differential matrix with a fractional step (central difference scheme) and bi-conjugate gradient stabilized method (Rosenfeld, Kwak & Vinokur Reference Rosenfeld, Kwak and Vinokur1991; Vuorinen & Keskinen Reference Vuorinen and Keskinen2016). This is a common way of obtaining pressure fields from velocity field data and has been adopted in experimental and numerical studies (Choi & Park Reference Choi and Park2018; Ferreira & Ganapathisubramani Reference Ferreira and Ganapathisubramani2020). Figure 9 shows the time-averaged pressure coefficient ( $\bar {c}_{p}$) calculated as
 $\bar {c}_{p} = (\bar {p}-p_{\infty })/(0.5\rho _{g} u_{\infty }^{2})$, where
 $u_{\infty }$ and
 $p_{\infty }$ are the velocity and pressure at the crossflow free stream (
 $x/D = -2.2$ and
 $z/D = 1.5$), respectively, with the trajectories of the jet and vortex. As illustrated in figure 9(a), the vortex trajectory is tracked as the positions of the local vorticity maxima on the
 $n$-coordinate, perpendicular to the
 $s$-coordinate along the centreline.
(a) Schematics of  $n-s$ coordinates along the jet centreline. (b,c) Time-averaged pressure coefficient (
 $\bar {c}_{p}$) contours of continuous-phase flow with crossflow at the centre plane (
 $y/D = 0$):
 $R = 1.1$ and
 $Re_{D} = 1170$ (b);
 $R = 3.0$ and
 $Re_{D} = 2440$ (c). In (b,c), the solid line and circles denote the centreline and vortex trajectory, respectively.

When the velocity ratio is small, the pressure field in the flow is found to be similar to that in previous studies (Sau et al. Reference Sau, Sheu, Hwang and Yang2004; Muppidi & Mahesh Reference Muppidi and Mahesh2005). That is, an adverse pressure gradient is induced above the jet exit (figure 9b), by which the jet is separated early, and the hairpin vortex (shows up as CVP in  $x$–
 $y$ planes) forms thereafter. Simultaneously, the separated crossflow is entrained into the hairpin vortex and strengthens it. Owing to the jet separation, the entrained flow moves out of the jet-centre plane (
 $y/D = 0$), as shown in figure 8(b). Thus, the jet velocity and turbulence intensity along the centreline decline drastically before the hairpin vortex collapses (figure 5b,c). As the hairpin vortex is formed near the jet exit and collapses immediately owing to a sufficiently higher
 $Re_D$ (
 ${>}600$; see Sau & Mahesh Reference Sau and Mahesh2008), the wake trajectory starts at the lower pressure region formed immediately above the exit, and staggers unstably following the centreline after
 $z/D = 2.0$. Figure 10(a) shows the trajectories of the jet centreline and vortex for three cases with lower
 $R$. As shown, a similar phenomenon is measured regardless of the difference in
 $Re_D$. When the jet is deflected the most (
 $R = 1.0$), the vortex trajectory oscillates quite unstably, and moves toward the bottom, owing to the wall vortices (highlighted with an arrow in figure 7c). This contributes greatly to enhancing the turbulence level downstream (figure 5c). Also, as
 $R$ becomes slightly smaller from
 $1.2$ to
 $1.0$, the magnitude of the adverse pressure gradient becomes larger, so that the jet is further bent to the floor (figure 5a), increasing the influence of wall vortices. As a result, the jet velocity further decreases downstream after the collapse of CVP, and conversely, the turbulence intensity increases more (figure 5b,c). Wall vortices induced by the larger flux of crossflow and stronger collapsed CVP enhance the turbulence level downstream much more than that of higher
 $R$ cases. Thus, for lower
 $R$ cases, the jet is separated earlier near the jet exit; as such, the hairpin vortex is formed subsequently regardless of
 $Re_D$, and collapses near
 $z/D = 2.0$ (figure 10b).
Dynamics of the CVP for lower  $R$ cases: (a) trajectories of the jet centreline (lines) and vortex (symbols) at the centre-plane (
 $y/D = 0$); (b) vorticity contours (
 $\bar {\omega }_{z}^{*}$) and velocity vectors on the
 $x$–
 $y$ plane (at
 $z/D = 2.0$).

When the velocity ratio is large (weak crossflow), the pressure distribution is considerably different from the typical case of a strong crossflow (figure 9c). As shown, there is no higher-pressure region (adverse pressure gradient) above the jet exit; thus, the jet evolves without being separated by the crossflow. Rather, a very low-pressure region is formed on the jet exit so that the crossflow is entrained into the jet, by which the CVP is formed. As the flux of the crossflow in this condition is not large, the CVP is not stronger than in cases with lower values of  $R$. In addition, the vortex trajectory represents the centre of the CVP (Muppidi & Mahesh Reference Muppidi and Mahesh2007). Accordingly, the boundary of the lower pressure zone corresponds to the location where the CVP starts to collapse. As shown in figure 9(c), the low-pressure region formed by the crossflow ends approximately at
 $z/D = 5.0$, after which the vortex trajectory deviates and spreads along the
 $x$-axis. Moreover, the level of crossflow entrainment is affected by
 $Re_D$. Figure 11(a) illustrates the jet centrelines and vortex trajectories for cases with higher
 $R$. For all cases, the vortex trajectory initially follows the jet centreline and then starts to separate at some downstream location. As
 $Re_D$ increases, more mass flux is entrained into the jet, and the point at which the CVP collapses is gradually pushed downstream, as indicated by the arrows in the figure. Figure 11(b) clearly shows the state of the collapsed or collapsing CVP as measured at
 $z/D = 5.0$ for each case. Interestingly, this location matches the position where the dependency of the turbulence intensity on
 $Re_{D}$ is reversed (figure 5c). When the crossflow is not strong, the flux of entrained crossflow is dependent on the Reynolds number; the higher the
 $Re_D$, the more crossflow entrained in the jet. The greater entrained flux generates a higher vorticity and turbulence intensity in the CVP. After the CVP collapses, the effect of crossflow disappears and simple jet vortices are created in the lower
 $Re_D$ cases, further decaying the jet centreline velocity and increasing the turbulence intensity. On the contrary, Muppidi & Mahesh (Reference Muppidi and Mahesh2007) explained that CVP is continuously developed as the crossflow entrains into the jet at the downstream, which supports the sudden increase of turbulent intensity (figure 5c). The entrained flow is concentrated to the jet centre in the present cases (see figure 8), so that it hardly reduces the upstream jet centreline velocity. On the other hand, the CVP with a lower
 $R$ was fully evolved entraining the separated crossflow, so that the jet velocity decay rate became faster from
 $(r/D)^{-0.6}$ to
 $(r/D)^{-1.3}$ (figure 5b); most of the entrained flux moved out of the jet-centre plane owing to the separated jet (Mahesh Reference Mahesh2013). The velocity decay rates of previous studies are comparable to those of lower
 $R$ cases of the present study. In this context, the factors that dominate the evolution of the flow characteristics along the centreline is related to the mechanism of CVP formation. Below, we explain the dispersion behaviours of particles in interactions with the above-mentioned flow structures.
Dynamics of the CVP for higher  $R$ cases: (a) trajectories of the jet centreline (lines) and vortex (symbols) at the centre-plane (
 $y/D = 0$); (b) vorticity contours (
 $\bar {\omega }_{z}^{*}$) and velocity vectors on the
 $x$–
 $y$ plane (at
 $z/D = 5.0$).

4. Particle dispersion (concentration) according to the vortical structures in the jet
4.1. Decay of particle concentration away from jet exit (particle source)
In this section we evaluate the characteristics of the three-dimensional particle dispersion depending on  $R$ and
 $St$. Figure 12 shows typical instantaneous particle distributions (raw images) for selected cases of lower
 $R$ (
 ${\sim }1.0$) and higher
 $R$
 $({\sim }3.0)$ values, in which the CVP is generated in the flow (figures 7, 10 and 11). The most prominent feature in this figure is the distinguishable difference in the particle distribution characteristics near the jet exit (
 $z/D = 0.5$) with
 $R$. When
 $R \sim 1.0$, the solid particles of
 $St = 0.01$ and
 $0.965$ are dispersed by the coherent vortex structure near the jet exit, but the detailed pattern is different (figure 12a). When
 $St \lesssim 1.0$, we observe a
 $C$-shaped particle cluster whose leading edge is located at the jet exit, owing to a strong CVP. As the jet develops, the particles with
 $St \ll 1.0$ are transported along not only the transverse (
 $y$) direction, but also the crossflow-streamwise (
 $x$) direction at
 $z/D = 2.0$, where the CVP starts to collapse. Nevertheless, a large number of particles still gather at the leading edge of the
 $C$-shaped cluster when the Stokes number is close to
 $1.0$. When
 $St \gg 1.0$, the particles tend to spread independently of the vortex structure; they are clustered only above the jet exit and disperse uniformly along the streamwise and transverse directions.
Raw images measured for the solid particle dispersion on  $x$–
 $y$ planes for selected cases with crossflow: (a)
 $R \sim 1.0$. (b)
 $R \sim 3.0$.

On the other hand, for higher  $R$ cases (
 ${\sim }3.0$), most of the particles are detected on the jet exit, as the particle movement is less affected by the CVP (figure 12b). Rather, after the CVP collapses, a relatively vague
 $C$-shaped particle cluster is observed for
 $St \lesssim 1.0$ away from the exit (
 $z/D$ value of
 ${\sim }5.0$). Unlike the lower
 $R$ cases (figure 12a), the particles gather at the leading edge of the
 $C$-shaped cluster, even at
 $St \ll 1.0$. For
 $St \gg 1.0$, the particles move independently of the vortex structures, and tend to spread in the transverse direction above the jet exit. As shown in this representative data, it is clear that the responses of the particles to the coherent vortex structure change mainly according to
 $St$ as the velocity ratio decreases. As discussed in § 3, the vertical jet (without crossflow) does not change substantially with
 $Re_D$. With crossflow, the global pictures of the vortical structures are not affected drastically by
 $Re_D$, but it needs to be considered when the crossflow is weak (higher
 $R$ cases). The effect of
 $Re_D$ (inertia) on the particle dispersion (if any) is reflected in
 $St$.
To quantitatively analyse the particle dispersion, the radial ( $r/D$) distribution of the particle concentration is evaluated for the time-averaged solid-phase fields on each of the four
 $x$–
 $z$ planes (
 $y/D = 0$,
 $0.5$,
 $1.0$ and
 $2.0$). The corrected local concentration values are normalized by the bulk concentration as
 $\hat {\varTheta } = \bar {\varTheta }_{c}/\bar {\varTheta }_{b}$ (see § 2.4). Figure 13 shows the concentration distributions for selected cases, and the data in each
 $x$–
 $z$ plane are distinguished with different colours. In figure 13 the border of the data indicates the maximum concentration (
 $\hat {\varTheta }_{m}$), as measured at the radial distance from the jet exit (particle source). For all cases, it is found that the maximum value begins to decrease steeply from the particle source (
 $r/D = 0$); subsequently, the decay rate becomes quite slow away from the origin. We define the location at which the decaying rate changes as a division point (
 $P_d$). To determine
 $P_d$ consistently, forward (FD) and backward (BD) differentials of the maximum concentration are calculated as
 $\textrm {FD}_{i}=(\hat {\varTheta }_{m,N}-\hat {\varTheta }_{m,i})/((r/D)_{N}-(r/D)_{i})$ and
 $\textrm {BD}_i=(\hat {\varTheta }_{m,i}-\hat {\varTheta }_{m,1})/((r/D)_{i}-(r/D)_{1})$, where
 $i = 1,\ldots , N$ (
 $N$: last position with the data of
 $\hat {\varTheta }$). The position of the maximum BD is designated as
 $P_d$. The values of BD and FD at the position of
 $P_d$ are referred to as
 $G_1$ and
 $G_2$, respectively, indicating a representative decaying rate in each realm. As noted in figure 13, the position of
 $P_d$ moves toward the source as
 $R$ decreases. Accordingly, without crossflow,
 $P_d$ appears at
 $r/D > 20.0$, with a slower decaying slope (figure 13a); however, with crossflow, the particle concentration decreases at a faster rate, and the position of
 $P_d$ occurs at
 $r/D < 10.0$ (figure 13b,c). On the other hand, the trend of the concentration peak (distribution) changes across the plane of
 $y/D = 1.0$, and we think this is because the
 $y/D = 1.0$ plane corresponds to the edge of coherent vortical structures; jet shear-layer vortex and CVP for the cases without and with crossflow, respectively (figures 6 and 7).
The normalized particle concentration ( $\hat {\varTheta }$) on
 $x$–
 $z$ planes along the radial (
 $r$) direction, with the locations of
 $P_d$ and
 $P_o$ denoted: (a) without crossflow (
 $Re_{D} = 2450$ and
 $St = 1.5$); (b)
 $R = 3.0$ (
 $Re_{D} = 2440$ and
 $St = 1.485$); (c)
 $R = 1.0$ (
 $Re_{D} = 1170$ and
 $St = 0.965$). Red colour, at
 $y/D = 0$; blue,
 $0.5$; green,
 $1.0$; magenta,
 $2.0$.

Figure 14 shows the variation in the location,  $P_d$, and corresponding concentration decay rates (
 $G_1$ and
 $G_2$) when varying
 $St$ and
 $R$. As explained above, with a stronger crossflow,
 $P_d$ tends to move toward the particle source (figure 14a), and the decaying slope (
 $G_1$) in the fast-decaying region becomes steeper (figure 14b). Downstream after
 $P_d$, the slope
 $G_2$ is approximately equal to
 $0.1$, irrespective of
 $R$ and
 $St$. It is noted that
 $G_1$ and
 $G_2$ show similar values in the cases without crossflow, whereas the difference between
 $G_1$ and
 $G_2$ becomes larger with decreasing
 $R$ for cases with crossflow. It is thus understood that the region (
 $r < P_{d}$) where most of the particles gather preferentially is confined closer to the jet exit with decreasing
 $R$, in a close relation to the dynamics of the CVP. This is also supported by our observation that the coherent vortical structures disappear at
 $r > P_{d}$.
Characteristics of particle concentration decay depending on  $R$: (a) location (
 $P_d$) where the decaying slope changes; (b) steep (
 $G_1$,
 $\bullet$) and slow (
 $G_2$,
 $\blacktriangledown$) decaying rate of particle concentration. The colours of the symbols represent the corresponding
 $St$.

Without crossflow,  $P_d$ generally appears farther from the jet exit than in cases with crossflow (figure 14a), owing to the weaker and less structured streamwise (vertical) vortices in the jet (figure 6). In addition, particles with a smaller
 $St$ are dispersed further (
 $P_d$ increases), as the particles are more readily attracted by the jet. Moreover, regardless of the position of
 $P_d$, the decay rates of
 $G_1$ and
 $G_2$ are quite similar (figure 14b), indicating that particle movements spread more or less uniformly along the radial direction from the source; they do not concentrate at specific locations, and simply disperse away at a constant rate. With crossflow, the position of
 $P_d$ becomes closely connected to the location where the CVP is substantially dissipated (figures 7, 9). The particles interact with the CVP actively, and most of them are confined inside the vortices. Thus, the locations of
 $P_d$ do not show a stronger dependency on
 $St$ than on
 $R$. However, when the velocity ratio is high, the effect of
 $Re_D$ appears in a few cases, as explained above. For example, for
 $St = 14.18$,
 $P_{d}$ (
 $=6.5D$) appears a little further than the position (
 $=4.0\text {--}5.0D$) of the CVP collapse. As the
 $Re_D$ is low (
 $Re_{D} = 1640$) in this case, the entrained flux contributing to the CVP formation is small, and the particles with large inertia (
 $St > 10.0$) are not confined in the CVP, but rather spread along the jet.
Unlike  $P_d$, the decaying slope
 $G_1$ varies quite widely depending on
 $St$, in both lower and higher
 $R$ cases (and also on
 $Re_D$, to some extent, in higher
 $R$ cases) (figure 14b). For the lower
 $R$ cases, the slope
 $G_1$ becomes steeper as the Stokes number increases. As shown in figures 7(c) and 7(d), the coherency of the CVP is enhanced, but it spans a narrow region near the jet exit when the velocity ratio is low. As the particles with
 $St < 1.0$ are captured by the vortical structures and those with a higher
 $St$ are driven mostly by the inertia gained from the jet momentum, the particle concentration decays slowly when
 $St$ is smaller. In contrast, the slope
 $G_1$ becomes milder as the velocity ratio increases to
 ${\sim }3.0$, as the CVP is further elongated from the jet exit (figure 7a,b), and carries the particles away from it. Interestingly, the influence of
 $St$ is now reversed as compared with the cases of
 $R$ near
 $1.0$. The particles with a smaller
 $St$ experience a sharper decay of particle concentration away from the source (figure 14b). This is because the upward elevation of the particles by the jet is stronger than that captured by the CVP. Slope
 $G_1$ is now more dependent on
 $Re_D$;
 $G_1$ increases as
 $Re_D$ decreases. As more flux of the crossflow is entrained to the jet, it strengthens the growth of the CVP and the particles are swept over a wider area.
To further understand the localized particle concentration relative to the evolution of the CVP, we investigated the correlation between vortex trajectory and particle concentration in the centre plane. Figures 15 and 16 show the particle concentration profiles along the  $n$-axis, following the
 $s$-axis (see figure 9(a) for the definition of axes). It is noted that each profile is shifted to locate the origin (
 $n/D = 0$) on the position of the CVP centre, by which the relative position of the particle cluster to the vortex can be compared consistently. When the velocity ratio is high (
 $R \sim 3.0$), the concentration peaks are located on the windward side of the CVP centre, regardless of
 $St$, up to
 $s/D = 2.0$ (figure 15). After the collapse of the CVP at
 $s/D \simeq 5.0$, the particles with
 $St \lesssim 1.5$ migrate toward the CVP centre, showing a blunt and lower concentration peak. That is, the particles disperse along the
 $n$-axis in the centre plane after the collapse of the CVP. For
 $St > 1.5$, however, the peak location is almost the same along the
 $s$-axis. After the CVP collapses, the peak value decreases but still shows a sharp profile. This is because the larger particle inertia causes a weak interaction between the particles and CVP. In all cases except for
 $St = 1.485$, the magnitude of the peak is significantly reduced (up to
 $25\,\%$) after the collapse of the CVP at
 $s/D \simeq 5.0$; in contrast, the peak magnitude is decreased by approximately
 $50\,\%$ for
 $St = 1.485$. Given this occurrence, the particles with
 $St = 1.485$ are dragged more by the developing CVP to the windward side, and move to the CVP centre with a reaction after the CVP collapse. Recalling figure 12(b), it is noted that the leading edge of the
 $C$-shaped cluster, which is more conspicuous than that of
 $St \ll 1$, is located on the leeside of the jet exit.
Particle concentration profiles along the  $s$-axis for
 $R = 3.0\text {--}3.5$, depending on
 $St$.

Particle concentration profiles along the  $s$-axis for
 $R = 1.0\text {--}1.2$, depending on
 $St$.

For lower  $R$ cases (
 $R \sim 1.0$), the concentration peak location moves slightly toward the CVP centre as
 $St$ (especially for
 $St < 1.0$) decreases, at
 $s/D < 2.0$ (figure 16). As shown in figure 9(b), the CVP is generated by the jet separation, forming a lower-pressure zone along the CVP centre, and resulting in the accumulating of particles. After the collapse of the CVP (
 $s/D \simeq 2.0$), the peaks of
 $St < 1.0$ match the CVP centre, and the peaks of
 $St > 1.0$ are located at the same position along the
 $s$-axis. The magnitude of the peak (
 $St < 1.0$) decreases significantly after CVP collapse, but that of
 $St > 1.0$ is reduced less. This is because the particles with low inertia are transported uniformly along the
 $n$-axis by a stronger CVP. For
 $St = 0.965$, similar to the case of
 $St = 1.485$ (
 $R \sim 3.0$), the concentration peak of approximately half the magnitude of that at the jet exit (
 $s/D = 0.5$) moves to the CVP centre in the centre plane. This phenomenon is observed in figure 12(a); the particles are transported along the
 $x$ and
 $y$ directions, but remain concentrated on the leading edge of the
 $C$-shaped cluster (leeward side of the jet exit).
From the radial distribution of particle distribution in figure 13, we can define the specific position ( $P_o$) where the out-of-plane movement (along the
 $y$-direction) of the particles is encouraged, such that the radial position of
 $\hat {\varTheta }_{m}$ appears away from the centre (
 $y/D = 0$) plane (figure 17). The position of
 $P_d$ provides information on the range in which the particles are concentrated;
 $P_o$ shows how fast the particles are swept by the vortical structures. As shown in figure 17(a), it is clear that the CVP plays a dominant role in the early sweeping of particles away from the centre plane. When there is no crossflow, or
 $R \sim 3.0$ (higher
 $R$ cases),
 $P_o$ becomes longer (it takes longer from the jet exit) with decreasing
 $St$. As the velocity ratio decreases to
 ${\sim }1.0$ (lower
 $R$ cases), the trend is reversed. Without crossflow, the flow along the vertical direction is so strong that it forces most of the particles to move upward. Once the particles lose their initial momentum, they tend to spread laterally. Therefore, the transition of the transverse plane with
 $\hat {\varTheta }_{m}$ with a smaller
 $St$ occurs farther from the jet exit. This is similar to the cases with higher
 $R$ (with crossflow) at which the CVP develops; however, the jet shear layer in the vertical velocity is stronger than
 $\omega _z$ in the CVP (figure 7a,b). In this case,
 $P_o$ is shorter than that without crossflow, owing to the existence of the CVP upstream of the jet. For
 $R \sim 1.0$, the CVP becomes sufficiently strong such that the out-of-plane movement of particles is more dominant than the elevation from the upward jet momentum, resulting in a decrease in
 $P_o$ with a smaller
 $St$. Thus, it is understood that the particle movements and range at which they are preferentially gathered are controlled through the combination of
 $R$ and
 $St$; the stronger and more coherent the vortices in the flow, the more particles (
 $St < 1.0$) swept out of the centre plane.
Characteristics of the particle sweeping by vortex: (a) variation of  $P_o$ with
 $R$ and
 $St$; (b) particle concentration at
 $Po$.
 $\bullet$, red,
 $R = \infty$ (no crossflow);
 $\triangle$,
 $R \sim 3.0$ (higher
 $R$ cases);
 $\blacksquare$, blue,
 $R \sim 1.0$ (lower
 $R$ cases). In (a) the dashed lines denote the trend of
 $P_o$ variation along
 $St$.

In addition, when examining all cases with and without crossflow, the particle concentration at  $P_o$ shows a correlation (exponential decay) with
 $P_o$, as shown in figure 17(b). The particle concentration at
 $P_o$ is quite low for the cases without crossflow, as it appears much farther from the jet exit. As the velocity ratio decreases, the particle concentration at
 $P_o$ increases exponentially. This also supports our understanding of the particle transportation by the CVP in an upward jet with crossflow. As shown in figure 17(a), the position of
 $P_o$ tends to be saturated, as the Stokes number is higher than approximately
 $10.0$ for the cases with crossflow, indicating the influence of the CVP. Without crossflow,
 $P_o$ approaches the jet exit quickly with increasing values of
 $St$.
4.2. Classification of dispersion regime depending on  $St$ and $R$


From the particle concentration characteristics identified above, it is possible to classify particle dispersion regimes based on the dependency of  $P_{o}/P_{d}$ on
 $St$ and
 $R$ (figure 18). As explained above,
 $P_d$ corresponds to the location where the CVP is significantly dissipated, and its coherency disappears. Therefore, at
 $P_{o}/P_{d} > 1.0$ (denoted as regime 1), the particles tend to stay on the jet-centre plane, even after the CVP has collapsed. In contrast, at
 $P_{o}/P_{d} < 1.0$ (regime 2), the particles are dispersed along the lateral direction (out-of-plane movement) before the CVP is dissipated. Finally, regime 3 denotes when
 $P_{o}/P_{d} \simeq 1.0$, indicating that the particles are distributed between the vortex pair, but are transported outward as soon as they disappear. As shown in figure 18(a), with a higher
 $R$
 $({\sim }3.0)$,
 $P_{o}/P_{d}$ is inversely proportional to
 $St$; it transitions from regime 1 to 2 with increasing
 $St$. This is because
 $P_o$ increases with decreasing
 $St$, owing to the jet shear layer. We observed that the particles with
 $St \ll 1.0$ were concentrated on the leading edge of the
 $C$-shaped cluster after the CVP started to dissipate (figures 12b, 15). For
 $St \gg 1.0$, the concentration peak exists above the jet exit at the centre plane, but many more particles are dispersed along the transverse (
 $y$) direction (resulting in a smaller
 $P_o$). For lower
 $R$ cases, the dispersion pattern changes from regime 1 to 2 as
 $St$ decreases (figure 18a), due to the stronger particle sweeping by the CVP. When
 $St < 1.0$, the particles are dispersed to the edges of the earlier CVP, and showing the
 $C$-shaped cluster (regime 2), but those particles with larger inertia (
 $St > 1.0$) do not interact with CVP, and stay at the centre plane independent of the presence of the CVP (regime 1) (figure 12a). Notably, regime 3 approximately corresponds to
 $St \simeq 1.0$, regardless of
 $R$, showing that particles with
 $St \simeq 1.0$ respond most faithfully to the vortices. Irrespective of
 $R$, the particles are captured between the CVP, and then are scattered as soon as it disappears. The particles are still concentrated at the leading edge of the
 $C$-shaped cluster even after the CVP collapses (owing to the residual effect), and most of the particles are simultaneously transported in the transverse (
 $y$) direction within the leading edge (figures 12a, 16).
The evolution of ratio of  $P_o$ to
 $P_d$ which is the criterion of the preferential concentration regime along
 $St$: (a) with a crossflow; (b) without a crossflow. The red circle
 $\bullet$ denotes no crossflow;
 $\triangle$,
 $R \sim 3.0$;
 $\blacksquare$, blue,
 $R \sim 1.0$.

As there is no structured vortex evolution in the cases without crossflow, most of the particles are transported gradually along the jet centreline, and are not swept substantially out of the centre plane before the position of  $P_d$ is reached (figure 18b). When the particles lose their kinetic energy and begin to descend at
 $P_d$, only a small number of particles spread out of the jet centre. Thus,
 $P_o$ is measured to be similar to
 $P_d$ so that
 $P_{o}/P_{d}$ is close to
 $1.0$ (regime 3), except for the case of the largest
 $St$ of
 $21.59$. When
 $St \gg 1$, the ratio becomes considerably smaller (regime 2), owing to the large particle inertia and
 $Re_D$, even though the corresponding mechanism is different from that in the cases with crossflow (from the interaction with the CVP).
4.3. Empirical particle dispersion model
To describe and predict the particle dispersion caused by the interactions with CVP, we suggest empirical particle dispersion models. The empirical models are defined on two planes; one along the jet centreline ( $s$-axis; see figure 9a) in the jet-centre (
 $y/D=0$) plane, and another along the
 $x$-axis in
 $x$–
 $y$ planes (
 $z/D = 0\text {--}5.0$ for
 $R \sim 3.0$ and
 $z/D = 0\text {--}2.0$ for
 $R \sim 1.0$) where the CVP exists. First, we quantitatively evaluate the extent to which the particles disperse along the
 $n$- and
 $y$-axis against the
 $s$- and
 $x$-axis, respectively. Figure 19(a) shows the example of particle concentration distribution (probability density function, p.d.f.) along the
 $n$-axis for the case of
 $R = 1.1$ and
 $St = 0.965$, measured at
 $s/D = 1.0$. The particle concentration is nicely characterized by the p.d.f., so that the standard deviation (
 $\sigma _n$) of the p.d.f. is a good parameter to assess dispersion level. A smaller
 $\sigma$ indicates that the particles are preferentially (locally) concentrated. The result is shown in figure 19(b) and it is found that the variation of
 $\sigma _n$ along the
 $s$-axis can be curve-fitted using a power-law equation in the form of
 $\sigma _{n} = a_{s} (s/D)^{b_{s}}$. Similarly, the standard deviation (
 $\sigma _y$) of the concentration distribution p.d.f. along the
 $y$-axis is obtained at each position along the
 $x$-axis, and modelled as
 $\sigma _{y} = a_{x} (x/D)^{b_{x}}$ (figure 19c).
Development of empirical particle dispersion model based on standard deviation ( $\sigma$) of particle concentration: (a) probability density function (p.d.f.) of particle concentration profile along
 $n$-axis at
 $s/D = 1.0$; (b) variation of
 $\sigma _n$ along
 $s$-axis with empirical dispersion model (solid line) along the jet centreline on
 $y/D = 0$ plane; (c) variation of
 $\sigma _y$ along
 $x$-axis with empirical dispersion model (solid line) on the planes of
 $z/D = 0$,
 $1.0$ and
 $2.0$. In (c),
 $\bullet$, red, at
 $z/D = 0$;
 $\bullet$,
 $1.0$;
 $\circ$,
 $2.0$. Shown in the figure is the case for
 $R = 1.1$ and
 $St = 0.965$.

Figure 20 shows the variation of coefficients with  $St$ in the power-law modelling of
 $\sigma _{n}$ and
 $\sigma _{y}$. When
 $R \sim 3.0$, the coefficient
 $a_s$ increases linearly along
 $St$ (
 $a_{s} \simeq 0.037St + 0.53$) while
 $b_s$ decreases following
 $b_{s} \simeq -0.026St + 0.36$ (figure 20a). This agrees with our explanation that the CVP with a weak crossflow is caused by the entrained flow to the jet-centre plane, and, thus, the small entrained flux induces the particles of lower
 $St$ to gather more locally within the CVP (along the
 $n$-axis), as described in § 3. On the other hand, the model coefficients of lower
 $R$
 $({\sim }1.0)$ cases are roughly constant as
 $a_{s} \simeq 0.15$ and
 $b_{s} \simeq 0.53$, respectively. This is consistent with the fact that the flow around the jet is entrained mostly in the vortices outside the jet-centre plane, forming a large CVP, and the particle dispersion pattern in the jet-centre plane does not change with
 $St$. For the model on the
 $x$–
 $y$ planes, it is also found to agree with our understandings. As shown in figure 20(b), the coefficient
 $a_x$ of
 $\sigma _y$ model increases with
 $St$ in the form of a power law (
 $a_{x} \simeq 0.34St^{0.06}$) and
 $b_x$ decreases as
 $b_{x} \simeq 0.27St^{-0.07}$ for lower
 $R$ cases. This indicates that the particles barely exist in the leeside area of the jet exit;
 $\sigma _y$ increases quite gently along the
 $x$-axis while showing a relatively large value. For
 $R \sim 3.0$ (weak crossflow), the force to push the particles downstream is weaker than that of the lower
 $R$ cases, so that relatively fewer particles spread uniformly downstream. This is well expressed by the models:
 $a_x$ of higher
 $R$ is larger in all
 $St$'s and
 $\sigma _y$ increases more slowly along the
 $x$-axis (smaller
 $b_x$). They are modelled as
 $a_{x} \simeq 0.48St^{0.03}$ and
 $b_{x} \simeq 0.22St^{-0.11}$, respectively.
Coefficients in the empirical particle dispersion models: (a)  $a_s$ and
 $b_S$ for
 $\sigma _n$ model along the jet centreline (
 $s$-axis) on
 $y/D = 0$ plane; (b)
 $a_x$ and
 $b_x$ for
 $\sigma _y$ along
 $x$-axis on
 $x$–
 $y$ planes. Symbols:
 $\vartriangle$,
 $R \sim 3.0$;
 $\blacksquare$, blue,
 $R \sim 1.0$.

Collecting the above results, we have plotted the modelled  $\sigma _n$ and
 $\sigma _y$ for the selected cases in figure 21. For
 $R \sim 3.0$, first of all, a large
 $\sigma _n$ is induced up to
 $s/D = 5.0$ by the weak crossflow entrainment with increasing
 $St$, which is reversed after the CVP collapses (figure 21a). Since
 $\sigma _n$ represents the amount of dispersed particles in the jet-centre plane, this agrees with our observation that the smaller (or larger) the
 $St$, the particles tend to predominantly gather (or be dispersed more or less uniformly) between the counter-rotating vortices until the collapse of the CVP. After the CVP collapses,
 $\sigma _n$ of
 $St = 0.012$ increases most dramatically, indicating that most of the particles stay in the centre plane (corresponding to regime 1) and disperse much evenly therein. For
 $R \sim 1.0$, the value of
 $\sigma _y$ is larger for the case of higher
 $St$ and they get closer along the
 $x$-axis (figure 21b). Although the reversal of
 $\sigma _y$ is not clearly observed, it can still explain the particle dynamics under the interaction with the CVP. Particles of
 $St \ll 1.0$ are swept inside the strong counter-rotating vortices caused by early separation of the jet and crossflow, moving outside of the jet-centre plane, and most of the particles are dispersed downstream by the separated flows. Thus, the
 $\sigma _y$ increases sharply along the
 $x$-axis. As
 $St$ increases, the particle inertia rapidly grows, so that the particles are preferentially gathered inside the CVP and less are dispersed (
 $\sigma _y$ increases slowly along the
 $x$-axis). In particular, particles of
 $St \gg 1.0$ are hardly dragged downstream by the crossflow, and most of them fall immediately near the jet exit.
Particle concentration standard deviation by empirical particle dispersion models: (a)  $\sigma _n$ along the jet centreline on
 $y/D = 0$ plane (for
 $R \sim 3.0$); (b)
 $\sigma _y$ along
 $x$-axis on
 $x$–
 $y$ planes of
 $z/D = 0\text {--}2.0$ (for
 $R \sim 1.0$).

5. Further discussion on particle dispersion in each regime
5.1. Estimation of force components acting on particles
So far, we have explained the particle dispersion behaviour in connection with the dynamics of the coherent vortical structures existing in the upward jet, with and without crossflow. In this section we add to this discussion by estimating the relative order of dominant forces acting on the particles. To estimate the contributions from each force potentially affecting particle movement, we start with force components introduced in a well-known equation for spherical particle motion in a non-uniform flow, as suggested by Maxey & Riley (Reference Maxey and Riley1983). They considered drag ( $F_D$), basset history (
 $F_B$), added mass (
 $F_A$), fluid acceleration (
 $F_{FA}$) and gravitational (
 $F_G$) forces. For the drag force, we use the drag coefficient relation of
 $C_{D} = (24/Re_{p})\cdot (1+0.15Re_{p}^{0.687})$, modified from the Stokes drag law of
 $C_{D}=24/Re_{p}$. As explained in § 2.2, this relation was drawn based on the experimental data at
 $1 < Re_{p} < 800$ (Schiller & Neumann Reference Schiller and Neumann1933). Thus, in the present analysis, the drag force is calculated as follows:
 \begin{equation} F_{D}= \left\{ \begin{array}{@{}ll} 3{\rm \pi}\mu\bar{d}_{p}(u-v) & \mbox{for}\ Re_{p}\leqslant 1, \\ 3{\rm \pi}\mu\bar{d}_{p}(u-v)(1+0.15Re_{p}^{0.687}) & \mbox{for} \ 1 < Re_{p} < 800. \end{array}\right. \end{equation}
In contrast, the added mass ( $F_{A} = 0.5m_{f} \,\textrm {d}(u-v)/\textrm {d}t$,
 $m_f$: mass of the fluid (gas) corresponding to the particle volume) and fluid acceleration (
 $F_{FA}=m_{f} \,\textrm {D}u/\textrm {D}t$,
 $\textrm {D}/\textrm {D}t$: material derivative) forces are assumed to be negligible, as the fluid mass
 $m_f$ is much smaller than
 $m_p$, i.e.
 $\boldsymbol {O}(m_{f}/m_{p}) = 10^{-3}$. The Basset history force contributed by the relative acceleration between the fluid and particles owing to the viscous effect (important for highly viscous or dense particle-laden flows) can also be neglected for relatively dilute (one-way coupling for the present cases) flows where particle collisions are not considered (Coimbra & Rangel Reference Coimbra and Rangel1998). It is noted that the Faxen correction term (including
 $\nabla ^{2}u$) is not considered in calculating the drag and added mass forces, as it is important only when the forces are induced by the flow disturbance in a dense non-uniform flow (Bagchi & Balachandar Reference Bagchi and Balachandar2003). The gravitational body force is calculated as
 $F_{G}=(m_{p}-m_{f})g \simeq m_{p}g$. In addition, there are additional forces that may act on the particles in a complex fluid flow. Given the strong shear (velocity gradient) flows around the particle, the shear-induced Saffman lift force (
 $F_{LS}$) (Saffman Reference Saffman1965) and the Magnus lift force (
 $F_{LM}$) by particle rotation (particle inertia) (Rubinow & Keller Reference Rubinow and Keller1961) are candidates. The Saffman lift force is expressed as
 $F_{LS} = 1.61\mu \bar {d}_{p}^{2}[(u-v)\omega ]/\sqrt {\nu /\omega }$, where
 $\omega$ is the vorticity of the continuous-phase flow. The Magnus lift force is defined as
 $F_{LM}=({\rm \pi} /8) \rho _{g} \bar {d}_{p}^{3} [\varOmega _{r} (v-u)]$, where
 $\varOmega _{r}$ is the relative rotation of the particle as
 $\varOmega _{r} = \varOmega _{p} - 0.5\omega$ (
 $\varOmega _{p} = \text {particle rotation velocity}$). These lift forces are estimated based on the velocity fields of the single-phase jet flow. Finally, the turbophoresis force (Reeks Reference Reeks1983), acting in the direction of decreasing particle turbulent kinetic energy, is also meaningful to consider. In general, the turbophoresis force transports particles towards a solid wall via eddies in the flow. It is proportional to the gradient of the turbulent kinetic energy and is modelled as
 $F_{Turb}=-\rho _{p}\bar {d}_{p}^{3}\partial (\varGamma u'u')/\partial x = -\rho _{p}\bar {d}_{p}^{3}\partial (v'v')/\partial x$, where
 $\varGamma = \tau _{f}/(\tau _{f}+\tau _{p})$ and
 $\tau$ is the time scale (Slater, Leeming & Young Reference Slater, Leeming and Young2003).
Before we calculate the force components addressed above, we estimate their orders of magnitude to identify the dominant components in the present configuration. For the Reynolds number range of  $Re_{p} = {\boldsymbol {O}}(10^{-3}\text {--}10^{-1})$, it is estimated that
 $F_{G}/F_{D} = {\boldsymbol {O}}(10^{-1})$,
 $F_{LS}/F_{D} = {\boldsymbol {O}}(10^{-0.5})$,
 $F_{LM}/F_{D} = {\boldsymbol {O}}(10^{-5})$ and
 $F_{Turb}/F_{D} = {\boldsymbol {O}}(10^{-2})$. Thus, it is considered that the drag force (
 $F_D$) is the most dominant force. For cases of
 $Re_{p} = {\boldsymbol {O}}(1\text {--}10)$, however, the ratios are estimated as
 $F_{G}/F_{D} = {\boldsymbol {O}}(10)$,
 $F_{LS}/F_{D} = {\boldsymbol {O}}(10^{-0.5})$,
 $F_{LM}/F_{D} = {\boldsymbol {O}}(10^{-3})$ and
 $F_{Turb}/F_{D} = {\boldsymbol {O}}(10^{-2})$, so that the gravitational force (
 $F_G$) is dominant, owing to the larger particle size. For all cases, the other forces such as
 $F_{LS}$,
 $F_{LM}$ and
 $F_{Turb}$ are estimated to be considerably smaller than
 $F_{D}$ and
 $F_{G}$ in our configuration. Similarly, previous studies have generally ignored the contributions of lift forces in analysing particle dynamics (Zaichik & Alipchenkov Reference Zaichik and Alipchenkov2005; Goswami & Kumaran Reference Goswami and Kumaran2011; Wang, Zheng & Wang Reference Wang, Zheng and Wang2017b; Liu et al. Reference Liu, Shen, Zamansky and Coletti2020). In the following, we focus on the variation of
 $F_D$ and
 $F_G$ to explain the particle dispersion mechanisms according to
 $St$ and
 $R$. We calculate the local particle forces (
 $F'_{D}=\hat {\varTheta }F_{D}$ and
 $F'_{G}=\hat {\varTheta }F_{G}$) by multiplying each force model (
 $F_D$ and
 $F_G$, being assumed to act on a single particle) with the dimensionless local concentration (
 $\hat {\varTheta }$). Thus, the forces are weighted by the local particle concentration, by which we can compensate for the particle density differences among the IWs. Finally, the local particle forces are normalized as
 $F''=F'/(\rho _{f}\bar {u}_{m}^{2}\bar {d}_{p}^{2})$ to determine the effect of particle inertia (the
 $St$ effect) alone, i.e. not complicated by the fluid flow (the
 $Re_D$ effect).
5.2. Variation of dominant forces with $St$ and $R$


Figure 22 shows the time-averaged horizontal distribution of the vertical drag force ( $\bar {F}''_{D,z}$) and gravitational force (
 $\bar {F}''_G$) along the vertical direction (in the centre plane) for the cases without crossflow. The particle forces exerted along the
 $z$-direction are larger than those in other directions, as the particle movements (or velocities) in the
 $x$- and
 $y$-directions are comparatively negligible. When the Stokes number is quite small (
 $St = 0.013$), a strong drag force is applied near the jet exit, which sustains up to
 $z/D = 5.0$ (figure 22a). The gravitational force is negligible throughout the measurement domain. As the particles are momentarily ejected in the jet, the particle velocity in the
 $z$-direction is slightly higher than that in the fluid near the jet exit, and is lessened away from it. When
 $St$ is
 ${\sim }{\boldsymbol {O}}(1)$, the gravitational force becomes comparable to the drag force, whereas the drag force remains slightly larger (figure 22b,c). Interestingly, the direction of the drag force changes in the positive
 $z$-direction at
 $z/D > 5.0$, where the particle velocity is drastically decelerated by losing its inertia. For
 $St = {\boldsymbol {O}}(10)$,
 $F''_G$ becomes much greater than
 $F''_{D,z}$ (figure 22d,e). As mentioned above, the heavy particles are dragged in the downward direction while being decelerated, and, thus, the positive drag force acts on the particle in the entire region of the jet flow (figure 22e).
Horizontal profiles of forces ( $\bar {F}''$) applied to particles along the
 $z$-direction (without crossflow): (a)
 $St = 0.013$; (b)
 $1.07$; (c)
 $1.5$; (d)
 $15.71$; (e)
 $21.59$. Symbols:
 $\triangledown$, gravitational body force (
 $\bar {F}''_{G}$);
 $\bullet$, drag force in vertical direction (
 $\bar {F}''_{D,z}$). Forces are normalized by
 $\rho _{f}\bar {u}_{m}^{2}\bar {d}_{p}^{2}$.

As the crossflow complicates the flow, the strength and direction(s) of  $F''_{D,z}$ and
 $F''_G$ are affected by the evolution of the vortical structure. Figure 23 shows the distribution of the
 $\bar {F}''_D$ vectors, together with the contours of particle concentration for the selected cases of
 $St \ll 1.0$ (figure 23a,c,e) and
 $St \simeq 1.0$ (figure 23b,d, f) at the centre plane. It is clearly shown that the region of higher particle population is related to the deflection of the upward jet owing to the crossflow. For
 $St \ll 1.0$ and
 $R = 3.3$ (weaker CVP), the drag force acts along the downward direction up to
 $z/D$ of
 $\sim 3.0$, by which a larger particle concentration is measured (figure 23a). This results in particle gathering near the jet exit and does not contribute to the dispersion along the transverse direction (figures 12b and 13). As the CVP becomes stronger (
 $R \simeq 1.0$), it is found that the drag force is also directed more toward the horizontal (
 $x$) direction at
 $z/D \simeq 0.8$ (figure 23c). Although the Stokes number approaches
 $1.0$, unlike in the cases without crossflow (
 $F''_{D} \sim F''_{G}$), the drag force remains dominant. With
 $R = 3.0$, the drag force mostly acts in the downward direction, as in the case of
 $St \ll 1.0$, but it reverses its direction at
 $z/D \simeq 2.0$, at which the jet shear-layer vortices develop and the jet is deflected (figure 23b). As the velocity ratio is reduced (
 $R = 1.1$), a larger
 $F''_D$ is exerted on the particles along the downward direction following the hairpin vortex (figure 23d), which is different from the case of
 $St \ll 1.0$. To understand this difference in detail, we compare the vortical structures with the velocity vectors of the two phases in figures 23(e) and 23(f), for the same conditions of figures 23(c) and 23(d), respectively. As shown, the particle (
 $St = 0.01$) velocity near the jet exit is quite similar to the fluid velocity (figure 23e). In this case, the particles follow the hairpin vortex head perfectly, so that the difference between the solid and gas velocities is negligible. Thus, owing to
 $F''_D$, the particles are pushed into the hairpin vortex, so that the concentration peak appears there (leading edge of
 $C$-shaped cluster), only near the jet exit (at
 $s/D = 0.5$) (figures 12a and 17a). As the Stokes number is closer to
 $1.0$, the particles’ response reflects more of their larger inertia, such that the particle velocity becomes larger than the fluid velocity (figure 23f). Here, the
 $F''_D$ drives the particle to the leading edge of the hairpin vortex, and the particles gather at the windward side (leading edge) of the CVP centre. Although the CVP is weakened at
 $s/D = 2.0$, a similar phenomenon is still observed (figure 12a).
Particle concentration ( $\hat {\varTheta }$) contours and the drag force (
 $\bar {F}''_{D}$) vectors at the centre plane (
 $y/D = 0$): (a)
 $St = 0.012$,
 $R = 3.3$; (b)
 $St = 1.485$,
 $R = 3.0$; (c)
 $St = 0.01$,
 $R = 1.0$; (d)
 $St = 0.965$,
 $R = 1.1$. Vorticity (
 $\bar {\omega }_{y}^{*}$) contours and velocity vectors (red colour, solid particle; black, fluid): (e)
 $St = 0.01$,
 $R = 1.0$; (f)
 $St = 0.965$,
 $R = 1.1$.

To understand the lateral movements of the particles, responding to the CVP, the particle concentrations with drag force vectors on the  $z/D = 0.5$ plane are plotted for the case of
 $R = 1.0\text {--}1.2$, while varying the Stokes number (figure 24). When
 $St = 0.01$, the drag force acts in the two directions, i.e. toward the side edge of the CVP (figure 24a). For
 $St = {\boldsymbol {O}}(1)$, the
 $F''_D$ generally acts toward the leading edge of the CVP (
 $C$-shaped cluster) (figure 24b–d). In particular, a larger
 $F''_D$ is exerted on the particles for
 $St = 0.965$. Thus, the particle concentration on the leading edge of the
 $C$-shaped pattern, even after the CVP collapse, is attributed to this large drag force. As
 $St$ increases, the particle concentration is higher near the jet exit (figure 24e, f). At this location, the particles do not react to the CVP owing to their large inertia, and most fall immediately by gravity.
Particle concentration contours with drag force ( $\bar {F}''_{D}$) vectors on
 $z/D = 0.5$ plane for the case of
 $R = 1.0-1.2$: (a)
 $St = 0.01$; (b)
 $0.771$; (c)
 $0.965$; (d)
 $1.972$; (e)
 $11.33$; (f)
 $27.42$. In each figure lines denote iso-
 $\bar {\omega }_{z}^{*}$ distribution (dashed line: negative value) of continuous-phase flow.

Finally, we describe the out-of-plane migrations of the particles, based on the concentration distributions overlapped with the drag force vectors on various  $x$–
 $z$ and
 $x$–
 $y$ planes. Figures 25 and 26 show cases of
 $R = 3.0$ and
 $1.1$, respectively, when the Stokes number is approximately
 $1.0$. When
 $R = 3.0$ (
 $St = 1.485$), most of the particles reside on the centre plane, as the strength of
 $\omega _{z}^{*}$ is less than half of that of
 $\omega _{y}^{*}$ (figure 25). As shown in figure 25(b), the particles are pushed asymmetrically to the centre of the jet by the drag force from the edge of the CVP, along the vertical range of
 $z/D = 0\text {--}2.0$. Thus, as combined with
 $\omega _{y}^{*}$, the particles are more concentrated at the windward side of the CVP centre (approximately at
 $x/D = 0$). After the vortices in the flow dissipate beyond a
 $z/D$ of
 ${\sim }4.0$,
 $\hat {\varTheta }$ decreases drastically, and shows a relatively uniform distribution in the domain. When the CVP becomes stronger, the particles are affected by both the transverse (figure 26a) and vertical (figure 26b) vortices, whose strengths are more or less comparable. Thus, it is found that the drag force acts primarily toward the leading edge of the CVP (hairpin vortex). After the CVP disappears downstream of
 $z/D = 2.0$, regardless of
 $R$, the drag force that drives the particle migration becomes negligible. The particles are concentrated on the CVP centre (leading edge of
 $C$-shaped cluster) by the reaction of the drag force, and are uniformly transported in the transverse direction with the collapse of the CVP (regime 3) (figures 12, 15 and 16).
Particle concentration contours with drag force ( $\bar {F}''_{D}$) vectors on (a)
 $x$–
 $z$ planes (
 $y/D = 0$,
 $0.5$ and
 $1.0$) and (b)
 $x$–
 $y$ planes (
 $z/D = 0.5$,
 $2.0$ and
 $5.0$) for the case of
 $R = 3.0$ (
 $St = 1.485$). In (a,b), lines denote the iso-
 $\bar {\omega }_{y}^{*}$ and
 $\bar {\omega }_{z}^{*}$ distributions (dashed line: negative value) of continuous-phase flow, respectively.

Particle concentration contours with drag force ( $\bar {F}''_{D}$) vectors on (a)
 $x$–
 $z$ planes (
 $y/D = 0$,
 $0.5$ and
 $1.0$) and (b)
 $x$–
 $y$ planes (
 $z/D = 0.5$,
 $1.0$ and
 $2.0$) for the case of
 $R = 1.1$ (
 $St = 0.965$). In (a,b), lines denote the iso-
 $\bar {\omega }_{y}^{*}$ and
 $\bar {\omega }_{z}^{*}$ distributions (dashed line: negative value) of continuous-phase flow, respectively.

5.3. Illustrative understanding of particle dispersion mechanisms
Our understanding on the particle dispersion is graphically summarized in figure 27. Without crossflow, there are no coherent vortices along the  $z$-direction, and, thus, the typical vertical jet velocity profile determines the overall particle dynamics. That is, the drag and gravitational forces (two forces identified as dominant in the present configuration) act along the negative
 $z$-direction, so that the concentration is not dispersed out of the centre plane, and the concentration decays gradually along the jet centreline. In most cases considering
 $St$, the particle dispersion belongs to regime 3, as forced by the balance in the gravity and jet inertia, and is not induced by the vortex-induced flow (figure 27a). For the highest
 $St = 21.59$, the particles start to spread earlier from the jet exit to the lateral direction, owing to the heavy particles; thus, they approximately belong to regime 2.
Schematics of particle dispersion (in plan view) in the vertical jet with and without crossflow (not drawn to scale): (a) no crossflow; (b)  $R \sim 3.0$ (weak CVP); (c)
 $R \sim 1.0$ (strong CVP). The red arrows denote the direction of drag force.

With crossflow, the CVP formation leads to different components of vorticity in the flow becoming dominant, so that  $\omega _{z}^{*} \sim 0.5\omega _{y}^{*}$ at
 $R \sim 3.0$, and
 $\omega _{z}^{*} \gtrsim \omega _{y}^{*}$ at
 $R \sim 1.0$. As the velocity ratio decreases, the drag force along the
 $x$- and
 $y$-directions becomes larger than that along the
 $z$-direction, so that the particles are transported out of the jet centre, following the movements of the CVP. For
 $R$ of
 $\sim 3.0$, the particles are initially confined in the CVP regardless of
 $St$, but it takes longer for more particles (with a lower
 $St$) to spread out of the centre plane, owing to the effects of the transverse vortices;
 $St < 1.0\ ({>} 1.0)$ belongs to regime 1 (2) (figure 27b). Although the particles with
 $St \lesssim 1.0$ disperse according to the
 $C$-shaped cluster after the CVP collapses, the particles are preferentially concentrated at the centre plane for
 $St < 1.0$ by the entrained crossflow into the jet centre which contributed to form the CVP, but a number of particles with
 $St \simeq 1.0$ move along the transverse direction. For
 $R \sim 1.0$, owing to the large hairpin vortex, most of the particles gather inside the vortex structure. Contrary to the higher
 $R$ cases, the particles follow the movement of the CVP faithfully for lower
 $St$, and the particles are swept out of the centre plane earlier, so that the case of
 $St > 1.0\ ({<}1.0)$ represents regime 1 (2) (figure 27c). Finally, the particles with
 $St \simeq 1.0$ are dragged toward the leading edge of the CVPs by the vortex structures, regardless of
 $R$. Therefore, the particles are preferentially concentrated at the leading edge of the vortex pairs, but only before the CVP is destroyed (regime 3). In this context, we suggest that particle dispersion behaviour is influenced by the evolution process of the CVP rather than the CVP itself. This agrees with the finding that two
 $R$-classes (
 $R \sim 1$ and
 $3.0$) with different development mechanisms and coherence (strength) of the CVP result in the opposed particle dispersion patterns according to
 $St$. Although the level of coherency of the CVP decreases faster under the partial crossflow, which is a specific condition compared with the interaction with a full crossflow, the CVP development in the near field shares the same mechanism. Smith & Mungal (Reference Smith and Mungal1998) also affirmed that the CVP itself does not enhance the mixing compared with the free jet, since the CVP is in the far-field region. Rather it is the structural formation of the CVP that corresponds to the enhanced mixing in the near field. Thus, we believe that the particle dispersion patterns established in the present study could be applied to other types of flows sharing the configuration of ‘jet in crossflow’, in which the CVP develops.
6. Concluding remarks
In the present study we experimentally investigated particle-laden jets with and without crossflow ( $Re_{D} = 1170\text {--}5200$) while varying the particle Stokes number (
 $St = 0.01\text {--}27.42$) and velocity ratio (
 $R \sim 1.0$ (strong crossflow) –
 $\infty$ (no crossflow)), and focusing on the subsequent changes in the particle dispersion pattern. The jet flow structures and relative particle distribution levels were measured separately, using PIV and PN, respectively. They were analysed together to understand their relations, including an estimation of the drag force distribution. The evolution of the jet flow structure from the jet exit, as represented by the deflected transverse vorticity with a strong CVP, are identified with respect to the velocity ratio. Together with the force variation caused by the vortex evolution (i.e. spatially varying coherency of the CVP) according to
 $R$ and
 $St$, for the first time, we were able to classify three particle dispersion patterns caused by the large-scale vortical interaction. In regime 1 the particles reside quite longer in the jet-centre plane even after the dissipation (lose of coherency) of CVP. In regime 2 the particles are dispersed along the lateral direction before the collapse of the CVP. Finally, in regime 3 the particles are confined in the vortex pairs, and are then transported outward as soon as the CVPs collapse. Because of the specific condition of partial crossflow, the CVP of the present study maintains its coherency in a short range, but the particle dispersion trend in relation to the dynamics of the CVP can be extended to the cases with full crossflow, with which the coherent CVP is retained for a longer distance. For each regime, we further developed empirical particle dispersion models to describe the effect of interactions with the CVP, which are expressed as a power law. The models are based on the standard deviation of concentration p.d.f. along the jet evolution on
 $x$–
 $z$ (jet centre) and
 $x$–
 $y$ (cross-section of CVP) planes, respectively. These models support the particle dispersion regimes, a main contribution of the present study, to supplement the theoretical analysis of particle dispersion mechanisms depending on
 $St$ and
 $R$.
While our results may not be applicable to the movement of individual particles (which is beyond the scope of this study), we believe that it is quite useful for understanding and predicting the long-term migration of particles in an open environment. For example, based on the basic knowledge of particle dispersion by the coherent vortical structures in a complex geometry, it is possible to develop physical models which can be readily used to track and estimate the particle source location. Whether they are fine dust particles in open environments or biological ones like germs or bacteria in confined circumstances, it becomes more critical to track the sources of contamination and estimate the propagations, which can be benefited by the particle dispersion models developed in the present study. In addition, it is of great importance to uncover how other scalar (e.g. temperature and humidity) distributions in the continuous-phase flow would modify the particle dispersion pattern, i.e. as coupled with the material properties (e.g. thermal diffusivity, wettability) and type (metallic, polymer and biological) of the particles. Currently, we are working on these issues as ongoing studies, to expand the present results.
Funding
This work was supported by the Korea Medical Device Development Fund grant (HW20C2103) and National Research Foundation of Korea (NRF) grants (2016R1C1B2012775, 2020R1A2C2014510) funded by the Korea government (MSIT) via SNU-IAMD.
Declaration of interest
The authors report no conflict of interest.



