






1. Introduction
The interaction between fluid flows and porous media has in recent years witnessed a notable increase in attention. This is owing to their wide-ranging practical applications from heat exchangers (Kuruneru et al. Reference Kuruneru, Vafai, Sauret and Gu2020) to nuclear reactors (Hassan & Dominguez-Ontiveros Reference Hassan and Dominguez-Ontiveros2008) as well as their pronounced presence in geophysical flows (Kazemifar et al. Reference Kazemifar, Blois, Aybar, Perez Calleja, Nerenberg, Sinha, Hardy, Best, Sambrook Smith and Christensen2021). They are also interesting from a purely flow physics perspective, particularly with regards to turbulent flows, as their permeable quality can lead to the alteration of turbulence at the interface of porous media (Manes, Poggi & Ridolfi Reference Manes, Poggi and Ridolfi2011). The interactions in this interfacial flow region affect the transport processes occurring between the surface and subsurface flows, motivating the need to better understand them.
Early studies of turbulence over porous media were mainly concerned with the effect that a permeable surface had on the structure of the overlying turbulent flow. This was primarily motivated by the understanding that the effect of wall permeability is distinct from wall roughness, an observation made in the comparative experiments of Zagni & Smith (Reference Zagni and Smith1976) and Manes et al. (Reference Manes, Pokrajac, McEwan and Nikora2009). One of the early numerical efforts pursuing this line of inquiry was that of Breugem, Boersma & Uittenbogaard (Reference Breugem, Boersma and Uittenbogaard2006) who conducted direct numerical simulations (DNS) of turbulent channel flow with a porous substrate on one side. They classified the substrates in terms of their permeability Reynolds number,  $Re_{K} = \sqrt {K}{u_{\tau }}/\nu = \sqrt {K^+}$, and resolved the flow inside the porous region as a continuum using the volume-averaged Navier–Stokes equations to only recover the scales of motion which were larger than the characteristic pore dimensions. Their results demonstrated that for highly permeable cases (
 $\sqrt {K^+}\gg 1$), the canonical streaks and quasistreamwise vortices of near-wall turbulence cease to exist and are replaced by large cross-stream vortical structures. Other observations made were that the logarithmic region of the mean velocity profiles over permeable surfaces differed from that over impenetrable smooth walls, resulting in the von Kármán constant,
 $\kappa$, being different for the porous channels. Additionally, their results also demonstrated an apparent lack of outer-layer similarity. Using the same methodology as Breugem et al. (Reference Breugem, Boersma and Uittenbogaard2006), similar observations were also made in the later work of Kuwata & Suga (Reference Kuwata and Suga2017) who did scale-resolving DNS using the lattice-Boltzmann method. The earlier experimental work of Manes et al. (Reference Manes, Poggi and Ridolfi2011), however, did not report similarly divergent values of
 $\kappa$, with the authors suggesting those reported by Breugem et al. (Reference Breugem, Boersma and Uittenbogaard2006) could be attributable to the lack of inner–outer scale separation, which itself could be a low-Reynolds-number effect. While not the focus of their work, the experimental measurements of Kim et al. (Reference Kim, Blois, Best and Christensen2020) of turbulent flows over packed beds of spheres were consistent with that of Manes et al. (Reference Manes, Poggi and Ridolfi2011) in this regard. In the recent DNS study by Shahzad, Hickel & Modesti (Reference Shahzad, Hickel and Modesti2023) of turbulent flows over perforated plates at
 $Re_{\tau }={500{-}2000}$, all flow cases demonstrated outer-layer similarity and
 $\kappa \approx 0.39$, with the authors also suggesting that the
 $\kappa$ discrepancy in the work of Breugem et al. (Reference Breugem, Boersma and Uittenbogaard2006) being attributable to the low Reynolds number of that study. Recently, Chen & García-Mayoral (Reference Chen and García-Mayoral2023) examined outer-layer similarity of wall-bounded turbulence by doing DNS of turbulent flows over canopies at at
 $Re_{\tau }={550{-}1000}$. They demonstrated that the method for estimating
 $\kappa$ used by Breugem et al. (Reference Breugem, Boersma and Uittenbogaard2006) and Kuwata & Suga (Reference Kuwata and Suga2017) can result in
 $\kappa$ values which are potentially misleading. The method of the latter authors relies upon forcing the linearity of the mean velocity profile in logarithmic coordinates by introducing a suitably large displacement length such that the diagnostic function of the mean velocity exhibits a flat plateau region corresponding to
 $1/\kappa$. Chen & García-Mayoral (Reference Chen and García-Mayoral2023) remark that
 $\kappa$ cannot be meaningfully defined for flows where
 $Re_{\tau }<{300}$ due to the limited range of wall-normal coordinates which prevents a logarithmic region from manifesting. In this low-Reynolds-number range, the diagnostic function by default will not have a plateau region of constant
 $1/\kappa$ which would correspond to a logarithmic region. It is also affected by the wake region above it (Luchini Reference Luchini2018). Thus, Chen & García-Mayoral (Reference Chen and García-Mayoral2023) demonstrate that enforcing the appearance of a plateau without correcting for the wake behaviour could lead to physically misleading values of
 $\kappa$.
Concerning the flow inside porous substrates subject to an overlying turbulent flow, Breugem et al. (Reference Breugem, Boersma and Uittenbogaard2006) observed the presence of velocity fluctuations beneath the surface and considered them to be motions induced by pressure fluctuations. Kuwata & Suga (Reference Kuwata and Suga2017) likewise attributed the subsurface velocity fluctuations to the strong pressure diffusion directed into the substrate and caused by the Kelvin–Helmholtz-like (K–H-like) cross-stream rollers. More recently, Kim et al. (Reference Kim, Blois, Best and Christensen2020) provided direct experimental evidence of amplitude modulation (AM) for turbulence over permeable walls, a possibility that was highlighted by Efstathiou & Luhar (Reference Efstathiou and Luhar2018) based on skewness measurements in turbulent boundary layers over porous foams. This latter aspect will be of significance when examining the flow in the substrate region.
Kuwata & Suga (Reference Kuwata and Suga2017) examined the significance of anisotropy in porous media comprised of cubic pores and having either one ( ${{\mathsf{K}}_y}$), two (
 ${{\mathsf{K}}_y}$,
 ${{\mathsf{K}}_z}$;
 ${{\mathsf{K}}_x}$,
 ${{\mathsf{K}}_y}$) or three (
 ${{\mathsf{K}}_x}$,
 ${{\mathsf{K}}_y}$,
 ${{\mathsf{K}}_z}$) non-zero diagonal components in the permeability tensor. They showed that wall-normal permeability alone did not affect the overlying turbulent flow and the additional presence of streamwise or spanwise permeability is necessary for alterations to occur. This configuration is unlike the DNS of Jiménez et al. (Reference Jiménez, Uhlmann, Pinelli and Kawahara2001), where a permeable-wall boundary condition was used to permit penetration of wall-normal velocity. Likewise, the DNS study by Shahzad et al. (Reference Shahzad, Hickel and Modesti2023) of turbulent flows over perforated plates – porous walls with only non-zero wall-normal permeability – demonstrated that such porous structures can lead to non-smooth-like flow. This seeming contradiction is attributable to the specific geometry used in the
 ${{\mathsf{K}}_y}$-only porous DNS of Kuwata & Suga (Reference Kuwata and Suga2017), which shelters the overlying turbulent flow from any recirculation that would occur in the cavities of the porous structures and causes the flow to simply ‘skim’ over the pores. This limitation does not exist for the boundary condition of Jiménez et al. (Reference Jiménez, Uhlmann, Pinelli and Kawahara2001), which implicitly models the permeable wall as if it were connected underneath to a plenum chamber. Further examination of anisotropic permeability was carried out in the DNS study by Gómez-de Segura & García-Mayoral (Reference Gómez-de Segura and García-Mayoral2019), where the effect of a permeable wall was incorporated using wall boundary conditions derived from the Darcy–Brinkman equation for modelling porous media flows. For highly streamwise-preferential configurations (
 ${{\mathsf{K}}_x}\gg {{\mathsf{K}}_y}$), it was shown that the wall-normal permeability is the principal component responsible for the breakdown of the near-wall streak cycle and the emergence of the cross-stream K–H-like structures observed by Breugem et al. (Reference Breugem, Boersma and Uittenbogaard2006). The threshold marking the onset of this K–H-like regime was estimated to be
 $\sqrt {{{\mathsf{K}}_y}^+}\approx 0.4$, with the flow fully belonging to this regime beyond
 $\sqrt {{{\mathsf{K}}_y}^+}\approx 0.6$. In this regime, drag became degraded compared with smooth-wall turbulence. Reductions in drag, however, were demonstrated for cases where the wall-normal permeability was
 $\sqrt {{{\mathsf{K}}_y}^+}<0.4$.
The purpose of this study is to more closely examine the interaction between porous substrates and turbulent flows, both in the vicinity of the permeable surface and inside the porous substrate. This is investigated numerically using DNS which resolves the scales of motion from the bulk flow down to the pore scale. The substrates examined span both the canonical wall turbulence and K–H-like regimes. This allows for determining which aspects of the flow are mainly due to the change in turbulence and whether there are flow features which persist across both flow regimes, particularly in the substrates. The effect of surface geometry is also investigated.
The structure of the paper is as follows. In § 2, the porous substrate geometries considered and their characteristics along with the numerical methods are introduced. How the overlying bulk turbulence becomes modified due to the presence of substrates and the resulting consequences in terms of drag are discussed in § 3, where an assessment of outer-layer similarity and characterization of the bulk turbulence regime with respect to permeability is also described. In § 4, the surface flow is examined to highlight the differences that exist in terms of flow structure over the substrates falling into different turbulence regimes. The flow in the substrates is examined in § 5. The amplitude modulation of this flow by the overlying turbulence is discussed in § 6. The results are summarized and discussed in § 7.
2. DNS of turbulent flow over porous substrates
2.1. Numerical method
The configuration used in this study is an open-channel as depicted in figure 1. It is comprised of a bulk flow region with height  $\delta$ and a porous substrate region of depth
 $h$. The direct numerical simulations using this set-up were conducted using the open-source solver PARIS simulator (Aniszewski et al. Reference Aniszewski2021) with in-house modifications. The code solves the incompressible Navier–Stokes equations,
 $$\begin{gather} \boldsymbol{\nabla}\boldsymbol{\cdot}{\boldsymbol{u}} = 0, \end{gather}$$
 $$\begin{gather}\frac{\partial \boldsymbol{u}}{ \partial t} + \left(\boldsymbol{u}\boldsymbol{\cdot}\boldsymbol{\nabla}\right){\boldsymbol{u}} =-\frac{1}{\rho}\boldsymbol{\nabla}{p} + \nu{\nabla}^2{\boldsymbol{u}}, \end{gather}$$
where  $\boldsymbol {u} = (u,v,w)$,
 $p$ and
 $\nu$ are the velocity vector, pressure and kinematic viscosity, respectively. The velocity can be decomposed into its mean and fluctuating components through the Reynolds decomposition (Reynolds Reference Reynolds1895)
 \begin{equation} {\boldsymbol{u}(x,y,z,t)=\boldsymbol{U}(y)+\boldsymbol{u^{\prime}}(x,y,z,t), } \end{equation}
where  $\boldsymbol {u}$ is the instantaneous velocity vector,
 $\boldsymbol {U}$ is the time- and plane-averaged mean velocity and
 $\boldsymbol {u^{\prime }}$ is the fluctuating velocity varying over both space and time. Later on in this paper when examining the modulated flow inside the porous substrates, the further decomposition of
 $\boldsymbol {u^{\prime }}$ into a time-steady and time-varying component (Reynolds & Hussain Reference Reynolds and Hussain1972)
 \begin{equation} {\boldsymbol{u^{\prime}}(x,y,z,t)=\boldsymbol{\tilde{u}}(x,y,z)+\boldsymbol{u^{\prime\prime}}(x,y,z,t)} \end{equation}
will also be used.
Sketch of the computational domain.

The dimensions of the computational domain are  $(L_x,L_y,L_z)=(6.3\delta,1.3\delta,3.15\delta )$ in the streamwise (
 $x$), wall-normal (
 $\,y$) and spanwise (
 $z$) directions. The domain is periodic along
 $x$ and
 $z$ while being bounded by a free-slip surface at
 $y=\delta$ and a no-slip wall at
 ${y=-0.3\delta}$. The thickness of the porous substrate is
 $h=0.3\delta$. The simulations were conducted at a constant mass flow rate, which was adjusted to target a nominal
 ${Re_{\tau }={u_{\tau }\,{\delta }}/{\nu }=360}$. Here,
 $u_{\tau }=\sqrt {{\tau _{w}}/{\rho }}$ is the friction velocity at
 $y=0$ (the substrate surface), with
 $\tau _{w}$ obtained from the integral balance
 \begin{equation} {\tau_{w} =-{P_x}\delta,} \end{equation}
where  $P_x$ is the mean pressure gradient. Note that at
 $y=0$, due to presence of a permeable surface
 $\tau _{w}$ will have contributions from both viscous and turbulent stresses,
 \begin{equation} {\tau_{w} = \left.{{\mu}\frac{{\rm d}U}{{\rm d} y}}\right\rvert_{y=0} + {{\rho}{\overline{{u^\prime}{v^\prime}}}}\rvert_{y=0}.} \end{equation}
Throughout this paper, the superscript ‘ $+$’ indicates scaling in inner units, where quantities are normalized using
 $u_{\tau }$ and
 $\nu$. The numerical grid has a resolution of
 $(N_x,N_y,N_z)=(1620, 324, 810)$. The grid spacing is uniform along
 $x$ and
 $z$ while being non-uniform along
 $y$. The grid is stretched in the region above the substrate using a hyperbolic tangent function and uniform within the substrate. The simulation results are grid independent at the chosen resolution. The grid independence was determined by conducting simulations at coarser and finer resolutions. The results of these simulations are gathered in Appendix A.
The equations are spatially discretized on a staggered Cartesian grid using central second-order finite differences. The fractional-step method (Kim & Moin Reference Kim and Moin1985) is used to solve the discretized incompressible Navier–Stokes equations. At each time step an intermediate non-divergence free velocity field is first calculated. The Poisson equation obtained by imposing the incompressibility constraint is then solved using the fast-Fourier-transform-based solver of Costa (Reference Costa2018) to obtain the pressure correction. The pressure correction is then used to project the velocity field onto a divergence free vector space. The time integration uses a triple-substep Runge–Kutta method where both the advective and diffusive terms are treated explicitly.
The immersed boundary method of Breugem & Boersma (Reference Breugem and Boersma2005) is used to numerically realize the porous substrates. Unlike direct-forcing or penalization-based methods, it involves modifying the discretized advective and diffusive flux terms of the Navier–Stokes equations such that the no-slip and no-penetration conditions become exactly imposed for the regions of the numerical domain which are defined as solids. This makes it a more accurate method for realizing geometries which are Cartesian conforming, as demonstrated by Paravento, Pourquie & Boersma (Reference Paravento, Pourquie and Boersma2008).
In addition to the simulations including porous substrates, an open-channel flow over a smooth wall at  $Re_{\tau }=360$ was also simulated to serve as a baseline for comparisons. Quantities normalized using the smooth-wall friction velocity and kinematic viscosity are indicated by the subscript ‘
 $o$’.
2.2. Porous geometries
The porous substrates investigated are lattices where the pores are repeating rectangular cuboids (figure 2). The solid matrix is made of rods with a cross-section of  $d \times d$. The spacings (pitches)
 $s_x$,
 $s_y$ and
 $s_z$ determine the cross-sections of the pores and their resulting void volume. Consistent with previous experimental and numerical studies (Manes et al. Reference Manes, Poggi and Ridolfi2011; Kuwata & Suga Reference Kuwata and Suga2017; Gómez-de Segura & García-Mayoral Reference Gómez-de Segura and García-Mayoral2019), the substrates are characterized in terms of their permeabilities obtained from Darcy's law (Darcy Reference Darcy1856),
 \begin{equation} {\boldsymbol{u}_D} =-\frac{1}{\mu}{{{\boldsymbol{\mathsf{K}}}}}\boldsymbol{\cdot}\boldsymbol{\nabla}{p}, \end{equation}
where  ${\boldsymbol {u}_D}$ is the Darcy velocity vector,
 ${p}$ is the pressure averaged over the fluid phase and
 ${{\boldsymbol{\mathsf{K}}}}$ is the permeability tensor. As such, the law represents the balance between the pressure gradient that drives the flow through a porous medium and the resistance exerted by the medium's solid structure upon the flow. As the Darcy permeabilities are only dependent on the geometry of a substrate, they are suitable parameters for encapsulating the geometrical differences between different porous media. Similar to porous structures studied by Kuwata & Suga (Reference Kuwata and Suga2017), the Cartesian structure of the substrates makes the off-diagonal terms of the permeability tensor zero, giving a tensor with only the three diagonal components
 ${\mathsf{K}}_{xx}$,
 ${\mathsf{K}}_{yy}$ and
 ${\mathsf{K}}_{zz}$, which are written as
 ${\mathsf{K}}_x$,
 ${\mathsf{K}}_y$ and
 ${\mathsf{K}}_z$ for simplicity. These components were computed from the results of Stokes flow simulations conducted using representative element volumes (REVs) of each substrate using the same solver that was used for the turbulent flow simulations. The dimensions of the REVs were
 $(L_x,L_y,L_z)=(0.3\delta,0.3\delta,0.3\delta )$ and the grid resolution similar to the turbulent simulations in terms of grid spacing. The inner-scaled lengths
 $\sqrt {{{\mathsf{K}}_x}^+}$,
 $\sqrt {{{\mathsf{K}}_y}^+}$ and
 $\sqrt {{{\mathsf{K}}_z}^+}$ are used to characterize the porous substrates throughout the paper.
(a) Schematic of general substrate geometry along with (b,c) its nomenclature.

The main cases ( ${\rm HP}1$,
 ${\rm HP}2$,
 ${\rm HP}3$,
 ${\rm MP}$,
 ${\rm LP}1$,
 ${\rm LP}2$,
 ${\rm LP}3$) span a range of wall-normal permeabilities,
 $\sqrt {{{\mathsf{K}}_y}^+}$, to facilitate investigating how near-wall turbulence becomes altered due to a progressively weakening wall-impedance. Here,
 ${\rm HP}$ designates higher permeability substrates
 $(\sqrt {{{\mathsf{K}}_y}^+}>2)$,
 ${\rm LP}$ designates lower permeability substrates
 $\left (\sqrt {{{\mathsf{K}}_y}^+}<1\right )$ and
 ${\rm MP}$ a moderate permeability case falling between the other two groups
 $\Big(1<\sqrt {{{\mathsf{K}}_y}^+}<2\Big)$. Cases
 ${\rm HP}2'$ and
 ${\rm HP}3'$ – where the wall-parallel spacings of
 ${\rm HP}2$ and
 ${\rm HP}3$ have been swapped – retain the wall-normal permeability of
 ${\rm HP}2$ and
 ${\rm HP}3$ but have increased streamwise permeability and hence anisotropy,
 $\varPhi _{xy}={\mathsf{K}}_x/{\mathsf{K}}_y$.
The simulation parameters along with the characteristics of their porous substrates are gathered in table 1. Representative elements for the  ${\rm HP}$ and
 ${\rm LP}$ porous geometries examined are shown in figure 3. The substrates will first be assessed with regards to certain aspects of permeable-wall turbulence which have been reported in the literature. This includes the transition of turbulence from the canonical near-wall regime to the K–H-like regime (Gómez-de Segura & García-Mayoral Reference Gómez-de Segura and García-Mayoral2019) and the resulting drag changes. An important difference exists between pore-scale resolving simulations, and other simulation approaches such as volume-averaged Navier–Stokes simulations (Breugem et al. Reference Breugem, Boersma and Uittenbogaard2006; Rosti, Brandt & Pinelli Reference Rosti, Brandt and Pinelli2018) and permeable-wall boundary conditions (Jiménez et al. Reference Jiménez, Uhlmann, Pinelli and Kawahara2001; Gómez-de Segura & García-Mayoral Reference Gómez-de Segura and García-Mayoral2019). In the latter approaches, the permeability and porosity are predefined numerical parameters and independent from one another.
The DNS cases of open-channel turbulent flow over porous substrates. The porosity for each substrate is given by  $\varphi$. The pore spacings are
 ${s_{x_o}}^+$,
 ${s_{y_o}}^+$ and
 ${s_{z_o}}^+$, while
 ${\sqrt {{{\mathsf{K}}_{x_o}}^+}}$,
 ${\sqrt {{{\mathsf{K}}_{y_o}}^+}}$ and
 ${\sqrt {{{\mathsf{K}}_{z_o}}^+}}$ are the effective permeabilities, which are analogous to the permeability Reynolds number,
 $Re_{K}$. The ratio of streamwise to wall-normal permeability is
 ${\varPhi _{xy}}$. The rod or filament thickness of the solid matrix is
 $d/\delta ={0.039}$ or
 ${d_{o}}^+={14}$ for all cases. Labels, colours and symbols remain consistent throughout the manuscript.

Representative elements of the  ${\rm LP}$ and
 ${\rm HP}$ substrates in table 1. (a)
 ${\rm HP}1$; (b)
 ${\rm HP}2$; (c)
 ${\rm HP}3$; (d)
 ${\rm LP}1$; (e)
 ${\rm LP}2$; ( f)
 ${\rm LP}3$. Cases
 ${\rm HP}2'$ and
 ${\rm HP}3'$ (not shown) are rotated versions of
 ${\rm HP}2$ and
 ${\rm HP}3$ around the
 $y$ axis by
 ${\rm \pi} /2$.

For the cases considered in this work, the substrate's geometry determines both the permeability and the porosity. This imposes constraints on the permeabilities and the degree of anisotropy that can be obtained. For example, a change in  $s_x$ will change the pore cross-section along both
 $y$ and
 $z$, leading to changes in
 ${\mathsf{K}}_y$ and
 ${\mathsf{K}}_z$. The Reynolds numbers of DNS studies are also generally low relative to experiments. As such, achieving effective permeabilities
 $(\sqrt {{{\mathsf{K}}_x}^+}, \sqrt {{{\mathsf{K}}_y}^+}, \sqrt {{{\mathsf{K}}_z}^+})$ which are large (such as those in Manes et al. (Reference Manes, Poggi and Ridolfi2011)) becomes challenging.
3. Overlying turbulent flow
3.1. Surface region flow
The changes in the overlying turbulent flow are first assessed qualitatively by examining the flow field above the permeable surface at  $y^+\approx 5$. Figure 4 shows instantaneous snapshots of the velocity and pressure fluctuations for
 ${\rm HP}1$ and
 ${\rm LP}1$. These two cases have the highest
 $\sqrt {{{\mathsf{K}}_y}^+}$ of the
 ${\rm HP}$ and
 ${\rm LP}$ groups, respectively. This allows for a better assessment of the role wall impedance plays in causing changes in turbulence near the surface. Note that at the surface, the relevant permeability component is
 ${{\mathsf{K}}_y}$ as the flow must first be able to penetrate into the substrate before becoming redirected into the horizontal directions, for which
 ${{\mathsf{K}}_x}$ and
 ${{\mathsf{K}}_z}$ are important.
Instantaneous (a–c) streamwise velocity, (d–f) wall-normal velocity and (g–i) pressure fluctuations at  $y^+\approx 5$: (a,d,g)
 ${\rm HP}1$; (b,e,h)
 ${\rm LP}1$; (c, f,i) smooth-wall. Flow direction is from left to right.

Beginning with observations for the streamwise velocity component,  ${\rm LP}1$ (figure 4b) exhibits regions of elongated positive and negative fluctuations which are similar to the streaky pattern observed over a smooth-wall (figure 4c). This streamwise coherency is diminished in
 ${\rm HP}1$ (figure 4a), where the aforementioned regions are instead more clump-like and also exhibit a degree of regularity along the spanwise dimension of the domain. This is indicative of the near-wall turbulence becoming altered. For the wall-normal velocity component, the similarity between
 ${\rm LP}1$ (figure 4e) and the smooth-wall (figure 4f) is reflective of the similarity seen in their streamwise velocity fields. Case
 ${\rm LP}1$ has a greater degree of intensity but remains structurally similar to its smooth-wall counterpart;
 ${\rm HP}1$ (figure 4d), however, shows not only a noticeably stronger intensity in wall-normal velocity fluctuations but also structural differences, with there seemingly being an emergent spanwise coherency. The differences in the pressure fields are consistent with the observations made for the velocity fields. Case
 ${\rm HP}1$ (figure 4g) demonstrates a spanwise patch along
 $x^+\approx 1200$ which is coincident with the spanwise coherent regions seen at the same position in its
 $u$ and
 $v$ fields. The pressure fluctuations of
 ${\rm HP}1$ are also more intense compared with
 ${\rm LP}1$ (figure 4h) and the smooth-wall case (figure 4i). Another distinctive quality of
 ${\rm HP}1$ is the visible signature of the permeable surface in its flow field, particularly when examining the wall-normal velocity (figure 4d). This indicates that the surface granularity becomes perceived by the turbulent flow, such that it leaves a visible footprint in the flow field. This is similar to what has been observed in flows over roughness (Abderrahaman-Elena, Fairhall & García-Mayoral Reference Abderrahaman-Elena, Fairhall and García-Mayoral2019) and canopies (Sharma & García-Mayoral Reference Sharma and García-Mayoral2020).
3.2. Changes in mean flow, velocity fluctuations and Reynolds shear stress
Surfaces which depart from a hydrodynamically smooth behaviour change the overall level of momentum carried by the bulk flow, i.e. the amount of drag generated at the surface changes. As explained by Spalart & McLean (Reference Spalart and McLean2011) and Chung et al. (Reference Chung, Hutchins, Schultz and Flack2021), a suitable metric for quantifying this is the shift in the logarithmic region of the mean velocity profile,  $\Delta {U^+}$, which was introduced by Hama (Reference Hama1954) and Clauser (Reference Clauser1954) and is more commonly known as the roughness function. As such,
 $\Delta {U^+}$ accounts for the mean momentum deficit of the flow relative to smooth-wall flow. For the porous substrates, this is examined in figure 5(a,b), showing the mean velocity profiles,
 ${U^+}(y^+)$, and the velocity difference,
 $\Delta {U^+}(y^+) = {U^+}(y^+)_{{porous}} - {U^+}(y^+)_{{smooth}}$, respectively. All of the porous substrates examined increase drag compared with the baseline smooth-wall case (
 $\Delta {U^+}<0$), although the
 ${\rm LP}$ cases do not impose a significant drag penalty. The structural differences observed in the flow over the different substrates are also reflected here, such that they become distinguishable into two overall groups. The substrates with lower wall-normal permeability (
 ${\rm LP}1$,
 ${\rm LP}2$,
 ${\rm LP}3$,
 ${\rm MP}$) do not deviate greatly from the smooth-wall (
 $\Delta {U^+}>-1$) and the
 ${\rm LP}$ cases are almost indistinguishable from the smooth-wall case. The substrates with higher wall-normal permeability (
 ${\rm HP}1$,
 ${\rm HP}2$,
 ${\rm HP}2'$,
 ${\rm HP}3$,
 ${\rm HP}3'$) on the other hand result in
 $\Delta {U^+}$ values which are notable (
 $\Delta {U^+}\lessapprox -2$). The same distinction can be made for the Reynolds shear stress (figure 6), where substrates
 ${\rm LP}1$,
 ${\rm LP}2$,
 ${\rm LP}3$ and
 ${\rm MP}$ result in slightly greater levels of turbulent activity close to the permeable surface whereas this activity is more pronounced for the
 ${\rm HP}$ substrates with a gap emerging between the former and the latter substrates in terms of their surface-level
 $-\overline {u^{\prime }v^{\prime }}^+$ activity.
(a) Mean velocity profiles of the bulk flow region above the porous substrates. (b) Difference in porous-wall and smooth-wall velocities. Symbols and colours follow the descriptions in table 1. The black line in (a) is a reference smooth-wall solution at  $Re_{\tau }=360$.

Reynolds shear-stress profiles of the bulk flow region above the porous substrates. The black line is a reference smooth-wall solution at  $Re_{\tau }=360$.

Following the approach of MacDonald et al. (Reference MacDonald, Chan, Chung, Hutchins and Ooi2016) and García-Mayoral, Gómez-de Segura & Fairhall (Reference García-Mayoral, Gómez-de Segura and Fairhall2019), to assess the contributing factors to  $\Delta {U^+}$, the mean momentum equation for the bulk flow region above the substrate is considered
 \begin{equation} {\nu\frac{{\rm d}U}{{\rm d} y}}-\overline{u'v'} = {{u^2_{\tau}}}\left (1 - \frac{y}{\delta}\right ). \end{equation}
Scaling (3.1) in inner units gives
 \begin{equation} {\frac{{\rm d}U^+}{{{\rm d}y}^+}}-{\overline{u'v'}}^{\,+} = 1 - \frac{y^+}{\delta^+}. \end{equation}
Integrating (3.2) between  $y^+=0$ (the substrate surface) and a position far above the substrate where the flow statistics are smooth-wall-like,
 $y^+=H^+$, results in
 \begin{equation} \int_{y^+= 0}^{y^+= H^+} -{\overline{u'v'}}^{\,+} \,{{\rm d} y}^++ {U^+}\left(y^+=H^+\right)- {U^+}\left(y^+=0\right) = H^+- \frac{{H^+}^2}{2\delta^+}. \end{equation}
For a smooth-wall flow, there will be no mean velocity at  $y^+=0$ (no-slip) and hence
 ${U^+}(y^+=0)={U^+}_{{slip}}=0$. Taking the difference of (3.3) between a porous case and the smooth-wall case allows for quantifying the contributions of the interfacial slip velocity and changes in Reynolds stress to
 $\Delta {U^+}$,
 \begin{align} \Delta{U^+} &=
{U^+}\left(y^+=H^+\right)_{{porous}} -
{U^+}\left(y^+=H^+\right)_{{smooth}}\nonumber\\
& = U^+_{{slip}} - \int_{y^+= 0}^{y^+= H^+}
\left[\left(-{\overline{u'v'}}^{\,+}_{{porous}}\right) -
\left(-{\overline{u'v'}}^{\,+}_{{smooth}}\right)\right]\,{{\rm
d} y}^+\nonumber\\
&\quad - \frac{{H^+}^2}{2}\left(\frac{1}{{\delta^+}_{{porous}}} -
\frac{1}{{\delta^+}_{{smooth}}}\right)\nonumber\\
&= \Delta{U^+_{{slip}}} + \Delta{U^+_{uv}} + \Delta{U^+_{Re}}
\approx \Delta{U^+_{{slip}}} + \Delta{U^+_{uv}}.
\end{align}
The term  $\Delta {U^+_{Re}}$ quantifies the contributions from additional turbulence scales and emerges due to the differences in
 $Re_{\tau }$, i.e.
 ${\delta ^+}_{{porous}}$ and
 ${\delta ^+}_{{smooth}}$. However, it remained negligible for the simulations conducted here and is therefore omitted. Note that differences in
 $Re_{\tau }$ would also result in non-zero
 $\Delta {U^+_{Re}}$ between smooth-wall flows and that this component is not due to the wall having a non-smooth characteristic.
The decomposition of (3.4) was applied to the different substrate cases by setting  $H^+=200$, which measures
 $\Delta {U^+}$ inside the region where it has achieved a flat value (figure 5b). Table 2 lists the corresponding
 $\Delta U^+$ values for each configuration. The contributions obtained from (3.4) are shown in figure 7. There, it can be observed that the slip velocity contribution,
 $\Delta {U^+_{{slip}}}$, to
 $\Delta {U^+}$ does not vary significantly across the different cases. The Reynolds shear stress contribution,
 $\Delta {U^+_{uv}}$, is drag degrading and hence always negative. The magnitude of
 $\Delta {U^+_{uv}}$ decreases monotonically from
 ${\rm HP}1$, which has the overall highest permeability, to the
 ${\rm LP}$ cases which are similar in terms of
 $\Delta {U^+}$. The dominant component across all cases is
 $\Delta {U^+_{uv}}$ and grows larger for substrates with greater wall-normal permeabilities. It is notably larger in magnitude than
 $\Delta {U^+_{{slip}}}$ for the
 ${\rm HP}$ cases. These results are consistent with what was observed for the profiles of the mean velocity (figure 5a) and Reynolds shear stress (figure 6). A jump in
 $\Delta {U^+_{uv}}$ is also seen here when going from the
 ${\rm LP}$ cases to the
 ${\rm HP}$ cases, suggestive of additional contributions resulting from the structural changes in turbulence that were observed in figure 4. The same trend holds for
 ${\rm HP}2'$ and
 ${\rm HP}3'$ which have weak streamwise-preferential anisotropy unlike their baseline counterparts
 ${\rm HP}2$ and
 ${\rm HP}3$. However, their increased anisotropy leads to increased drag. In the
 ${\rm LP}$ cases on the other hand, as the anisotropy increases from
 ${\rm LP}3$ to
 ${\rm LP}1$ the drag becomes reduced, although the changes are small. Overall, none of the substrates allow for the development of any significant slip velocity at their surfaces. Therefore, the differences in
 $\Delta {U^+}$ are primarily due to the differences in
 $-\overline {u^{\prime }v^{\prime }}^+$ close to the permeable surface.
The von Kármán constant,  $\kappa$, and virtual origin (or zero-plane displacement height),
 $\epsilon$, resulting from the fitting of the log-law (3.5) to the mean velocity profiles of the different cases in table 1. The values of
 $\Delta {U^+}$ for each case are also reported. The last two columns report the root mean square (r.m.s.) error and goodness of fit, respectively.

The slip velocity,  $\Delta {U^+_{{slip}}}$, and Reynolds shear stress,
 $\Delta {U^+_{uv}}$, contributions to
 $\Delta {U^+}$.

The DNS of Gómez-de Segura & García-Mayoral (Reference Gómez-de Segura and García-Mayoral2019) where permeable-wall boundary conditions were used to effectively model anisotropic porous substrates suggested that streamwise-preferential configurations can result in drag reduction when turbulence is smooth-wall-like. Unfortunately, the mostly isotropic configurations of the substrates considered here do not permit investigating whether this applies to them. An earlier effort by the authors of this paper (Habibi Khorasani, Luhar & Bagheri Reference Habibi Khorasani, Luhar and Bagheri2022a) was directed towards this. The substrates used then were streamwise-preferential but still did not demonstrate drag reduction for those belonging to the smooth-wall-like turbulence regime. However, the flow in the porous region was weakly resolved due to the insufficient resolution of the simulations. A definitive conclusion could therefore not be made about drag reduction being achievable or not.
3.3. Logarithmic law and outer-layer similarity
Throughout the literature, assessments have been made about the applicability of the log-law, expressed as
 \begin{equation} {{U^+} = \frac{1}{\kappa}{\ln\left( y^+ \right)} + B,} \end{equation}
to non-smooth-wall flows. If the mean velocity of a non-smooth flow demonstrates a logarithmic scaling similar to a smooth-wall flow, the von Kármán constant,  $\kappa$, should also be similar to the smooth-wall value. This similarity then also serves as an indicator that the two flows are outer-layer similar. When examining the log-law for non-smooth flows, a modified form of it,
 \begin{equation} {{U^+} = \frac{1}{\kappa}\,{\ln\left( y^+- \epsilon^+ \right)} + A + \Delta{U^+},} \end{equation}
is used instead. Here,  $A$ is the log-law intercept for a smooth-wall profile and
 $\Delta {U^+}$ is the previously introduced mean velocity shift. Here
 $\epsilon ^+$ is the zero-plane displacement height or virtual origin and accounts for the differences in the origin of the logarithmic region. It therefore sets the location of the wall-normal coordinate origin, i.e.
 $y^+ = -\epsilon ^+$. Different approaches have been used for determining
 $\epsilon ^+$. The method introduced by Jackson (Reference Jackson1981) for rough-wall flows, where the virtual origin is associated with the centre of the drag forces acting on the rough wall, is a popular one. However, MacDonald et al. (Reference MacDonald, Ooi, García-Mayoral, Hutchins and Chung2018) showed that a more suitable choice for
 $\epsilon ^+$ is the location at which the Reynolds shear stress,
 $\overline {u'v'}$, decays to zero. This definition of the virtual origin has also been used by Ibrahim et al. (Reference Ibrahim, Gómez-de-Segura, Chung and García-Mayoral2021) in their framework of quantifying drag changes for smooth-wall-like turbulence, where it accurately accounts for the turbulent contribution to drag. Using the same approach, for the porous substrates considered here, virtual origins are obtained that do not exceed a few wall units (
 ${\epsilon ^+}<5$). The values of
 $\epsilon ^+$ are gathered in table 2. Comparing these values with the permeabilities of table 1, it is clear that the virtual origin is of the order of the permeabilities, with values close to
 $\sqrt {{\mathsf{K}}_z^+}$. For permeable-walls which retain smooth-wall-like turbulence,
 $\epsilon$ has been shown to relate to the spanwise slip caused by the permeable substrate (Gómez-de Segura & García-Mayoral Reference Gómez-de Segura and García-Mayoral2019), and the slip itself was shown by Abderrahaman-Elena & García-Mayoral (Reference Abderrahaman-Elena and García-Mayoral2017) to relate to
 $\sqrt {{{\mathsf{K}}_z}^+}$ through analytical solutions of the Brinkman equation. However, it should be emphasized that this is only applicable to the viscous-dominated smooth-wall-like regime of drag change established in Luchini, Manzo & Pozzi (Reference Luchini, Manzo and Pozzi1991) and Luchini (Reference Luchini1996). Additionally, the presence of tangential permeability is not necessary for slip to occur. This is evident from the DNS of Shahzad et al. (Reference Shahzad, Hickel and Modesti2023), who also reported
 ${\epsilon ^+}<5$ but for acoustic liners where
 $\sqrt {{{\mathsf{K}}_x}^+}=\sqrt {{{\mathsf{K}}_z}^+}=0$.
After determining  $\epsilon ^+$, the values of
 $\kappa$ were obtained by fitting (3.6) to the mean velocity profiles of each case. These values are gathered in table 2.
 $\kappa \approx 0.39$ across all cases which is the value commonly reported for smooth-wall turbulence. Similar to the virtual origins, this result also mirrors that of Shahzad et al. (Reference Shahzad, Hickel and Modesti2023). For the reasons described earlier in § 1, the approach of Breugem et al. (Reference Breugem, Boersma and Uittenbogaard2006) has not been adopted to determine
 $\epsilon ^+$ and
 $\kappa$. The Reynolds number for the flows examined here is too low for the diagnostic function,
 $y^+\, {\rm d}U^+/{{\rm d} y}^+$, to be reliably used. It should also be reiterated that the flow configuration used here is an open channel, whereas those of Breugem et al. (Reference Breugem, Boersma and Uittenbogaard2006) and Kuwata & Suga (Reference Kuwata and Suga2017) were asymmetric confined channels. This undermines any direct comparisons. Regarding the
 $\kappa$ values obtained in prior work and the choice of method to do so, the interested reader is referred to the work of Chen & García-Mayoral (Reference Chen and García-Mayoral2023) which directly deals with subjects of log-law analysis and outer-layer similarity in obstructed flows. The recent work of Luchini (Reference Luchini2024) may also provide insight regarding log-laws in general.
Setting aside log-law behaviour, the similarity hypothesis of Townsend (Reference Townsend1976) requires that the inner-scaled turbulent fluctuations be similar away from the wall. In figure 8, the r.m.s. velocity fluctuations (figure 8b) and Reynolds shear stress (figure 8a) distributions in outer-scaled wall-coordinates are similar beyond  $y/\delta \approx 0.25$. This reflects figure 5(b), where
 $\Delta U^+$ became flat beyond
 $y^+/Re_{\tau } \approx 0.25$. Therefore, the effect of the porous substrates does not extend far into the overlying flow, reinforcing the existence of outer-layer similarity.
(a) Reynolds shear stress and (b) r.m.s. velocity fluctuations above the substrates in outer-scaled wall coordinates.

3.4. Flow regime distinction based on permeability
The separation of the substrates into two groups becomes more clearly distinguishable when plotting the drag change,  $\Delta {U^+}$, against the square root of the wall-normal permeability (figure 9a). The leap in
 $\Delta {U^+}$ when going from the
 ${\rm LP}$ to the
 ${\rm HP}$ cases has been attributed to the near-wall turbulence dynamics undergoing a transition and departing the canonical regime for a K–H-like one (Gómez-de Segura & García-Mayoral Reference Gómez-de Segura and García-Mayoral2019). Using linear stability analysis with boundary conditions derived from the Darcy–Brinkman equation, Gómez-de Segura, Sharma & García-Mayoral (Reference Gómez-de Segura, Sharma and García-Mayoral2018) proposed the following relation for quantifying the influence of a substrate's permeability on triggering this transition:
 \begin{equation} {{\mathsf{K}}_{Br_{1}}}^+= {{{\mathsf{K}}_{y}}^+}\tanh\left( \frac{\sqrt{2 {{\mathsf{K}}_x}^+}}{9} \right)\tanh^2\left( \frac{h^+}{\sqrt{12{{\mathsf{K}}_y}^+}} \right) \approx {{{\mathsf{K}}_{y}}^+}\tanh\left( \frac{\sqrt{2 {{\mathsf{K}}_x}^+}}{9} \right). \end{equation}
For sufficiently deep substrates, the second hyperbolic tangent term becomes  $\approx 1$ and the relation becomes simplified, with the dominant term becoming
 ${{{\mathsf{K}}_{y}}^+}$. Gómez-de Segura & García-Mayoral (Reference Gómez-de Segura and García-Mayoral2019) determined
 $\sqrt{{\mathsf{K}}_{Br_1}^+}\approx {0.4 - 0.6}$ as the threshold in which the onset and transition to the K–H-like regime occurs. The results of applying (3.7) to the DNS data in this work is shown in figure 9(c). It indicates that case
 ${\rm MP}$ and beyond should belong to the fully developed K–H-like regime, since
 $\sqrt {{\mathsf{K}}_{Br_1}^+}\approx {0.68}$ for
 ${\rm MP}$. Cases
 ${\rm HP}2'$ and
 ${\rm HP}3'$, which differ in terms of their
 ${\varPhi _{xy}}$ anisotropy from the other
 ${\rm HP}$ cases (figure 9b), also conform to (3.7). However, as will be shown later in § 3.5 through spectral analysis, case
 ${\rm MP}$ does not fall into the fully developed K–H-like regime, but does show evidence of the onset of the regime. It should be noted that (3.7) was originally obtained for conditions where
 $\sqrt {{{\mathsf{K}}_x}^+} > \sqrt {{{\mathsf{K}}_y}^+}$, i.e. streamwise-preferential substrates, therefore it may not be suitable for the substrates under consideration here. For conditions where
 $\sqrt {{{\mathsf{K}}_x}^+} < \sqrt {{{\mathsf{K}}_y}^+}$, Sharma et al. (Reference Sharma, Gomez-de Segura and Garcia-Mayoral2017) demonstrated that linear stability analysis leads to different results, described using
 \begin{equation} {{\mathsf{K}}_{Br_{2}}}^+= \sqrt{{{\mathsf{K}}_{x}}^+{{\mathsf{K}}_{y}}^+}\tanh\left( \frac{h^+}{18} \sqrt{\frac{{{\mathsf{K}}_x}^+}{{{\mathsf{K}}_y}^+}} \right)\tanh^2\left( \frac{h^+}{\sqrt{{{\mathsf{K}}_x}^+}} \right) \approx \sqrt{{{\mathsf{K}}_{x}}^+{{\mathsf{K}}_{y}}^+}, \end{equation}
where the hyperbolic tangent terms again become  $\approx 1$. The results from applying (3.8) to the simulation data of the cases in table 1 are shown in figure 9(d). They are similar to those in figure 9(c) obtained using (3.7). Anisotropy becomes reflected more prominently when characterizing the substrates using (3.8), as
 ${\rm HP}2'$ and
 ${\rm HP}3'$ become more separated from
 ${\rm HP}2$ and
 ${\rm HP}3$ in figure 9(d) compared with figure 9(c). Sharma et al. (Reference Sharma, Gomez-de Segura and Garcia-Mayoral2017) reported that for
 $\sqrt {{{\mathsf{K}}_{Br_2}}^+}>{2}$ the K–H-like instability becomes fully developed. For
 ${\rm HP}3$,
 $\sqrt {{{\mathsf{K}}_{Br_2}}^+}\approx {2.2}$, and in § 3.5 it will be shown through spectral analysis that the
 ${\rm HP}$ cases belong to the K–H-like regime. As such, the instability criteria of Gómez-de Segura et al. (Reference Gómez-de Segura, Sharma and García-Mayoral2018) and Sharma et al. (Reference Sharma, Gomez-de Segura and Garcia-Mayoral2017) are good predictors of when the turbulence dynamics over porous structures cease to be canonical. The first-order influence of
 ${{\mathsf{K}}_y}^+$ becomes evident when taking into account that the weakening of the wall-blocking effect at the surface is directly tied to this permeability component. Once permeability at the surface is present to a sufficiently large degree to permit the penetration of momentum into the substrate, the fluid moving below the surface must then contend with the horizontal blockage imposed by the substrate which is characterized by
 ${{\mathsf{K}}_x}^+$ and
 ${{\mathsf{K}}_z}^+$, giving these permeability components second-order significance. The two criteria of (3.7) and (3.8) will probably exhibit more distinguishable results from one another for substrates with higher anisotropy, whereas here they give results which are mostly similar to one another.
Mean velocity shift plotted against (a) wall-normal permeability, (b) the streamwise to wall-normal anisotropy ratio, (c) effective permeability of (3.7) and (d) effective permeability of (3.8). Here  ${\square }$, blue,
 ${\rm LP}1$;
 ${\Diamond }$, blue,
 ${\rm LP}2$; ☆, blue,
 ${\rm LP}3$;
 ${\bigcirc }$, purple,
 ${\rm MP}$;
 ${\Diamond }$, red,
 ${\rm HP}3$; ☆, red,
 ${\rm HP}2$;
 ${\bigcirc }$, red,
 ${\rm HP}1$;
 ${\Diamond }$, blue,
 ${\rm HP}3'$; ☆, green,
 ${\rm HP}2'$. The vertical lines mark the thresholds beyond which the cases are expected to fall into the fully developed K–H-like regime according to Gómez-de Segura & García-Mayoral (Reference Gómez-de Segura and García-Mayoral2019) and Sharma, Gomez-de Segura & Garcia-Mayoral (Reference Sharma, Gomez-de Segura and Garcia-Mayoral2017).

Earlier in the introduction, it was mentioned that the predominance of  ${{\mathsf{K}}_y}^+$ may seem to contradict the results of Kuwata & Suga (Reference Kuwata and Suga2017) for their porous structure which only had the
 ${{\mathsf{K}}_y}^+$ permeability component but differed little from smooth-wall turbulence. This can be made more confusing when one considers the earlier work of Jiménez et al. (Reference Jiménez, Uhlmann, Pinelli and Kawahara2001), where a permeability boundary condition was used to allow for wall transpiration and the resulting flows became K–H-like. For the case of Kuwata & Suga (Reference Kuwata and Suga2017), the lack of any wall-parallel permeability prevents flow from recirculating within the substrate. This has the effect of inhibiting wall transpiration since there is no room for the fluid to achieve recirculation underneath. This restriction does not exist for the boundary condition used by Jiménez et al. (Reference Jiménez, Uhlmann, Pinelli and Kawahara2001), which implicitly assumes that the permeable wall has a plenum chamber underneath it. This is also the reason why the acoustic liners of Shahzad et al. (Reference Shahzad, Hickel and Modesti2023) demonstrate non-smooth-wall behaviour, despite only having
 ${{\mathsf{K}}_y}^+$. The liners consist of arrays of cavities with a perforated lid on top of them. Each cavity has multiple orifices with diameters larger than 80 in wall units over it, making the cavity volume relatively large. Each cavity in effect then behaves as a plenum chamber where the fluid can recirculate.
3.5. Turbulence structure
In figure 6, it was shown that the  ${\rm HP}$ cases are distinguished by higher Reynolds shear stresses in the region close to the permeable surface. Quadrant analysis of the velocity fluctuations can be leveraged to examine the change in turbulence intensities with respect to flow events, in particular the contribution from ejections (
 ${\rm Q}2$,
 $u'<0$ and
 $v'>0$) and sweeps (
 ${\rm Q}4$,
 $u'>0$ and
 $v'<0$). This is shown for the
 $y^+\approx 5$ plane above the surface in figure 10. Going from an impenetrable smooth-wall (figure 10a) to the permeable case of
 ${\rm LP}1$ (figure 10b) and finally the greater permeable case of
 ${\rm HP}1$ (figure 10c), a tilting and expansion of the joint probability distributions of
 $u'$ and
 $v'$ is observed. As explained by Manes et al. (Reference Manes, Poggi and Ridolfi2011), the tilting is attributable to an increase in
 ${v'}$ activity, which is also evident when viewing the r.m.s. velocity fluctuations in figure 11, particularly when going from the
 ${\rm LP}$ to the
 ${\rm HP}$ cases. In terms of flow events, sweeps become increasingly dominant as the permeability increases, in both strength and number of occurrences, contributing to a greater generation of Reynolds shear stress in the near-surface region. Structurally, the rounder distribution for the
 ${\rm HP}1$ is also indicative of turbulence growing less anisotropic (Suga, Mori & Kaneda Reference Suga, Mori and Kaneda2011). These features are common to flows over permeable surfaces, be they canopies (Finnigan, Shaw & Patton Reference Finnigan, Shaw and Patton2009) or porous media (Manes et al. Reference Manes, Poggi and Ridolfi2011).
Quadrant maps of  $u^{\prime }$ and
 $v^{\prime }$ at
 $y^+\approx 5$: (a) smooth-wall, (b)
 ${\rm LP}1$, (c)
 ${\rm HP}1$. The dashed lines are hyperbolas marking
 $|{{u'}^+}{{v'}^+}|=8\times {-\overline {u'v'}^{+}}$. The colour bar indicates the frequency of events in each bin of the map.

Distributions of the r.m.s. velocity fluctuations for the bulk turbulent flow overlying the porous substrates.

The experiments of Manes et al. (Reference Manes, Poggi and Ridolfi2011) also showed the distribution of points initially growing and then subsequently shrinking when going from their lowest permeability to their highest permeability case (refer to figure 15 of their manuscript). They attributed this behaviour to the near-surface flow mechanism changing to a mixing-layer type for the highest permeability porous media they investigated, similar to what occurs for turbulence over canopies (Finnigan Reference Finnigan2000). The highest permeability examined by Manes et al. (Reference Manes, Poggi and Ridolfi2011), for which they observed mixing-layer behaviour, was  $\sqrt {K^+}\approx 17$ at
 $Re_{\tau }\approx 3848$. This is considerably greater than the highest effective wall-normal permeability investigated here
 $(\sqrt {{{\mathsf{K}}_y}^+}\approx 3.4)$, suggesting that the cases in this study do not fall into the category of mixing-layer type behaviour.
The differences in turbulence structure become better established by examining the spectral energy densities of the velocity fluctuations. The spectra of cases  ${\rm HP}1$ and
 ${\rm LP}1$ in figure 12 are different from one another, with
 ${\rm HP}1$ exhibiting energetic scales at large spanwise wavelengths which are absent in
 ${\rm LP}1$. For case
 ${\rm MP}$, the onset of the instability can be inferred from the emergence of energetic scales at large
 $\lambda _z^+$, but it is not yet intensified. This spanwise coherent component is attributable to the existence of spanwise rollers associated with a K–H-like instability over permeable boundaries (Gómez-de Segura & García-Mayoral Reference Gómez-de Segura and García-Mayoral2019). A visualization of the vortical structures appearing in the
 ${\rm HP}$ cases is shown in figure 13. Additionally, by using spectral proper orthogonal decomposition (SPOD), modes are obtained for
 ${\rm HP}1$ which capture the spanwise coherent rollers but for
 ${\rm LP}1$, and indeed all of the
 ${\rm LP}$ cases, no such modes are obtained. These SPOD modes for
 ${\rm HP}1$ may be viewed in Appendix B, but have been omitted from the main text for brevity. The emergence of these K–H-like structures is the cause behind the intensification of turbulent activity in the proximity of the substrate surface and drag increase.
Premultiplied two-dimensional spectral energy densities: (a,e,i)  $k_x k_z E_{uu}$; (b, f,j)
 $k_x k_z E_{vv}$; (c,g,k)
 $k_x k_z E_{ww}$; (d,h,l)
 $k_x k_z E_{uv}$ at
 $y^+\approx 5$. Here (a–d)
 ${\rm HP}1$; (e–h)
 ${\rm MP}$; (i–l)
 ${\rm LP}1$.

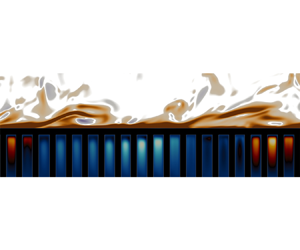
Vortex visualization using the  $Q$-criterion above substrate
 ${\rm HP}1$ in an
 $x$–
 $y$ slice through the simulation domain. Vortex cores (light colour) are regions of
 $Q>0$ (high vorticity) and surrounded by a sheet (dark colour) of
 $Q<0$ (high shear). The hot and cold regions below the surface represent positive and negative wall-normal velocity fluctuations, respectively. Flow direction is from left to right.

Recalling the drag decomposition in figure 7, it was observed that increased streamwise-preferential anisotropy had a drag reducing effect in the  ${\rm LP}$ cases, albeit a small one. As it is clear now that these cases belong to the smooth-wall-like turbulence regime, this makes the trend observed for drag change in line with the results of Gómez-de Segura & García-Mayoral (Reference Gómez-de Segura and García-Mayoral2019). In the smooth-wall-like regime, the changes in drag are due to the ‘virtual-origin’ effect (Luchini et al. Reference Luchini, Manzo and Pozzi1991; Jiménez Reference Jiménez1994; Luchini Reference Luchini1996; García-Mayoral et al. Reference García-Mayoral, Gómez-de Segura and Fairhall2019; Ibrahim et al. Reference Ibrahim, Gómez-de-Segura, Chung and García-Mayoral2021; Habibi Khorasani et al. Reference Habibi Khorasani, Lcis, Pasche, Rosti and Bagheri2022b), where the Reynolds shear stress generating quasistreamwise vortices can become displaced farther away from the surface where a slip velocity is present, resulting in a net drag reduction. This linear mechanism of passive drag reduction is only achievable so long as the flow surrounding the surface remains quasilaminar (Luchini Reference Luchini2015) and becomes negated beyond it. Owing to their smooth-wall-like quality, the drag components of
 ${\rm LP}1$,
 ${\rm LP}2$ and
 ${\rm LP}3$ are likely quantifiable in terms of virtual origins using the approach of Ibrahim et al. (Reference Ibrahim, Gómez-de-Segura, Chung and García-Mayoral2021), but this has not been carried out here.
4. Surface flow
The focus is now placed on the permeable surface of the substrates at  $y^+=0$, which is the region directly in contact with the overlying turbulent flow. Figure 14 shows the velocity and pressure fluctuations at
 $y^+=0$; the differences that were observed in the flow fields of
 ${\rm HP}1$ and
 ${\rm LP}1$ above the surface (figure 4) are also reflected here. It can be observed from figure 14(a) that
 ${\rm HP}1$ lacks the streaky patterns of
 ${\rm LP}1$, shown in figure 14(b), but has more intense activity. The imprint of the surface geometry is also more clearly visible in the flow field of
 ${\rm HP}1$. For the wall-normal velocity, spanwise coherent patterns are observable for
 ${\rm HP}1$ (figure 14c) whereas such coherency is not discernible for
 ${\rm LP}1$ (figure 14d).
Instantaneous fluctuations of (a,b) streamwise velocity, (c,d) wall-normal velocity and(e, f) pressure at  $y^+=0$. Here (a,c,e)
 ${\rm HP}1$; (b,d, f)
 ${\rm LP}1$. Flow direction is from left to right. The white regions represent the solid rods of the substrate.

The spectral energy densities at the surface level in figure 15 reveal the signature of the K–H-like structures (indicated with the red lines) observed in figure 12 for  ${\rm HP}1$. For
 ${\rm LP}1$, no such signature is visible and overall far less flow activity occurs at the permeable surface. Additionally, the spectra show energetic regions at wavelengths equal to the horizontal substrate spacings
 ${s_x}^+$ and
 ${s_z}^+$ (indicated using the green lines) along with their subharmonic wavelengths. These regions represent the pore-coherent flow which is modulated by the ambient turbulence, as similarly occurs over rough surfaces (Abderrahaman-Elena et al. Reference Abderrahaman-Elena, Fairhall and García-Mayoral2019). The pore-coherent flow component forming along the spanwise direction repeats periodically along the streamwise direction in intervals of
 ${{\lambda _x}^+} = {s_x}^+$. This flow component is modulated by the ambient turbulence and becomes amplified over a broad range of spanwise wavelengths as can be seen in figure 15(a,b) for the
 $u$ and
 $v$ spectra of
 ${\rm HP}1$. A similar effect takes place for the pore-coherent flow component forming along the streamwise direction. While the pore-coherent flow does exist for
 ${\rm LP}1$, it is significantly weaker compared with
 ${\rm HP}1$. Regarding the
 ${\rm HP}2'$ and
 ${\rm HP}3'$ cases, some delicate differences can be observed compared with
 ${\rm HP}2$ and
 ${\rm HP}3$, but the assessment of them is not done here and is instead gathered in Appendix C for the interested reader.
Premultiplied two-dimensional spectral densities: (a,e)  $k_x k_z E_{uu}$; (b, f)
 $k_x k_z E_{vv}$; (c,g)
 $k_x k_z E_{ww}$; (d,h)
 $k_x k_z E_{uv}$ at
 $y^+=0$. Here (a–d)
 ${\rm HP}1$; (e–h)
 ${\rm LP}1$. The
 ${\mathrm {red}}$ lines demarcate
 ${200}\lesssim {{\lambda _{x}}^+}\lesssim {800}$ and
 ${200}\lesssim {{\lambda _{z}}^+}$. The
 ${\mathrm {green}}$ lines enclose the signature of the pore-coherent flow which are coincident with
 ${\lambda _{x}}^+={s_{x}}^+$ and
 ${\lambda _{z}}^+={s_{z}}^+$.

Ultimately, the modulated pore-coherent flow (areas enclosed by green lines in the spectra of figure 15) and its subharmonics for the  ${\rm HP}$ cases are seemingly attributable to the energetically coherent ambient turbulent scales, particularly those associated with the K–H-like structures. This would explain why the
 ${\rm LP}$ cases, despite having streamwise and spanwise pitches of comparable size to those of the
 ${\rm HP}$ cases, do not exhibit similarly strong pore-coherent flows. Broadband excitation of any flow component induced by the geometry of the porous substrate is contingent upon the existence of broadband energetic turbulent scales. The observations made here have important implications for the subsurface flow since the pore-coherent flow, which undergoes modulation by the ambient turbulence, factors into the scale-selection that takes place at the surface and therefore the scales of motion that occur inside the substrates.
5. Subsurface flow
Thus far, the effects due to the presence of a porous substrate have been examined for the overlying flow. Attention is now given to the subsurface flow that develops inside the substrates.
5.1. Mean flow, fluctuating velocities and Reynolds shear stress
First, the mean velocity along with the fluctuations of the different velocity components are examined. Figure 16 demonstrates that the mean flow develops a region of negative shear beneath the surface. This negative shear is induced by the overlying K–H-like structures (Endrikat et al. Reference Endrikat, Modesti, García-Mayoral, Hutchins and Chung2021). As such, it is notable for the  ${\rm HP}$ cases, while a very weak mean flow develops inside the substrates for the
 ${\rm LP}$ cases. Within the region of negative shear, the mean flow undergoes flow reversal. Larger wall-normal pore spacings cause this region to become extended and the position at which the flow undergoes reversal corresponds to the bottom of the first pore layer, i.e.
 $y^+\approx -{s_y}^+$. The exponential decay exhibits similarity across the different
 ${\rm HP}$ cases, but requires both a large enough wall-normal pore spacing and K–H-like flow to develop at the surface since the
 ${\rm LP}$ cases do not exhibit such a quality.
Mean velocity profiles inside the substrates for the cases of table 1.

The Reynolds shear stress undergoes a sign reversal for the  ${\rm HP}$ cases which the
 ${\rm LP}$ cases do not (figure 17). As the first pore layer becomes deeper, this reversal region becomes extended. Overall, however,
 $-\overline {u^{\prime }v^{\prime }}^+$ is weak below the surface. Cases
 ${\rm HP}2^{\prime }$ and
 ${\rm HP}3^{\prime }$ exhibit the same pattern as the other
 ${\rm HP}$ cases.
Reynolds shear stress profiles inside the substrates for the cases of table 1.

For the velocity fluctuations (figure 18), all of them gradually decay towards the floor of the porous substrates where they become forcibly dampened due to the no-slip condition. However, both  $u^{\prime }$ and
 $w^{\prime }$ undergo dampening at the bottom of each pore layer as evident by their oscillatory patterns, whereas
 $v^{\prime }$ largely demonstrates a monotonic decay. Considering the downward path from a surface pore-opening; the wall-normal flow entering an opening will not come across any barriers along the way towards the substrate floor since it moves through what is essentially a narrow duct. For wall-parallel flow, however, at the bottom of each pore layer the interconnected rods of the substrate's geometry will impede any in-plane motion. The overall magnitude of the spanwise velocity fluctuations is less than those of the streamwise and wall-normal velocity fluctuations, which follows from the spanwise velocity also being the least energetic velocity component at the surface of the substrates. Note that the magnitude of
 $v^{\prime }$ entering the substrate remains the same as it is above-surface, while the magnitudes of both
 $u^{\prime }$ and
 $w^{\prime }$ become strongly diminished. This relates to what was said earlier about
 $v^{\prime }$ facing less impediment as it moves through the substrate. The dense layer of solid at the substrate top strongly impedes wall-parallel motion as it penetrates into the substrate compared with wall-normal motion. Here
 ${\rm HP}2^{\prime }$ and
 ${\rm HP}3^{\prime }$ have stronger streamwise fluctuations compared with
 ${\rm HP}2$ and
 ${\rm HP}3$. This can primarily be attributed to their larger
 ${\mathsf{K}}_x^+$, resulting in less impedance of streamwise momentum, but may also be attributable to the stronger turbulence at the surface (figures 6 and 11), resulting in a greater modulation of the subsurface flow, an aspect which will be examined in § 6.
Streamwise (a), wall-normal (b) and spanwise (c) r.m.s. velocity fluctuations within the porous substrates.

Some of the observations made here have been similarly reported for turbulent flows over engineered dense canopies (Sharma & García-Mayoral Reference Sharma and García-Mayoral2020), such as the gradual decay of the wall-normal fluctuations. Periodic dampening of the fluctuations were not reported for the canopy flows, but this is attributable to the porous substrates having layers of interconnected solid elements whereas canopy posts are isolated from one another and do not place similar restrictions on in-plane fluid motion. Similar dampening patterns were observed in the DNS of Kuwata & Suga (Reference Kuwata and Suga2017) and the experiments of Suga, Okazaki & Kuwata (Reference Suga, Okazaki and Kuwata2020).
5.2. Flow structure and features
The surface flow was described in § 4 and bearing in mind the observations made there the subsurface flow is now examined by assessing the instantaneous fluctuations within the first pore layer at  $y^+\approx -15$ in figure 19. The flow fields of both
 ${\rm HP}2$ and
 ${\rm HP}3$ show spanwise elongated patterns in both their streamwise and wall-normal velocity fluctuations (figure 19a,e,b, f). The pressure fluctuations of both
 ${\rm HP}2$ (figure 19i) and
 ${\rm HP}3$ (figure 19j) reflect the patterns of their streamwise and wall-normal velocity fluctuations. Kuwata & Suga (Reference Kuwata and Suga2016) attributed the velocity fluctuations occurring within the porous substrate to the pressure fluctuations caused by the K–H-like flow at the surface. The observations made here seem to agree with this, as the turbulence in the near-surface region of both
 ${\rm HP}2$ and
 ${\rm HP}3$ falls into the K–H-like regime. The flow field of
 ${\rm HP}3^{\prime }$ (figure 19d,h,l) is similar to
 ${\rm HP}3$ (figure 19b, f,j) with no discernible differences existing between them. The flow field of
 ${\rm HP}2^{\prime }$ in figure 19(c,g,k) shows a stronger spanwise coherency than
 ${\rm HP}2$ in figure 19(a,e,i) (this greater coherency can also be observed in the flow field at
 $y^+=0$ in figure 32, and is attributed to the stronger K–H-like scales visible in the spectra of figure 33).
Instantaneous fluctuations of (a–d) streamwise velocity, (e–h) wall-normal velocity and (i–l) pressure at  $y^+\approx -15$: (a,e,i)
 ${\rm HP}2$; (b, f,j)
 ${\rm HP}3$; (c,g,k)
 ${\rm HP}2^{\prime }$; (d,h,l)
 ${\rm HP}3^{\prime }$. Flow direction is from left to right. The white regions are due to the presence of the porous substrate's rods.

More details are revealed by examining the spectra of the fluctuations within the first pore layer at  $y^+=-15$, shown in figure 20. The spectra of
 ${\rm HP}2$ and
 ${\rm HP}3$ (figures 20a–d and 20e–h) show that almost no ambient turbulence scales penetrate into the substrate. Only the pore-coherent flow remains energetically discernible, as seen by its spectral signature enclosed by the green lines of figure 20. The pore-coherent flow is also diminished compared with the surface region (figure 33), but not as strongly as the ambient turbulence.
Premultiplied spectral densities: (a,e,i,m)  $k_x k_z E_{uu}$; (b, f,j,n)
 $k_x k_z E_{vv}$; (c,g,k,o)
 $k_x k_z E_{ww}$; (d,h,l,p)
 $k_x k_z E_{uv}$ at
 $y^+\approx -15$. Here (a–d)
 ${\rm HP}2$; (e–h)
 ${\rm HP}3$; (i–l)
 ${\rm HP}2^{\prime }$; (m–p)
 ${\rm HP}3^{\prime }$. Note the differences in the overall magnitude of the contours for the different cases. The
 ${\mathrm {green}}$ lines enclose the most energetically significant parts of the pore-coherent flow and the
 ${\mathrm {red}}$ lines those of the K–H-like rollers.

For  ${\rm HP}2^{\prime }$, its stronger K–H-like scales at the surface level lead to the survival of those scales down to this depth within the substrate (the regions enclosed by the red lines in figure 20i,j,l), although they are quite weak. Despite having the same wall-normal permeability as
 ${\rm HP}2$, the streamwise favourable anisotropy of
 ${\rm HP}2'$ leads to stronger turbulent scales at the surface which are then able to penetrate deeper into the substrate.
Owing to the fact that turbulence does not survive this deep into the porous substrates for  ${\rm HP}2$,
 ${\rm HP}3$,
 ${\rm HP}2'$ and
 ${\rm HP}3'$, the coherent patterns observed in their flow fields (figure 19) must be attributed to the pore-coherent flow which remains detectable at this depth. The broadband spanwise intensification of the pore-coherent flow, however, is imparted to it from the surface level turbulence which possess spanwise coherent energetic scales. The modulation persists throughout the substrate and hence why the spectra in figure 20 show long patches of spanwise energetic scales, particularly for the wall-normal velocity.
Ultimately, for the porous substrates under consideration here, there exists a notable pore-coherent flow component below the surface, and in some cases weak scales of ambient turbulence related to the K–H-like instability. Similarly, in flows over canopies the fluctuations below the canopy tip-plane are attributed to the strong overlying cross-flow rollers that develop due to the existence of a perturbed mixing layer (Sharma & García-Mayoral Reference Sharma and García-Mayoral2020). As mentioned previously in § 3.5, for a mixing layer to emerge over porous media, very high effective surface permeability (or permeability Reynolds number) is required (Jiménez et al. Reference Jiménez, Uhlmann, Pinelli and Kawahara2001; Manes et al. Reference Manes, Poggi and Ridolfi2011). Outside of this mixing layer regime, the notable flow activity below the surface mainly resides in the pore-coherent scales of the flow which undergo modulation by the turbulence at substrate's surface. Manes et al. (Reference Manes, Poggi and Ridolfi2011) examined whether the resulting eddy structures over their porous foams shared the same characteristics as those reported over canopies and which are associated with an inflectional instability of the mean velocity (White & Nepf Reference White and Nepf2007). They observed this to not be the case for low to intermediate ranges of permeability. This also applies to the porous substrates examined in this paper and the analysis done to quantify this is gathered in Appendix B.
Before proceeding further, as a final examination to see whether the flow structure inside the substrates undergoes any notable change deeper inside the substrate, the instantaneous fluctuations as well as the spectra at  $y^+\approx -55$ for case
 ${\rm HP}1$ alone are shown in figure 21. One can witness that the patterns are overall similar to those observed at
 $y^+\approx -15$ for the rest of the
 ${\rm HP}$ cases, with the most notable scales of motion again being those of the pore-coherent flow, while a weak footprint of the K–H-like scales are also present. The existence of the latter at this depth is of course attributable to the stronger overlying K–H-like structures of
 ${\rm HP}1$. In addition,
 ${\rm HP}1$ also lacks interconnected rod layers inside the substrate which would impede downward directed flow. The explanation for the spanwise coherence of the flow field is similar to what was previously described for the flow at the shallower depth of
 $y^+\approx -15$. The spectral signature of the pore-coherent flow which encompasses a range of streamwise scales is repeated along the spanwise direction at intervals equal to the spanwise spacing (
 ${\lambda _z}^+={s_z}^+$), i.e. between two consecutive pores along this direction. In essence, the patches are collections of narrow fingers of streamwise velocity which are confined to the pores due to a microchannelization effect. These flow elements appear as a spanwise coherent region macroscopically due to being modulated in amplitude, which is what will be examined next.
Instantaneous velocity fluctuations and premultiplied spectral energy densities of case  ${\rm HP}1$ at
 $y^+\approx -55$: (a) streamwise fluctuations, (b) wall-normal fluctuations, (c) pressure fluctuations; (d)
 $k_x k_z E_{uu}$, (e)
 $k_x k_z E_{vv}$, ( f)
 $k_x k_z E_{ww}$ and (g)
 $k_x k_z E_{uv}$. The
 ${\mathrm {green}}$ lines enclose the most energetically significant parts of the pore-coherent flow and the
 ${\mathrm {red}}$ lines the surviving turbulence belonging to the K–H-like scales.

6. Surface-flow induced AM of subsurface flow
The pore-coherent flow is subject to AM by the scales of the overlying ambient turbulence, evidence of which was provided in the experimental investigation of Kim et al. (Reference Kim, Blois, Best and Christensen2020). This phenomenon will now be examined for the substrates considered in this study.
The presence of a solid structure introduces spatial inhomogeneities to the flow field. This gives rise to a dispersive velocity field,  $\boldsymbol {\tilde {u}}$, as defined in (2.3). Amplitude modulation, however, is a dynamic effect that is not reflected in the time-averaged dispersive velocity field. The fluctuating velocity along with its different components from (2.2) and (2.3) are shown in figure 22 for case
 ${\rm HP}1$. The dispersive velocity field is weak and does not have irregularities, but as is evident in the spectra of figure 21(d), the pore-coherent flow which resides in
 ${\boldsymbol {u^{\prime \prime }}}$ has a different spatial pattern.


Abderrahaman-Elena et al. (Reference Abderrahaman-Elena, Fairhall and García-Mayoral2019) conducted a Fourier analysis of the flow within the roughness sublayer of rough-wall turbulence and proposed an algebraic model for decomposing the velocity signals into its background and roughness-coherent (the rough-wall analogue of the pore-flow) components. Their decomposition accounts for the cross-interaction of the velocities across the different flow components and the modulations that arise as a result of them. As such, the model can be used to decompose the velocities even in the event that some degree of scale overlap between the background and roughness-coherent flow exists. When scale-separation between the two flow components exist, the model functions similar to regular Fourier filtering. Since for the porous substrates examined here the wavelengths of the pore-coherent flow and those of the ambient turbulence do not significantly overlap, regular Fourier filtering has been employed to separate the flow components and quantify AM. This is demonstrated in figure 23, where the high-frequency (low-wavelength) amplitude-modulated signal of the pore-coherent flow has been removed from the streamwise velocity signal at the surface ( $\,y^+ = 0$) using low-pass filtering. This recovers the low-frequency (long-wavelength) signal of the ambient turbulence. There does not seem to be a discernible AM effect above the surface at
 $y^+\approx 5$, as the pore-flow component (the undulations of the black line) does not undergo notable changes in amplitude. The AM effect is similarly demonstrated for the wall-normal velocity in figure 23. Note that this AM phenomenon is different from AM observed in canonical turbulent flows between the inner and outer flow regions (Mathis, Hutchins & Marusic Reference Mathis, Hutchins and Marusic2009). That effect is due to the existence of large-scale structures within the log-layer which emerge when the Reynolds number becomes sufficiently large (
 $Re_{\tau }>1700$).
Raw ( $-\!-$) and low-pass filtered (
 $-\;-$, red) spanwise-averaged velocity signals of case
 ${\rm HP}1$: (a) streamwise velocity fluctuations at both
 $y^+\approx 5$ and
 $y^+=0$, (b) streamwise velocity fluctuations at
 $y^+\approx 5$ and wall-normal velocity fluctuations at
 $y^+=0$. The solid to faded lines represent three successive time signals.

The approach undertaken here to quantify AM follows that of Mathis et al. (Reference Mathis, Hutchins and Marusic2009), where the correlation between the low-pass filtered (large-scale) streamwise velocity fluctuations,  ${u^{\prime }}_L$, and the long-wavelength envelope of the high-pass filtered (small-scale) velocity fluctuations,
 ${E_L}(\boldsymbol {{u^{\prime }}_s})$, taken at two different fixed
 $y$ positions (
 $\,y_1$ for the
 ${u^{\prime }}_L$ and
 $y_2$ for
 ${u^{\prime }}_s$) quantifies the degree of AM (note that
 $\boldsymbol {{u^{\prime }}_s}$ can be any of the velocity components)
 $$\begin{gather} R_{\boldsymbol{u}}(\,{y_1}, {y_2}) = \frac{\overline{{u^{\prime}}_L\;{E_L}({\boldsymbol{u^{\prime}}_s})}}{\sqrt{\overline{{u^{\prime}_L}^2}}\sqrt{\overline{{{E_L}({\boldsymbol{u^{\prime}}_s})}^2}}}. \end{gather}$$
In (6.1),  ${E}$ denotes the envelope of a signal and is acquired using the Hilbert transform. The Hilbert transform of a real-valued function,
 $f(t)$, produces another real-valued function,
 $\tilde {f}(t)$. Together,
 $f(t)$ and
 $\tilde {f}(t)$ form a harmonic conjugate pair and define the complex analytic signal of
 $f(t)$,
 $$\begin{gather} F(t) = f(t) + i\tilde{f}(t) = E(t) e^{i\phi(t)}. \end{gather}$$
This provides the instantaneous envelope,  $E(t)$, and phase,
 $\phi (t)$, allowing for the demodulation of the original modulated signal,
 $f(t)$. More details regarding the Hilbert transform may be found in Mathis et al. (Reference Mathis, Hutchins and Marusic2009) and the references contained therein. Other approaches can also be used to the assess modulation effects, such as wavelet analysis used by Baars et al. (Reference Baars, Talluru, Hutchins and Marusic2015) to quantify AM and frequency modulation effects. The Hilbert-based approach, however, remains robust. The long-wavelength envelope of small-scale velocity,
 ${E_L}(\boldsymbol {{u^{\prime }}_s})$, obtained after taking the Hilbert transform of the velocity time-signal, is then high-pass filtered to keep only the modulated small-scale velocity signal. Unlike in experimental measurements, the velocity signals here are not single-point measurements. Instead, spanwise-averaged one-dimensional velocity signals at different
 $y^+$ planes are used to first obtain instantaneous correlations and then followed by ensemble-averaging over all temporal samples to obtain a single correlation coefficient.
Figure 24(a) shows how the small-scale wall-normal velocity fluctuations at the permeable surface are modulated in amplitude by the large-scale streamwise velocity fluctuations of the ambient turbulence above it. The envelope of  ${v^{\prime }}_s$ rises and falls along with the variations in the amplitude of
 ${u^{\prime }}_L$. The high degree of correlation becomes clearer when considering figure 24(b), where the envelope of
 ${v^{\prime }}_s$ is phase-shifted by
 ${\rm \pi}$, making it overlap to a significant extent with the signal of
 ${u^{\prime }}_L$. This also demonstrates that events of
 $u$ and
 $v$ are almost always in antiphase with respect to one another close to the surface. Such a modulation effect is not observed between
 ${u^{\prime }}_L$ and
 ${w^{\prime }}_s$ in figure 25. This does not, however, mean that a modulation of
 $w$ does not take place, as all three velocity components cross-interact with and modulate one another (Abderrahaman-Elena et al. Reference Abderrahaman-Elena, Fairhall and García-Mayoral2019). It only suggests that a modulating effect exclusively directed from
 $u$ to
 $w$ does not seem to be occurring in this instance.
Amplitude modulation of  $v$ by
 $u$. Panel (a) shows large-scale streamwise velocity fluctuations (
 $-\!-$) at
 $y^+\approx +5$ and the long-wavelength envelope of small-scale wall-normal velocity fluctuations (
 $-\!-$, red) at
 $y^+=0$ of case
 ${\rm HP}2$; panel (b) shows the same, only with the envelope (
 $-\,-$, red) now phase-shifted by
 ${\rm \pi}$.

Lack of AM of  $w$ by
 $u$. The plots are similar to those in figure 24, but with the envelope of the spanwise velocity instead of the wall-normal velocity.

The instantaneous frequencies of the velocities can be calculated from their analytic signals obtained using the Hilbert transform. These can then be used to calculate the instantaneous phase-difference between the streamwise and wall-normal velocities. A probability density histogram of instantaneous phase differences is shown in figure 26(b) for case  ${\rm HP}1$, demonstrating that
 $u^{\prime }$ and
 $v^{\prime }$ are predominately in antiphase. The probability density histogram for the AM correlation coefficient (6.1) is shown in figure 26(a) and demonstrates the persistent presence of AM between the
 $u^{\prime }$ and
 $v^{\prime }$ as they evolve in time while the same is not observed between
 $u^{\prime }$ and
 $w^{\prime }$ in figure 26(d,c).
Probability density histograms of AM correlation between (a)  ${{u^{\prime }}_L}^+$ and
 ${E_L}({{v^{\prime }}_s}^+)$, and (c)
 ${{u^{\prime }}_L}^+$ and
 ${E_L}({{w^{\prime }}_s}^+)$. Instantaneous phase differences between (b)
 ${{u^{\prime }}_L}^+$ and
 ${{v^{\prime }}_L}^+$, (d)
 ${{u^{\prime }}_L}^+$ and
 ${{w^{\prime }}_L}^+$ for case
 ${\rm HP}2$. The
 $u^{\prime }$ signal was taken at
 $y^+\approx 5$ while the
 $v^{\prime }$ and
 $w^{\prime }$ were taken at
 $y^+=0$.

Examination of the flow inside the substrates (figures 21 and 22) demonstrated that AM is present within them. As such, it is of interest to see how deep the effect persists and also how its strength differs between the various substrates. Figure 27 displays the AM effect on the wall-normal velocity at different depths for the substrates of table 1. The AM remains quite strong halfway down into the substrates for the  ${\rm HP}$ cases. It is much weaker overall for the
 ${\rm LP}$ cases, highlighting how the energetic surface level dynamics of the
 ${\rm HP}$ cases which fall into the K–H-like regime enhances this effect.
Degree of AM of the wall-normal velocity. Light to darker shades correspond to  $y^+\approx -5$,
 $y^+\approx -50$ and
 $y^+\approx -110$, respectively.

7. Summary and conclusions
Direct numerical simulations of turbulent flows in an open channel geometry where the wall-side of the channel is covered by a porous substrate have been carried out in this work. Anisotropic porous substrates with permeability components of different values were first assessed in how they cause changes in the overlying turbulent flow. When the wall-impedance condition becomes weakened, near-wall turbulence undergoes a transition away from its canonical structure – characterized by the presence of streaks and quasistreamwise vortices – to one where spanwise coherent structures reminiscent of the K–H instability emerge.
The primary permeability component of significance in determining wall-impedance is  ${\mathsf{K}}_y$. An analysis using the
 ${\mathsf{K}}_{Br}$ permeability criteria of Sharma et al. (Reference Sharma, Gomez-de Segura and Garcia-Mayoral2017) and Gómez-de Segura et al. (Reference Gómez-de Segura, Sharma and García-Mayoral2018) for predicting when turbulence transitions to a K–H-like regime remains robust for the DNS data in this study. The
 ${\mathsf{K}}_{Br}$ condition was obtained using linear stability analysis of permeable wall boundary conditions derived using the Darcy–Brinkman equation but remain applicable to the pore-scale resolved DNS data in this study, indicating that the microstructure details of the porous substrates do not have a leading-order impact on the instability. This agrees with the argument made by White & Nepf (Reference White and Nepf2007), who assessed that only the overall resistance of the porous layer is important and not the details of its geometry in bringing about and sustaining the instability.
Past results in the literature using continuum-based approaches of representing a porous region or using permeable wall boundary conditions have suggested that a reduction in drag is perhaps attainable for certain combinations of permeability, particularly for streamwise preferential anisotropy (Gómez-de Segura & García-Mayoral Reference Gómez-de Segura and García-Mayoral2019). However, none of the porous substrates examined here resulted in drag reduction (figure 5a). Drag reduction in a passive manner can be obtained if a surface can simultaneously weaken viscous dissipation while impeding turbulent mixing from taking place close to its vicinity, an effect which is quantified in the ‘virtual-origin’ framework (Luchini Reference Luchini1996; Ibrahim et al. Reference Ibrahim, Gómez-de-Segura, Chung and García-Mayoral2021). The weakening of viscous dissipation is typically quantified in terms of a slip velocity, which is negligible for the porous substrates tested in this study. Turbulent activity, however, increases in the vicinity of the surface such that the net effect becomes one of drag increase (figure 7). Streamwise-preferential anisotropy does not lead to a drag reducing effect, which can only occur in the canonical smooth-wall-like regime of near-wall turbulence, and which only the  ${\rm LP}$ cases belong to. They do, however, exhibit a trend of drag decrease with increased streamwise-preferential anisotropy. Ultimately, drag reduction using porous media must be assessed in terms of the slip-velocity (or slip-length) they can cause at the surface.
At the surface of the porous media, spectral analysis reveals the existence of flow signatures conforming to the geometry of the surface and with amplified levels of energy (figure 15). Inside the porous substrates, the surviving turbulence scales become rapidly dampened and the flow component which significant energy-wise is the pore-coherent flow figure 20. The structure of the pore-coherent flow is geometry dependent, which makes the microstructure of the porous medium, particularly at the surface, an important aspect of its design.
The aforementioned pore-coherent flow undergoes significant AM by the ambient turbulent motion present near the surface of the porous media. This AM effect extends deep into the porous media, perturbing its flow and becoming a principal means of inducing flow activity inside it. Stronger ambient turbulence at the surface strengthens this effect, such that it becomes more pronounced for the cases which fall into the K–H-like regime (figure 26). This is because the K–H-like structures lead to greater momentum exchange between the surface and subsurface flow. These flow features are conceptually illustrated in figure 28, where going from left to right indicates an increase in  ${\mathsf{K}}_{y}^+$ and ultimately
 ${{\mathsf{K}}_{Br}}^+$.
Conceptual sketch showing the evolution of turbulence over porous substrates. The lower limit  ${\sqrt {{{\mathsf{K}}_x}^+{{\mathsf{K}}_y}^+}<5}$ is based on (3.8) and the threshold shown in figure 9(d). The upper limit
 ${15<\sqrt {{{\mathsf{K}}_x}^+{{\mathsf{K}}_y}^+}}$ is inferred from the results of Manes et al. (Reference Manes, Poggi and Ridolfi2011) in conjunction with (3.8).

Knowledge of the regimes illustrated in figure 28 and the scale interaction which occurs between the porous media and turbulent flow can be leveraged in applications involving heat and mass transfer. Unlike flow momentum, heat transfer stands to benefit from more intense turbulent activity in the vicinity of the porous medium, as this will lead to greater thermal convection. To what degree this can be exploited, is one example of an interesting line of inquiry that can be pursued in relation to turbulence and porous media.
Acknowledgements
The authors express their gratitude to the reviewers for providing many useful critiques of the paper during its review process. The numerical simulations in this work were conducted using the computational resources of PDC Center for High Performance Computing, KTH Royal Institute of Technology, and the National Supercomputer Centre (NSC), Linköping University. Access to the resources of these supercomputing centres was granted by the Swedish National Infrastructure for Computing (SNIC) through project 2022/1-38.
Funding
This work was supported through grant SSF-FFL15-0001 from the Swedish Foundation for Strategic Research (SSF) and by the Air Force Office of Scientific Research (AFOSR) through grant A9550-19-1-7027 (programme managers Dr G. Abate and Dr D. Smith).
Declaration of interests
The authors report no conflict of interest.
Appendix A. Grid resolution assessment
While the resolution requirements for regular channel flow simulations are well-established throughout the literature (Kim & Moin Reference Kim and Moin1985; Lee & Moser Reference Lee and Moser2015), problems involving fluid–solid interactions need to be assessed on a case-by-case basis. The baseline grid has a resolution of  $(N_x,N_y,N_z)=(1620, 324, 810)$. This grid more than suffices for resolving the bulk flow region, but it must be determined whether or not the wall-parallel resolution is sufficient for resolving the solid phase of the porous substrates. With this baseline configuration, the number of wall-parallel grid-points per substrate rod thickness becomes
 $d/\Delta _{x,z}=10$. This was chosen based on the grid study results of Sharma & García-Mayoral (Reference Sharma and García-Mayoral2020) which was conducted for turbulent flows over canopies. They showed that such a concentration of points per canopy element was enough to resolve them and their induced flow. Nevertheless, to ensure that this resolution is sufficient, a grid study for case
 ${\rm HP}1$ was carried out using both a coarser and refined grid. The refined grid had a resolution of
 $(N_x,N_y,N_z)=(3240, 324, 1620)$ giving
 $d/\Delta _{x,z}=20$ while the coarser grid of
 $(N_x,N_y,N_z)=(810, 324, 405)$ gave
 $d/\Delta _{x,z}=5$. The wall-normal grid is kept the same, which is stretched in the bulk flow region and achieves a constant spacing at
 $y\approx 0.0042$ (
 $\,y^+\approx 15$) resulting in
 $d/\Delta _{y}=25$. Case
 ${\rm HP}1$ is chosen since it is has some the strongest flow activity in the substrate region and serves as an appropriate candidate for grid resolution assessment of the
 ${\rm HP}$ cases. The
 ${\rm LP}$ cases are close to the smooth-wall limit and have very little flow penetrating into the substrate, hence a separate grid resolution assessment for them would be redundant.
From figure 29, it is clear that the baseline grid with  $d/\Delta _{x,z}=10$ resolves the flow in both the bulk and substrate regions well with the results being grid independent at this resolution. For the coarse grid with
 $d/\Delta _{x,z}=5$, the discrepancy is highest immediately below the surface for the r.m.s. wall-normal velocity fluctuations where the error is
 ${\approx }7\,\%$. The sufficiency of the baseline grid resolution is further reinforced by the results in table 3, where the calculated Darcy permeabilities for the porous substrates using the baseline and refined grid resolutions is reported. No appreciable improvement in the permeability estimates was achieved by increasing the number of grid points per rod from
 $d/\Delta _{x,z}=10$ to
 $d/\Delta _{x,z}=20$.
(a,d) Mean velocity, (b,e) r.m.s. velocity fluctuations and (c, f) Reynolds shear stress of the(a–c) bulk flow and (d–f) substrate regions for  ${\rm HP}1$. The solid lines represent the results from using
 $d/\Delta _{x,z}=20$, the symbols
 ${-}$
 ${\square }$
 ${-}$,
 $d/\Delta _{x,z}=10$; and
 $\cdots $
 ${\Diamond }$
 $\cdots $,
 $d/\Delta _{x,z}=5$.

Darcy permeability estimates for the substrates of table 1 using Stokes flow simulations of REVs (such as those shown in figure 3). The permeabilities with the subscript  $HR$ have a grid resolution of
 $d/\Delta _{x,z}=20$ and those without
 $d/\Delta _{x,z}=10$. The last three columns list the differences in the permeabilities obtained using the two resolutions.

Appendix B. Assessment of whether or not the K–H-like structures are similar to those of mixing-layer type flows
In the experiments of turbulent flows over porous metal foams conducted by Manes et al. (Reference Manes, Poggi and Ridolfi2011), they examined whether the resulting turbulent flow at the permeable surface of the media were similar to those reported by White & Nepf (Reference White and Nepf2007) for sparse porous arrays of cylinders serving as models for vegetation canopies. White & Nepf (Reference White and Nepf2007) demonstrated that the coherent motion at the top of the arrays exhibited a single dominant frequency which was the same as that in free shear layers subject to K–H instability. They therefore characterized the flows as being similar to mixing layers where the instability originates at the inflection point of the mean velocity profile inside the porous region. Manes et al. (Reference Manes, Poggi and Ridolfi2011) performed a similar frequency analysis, but observed that only for their highest permeability case did the frequency approach the value associated with mixing-layer type flows. They concluded that for low to moderate permeabilities, the coherent turbulent motion in the vicinity of the permeable surface is not due to the inflectional instability of the mean velocity profile. In a recent DNS study by Wang et al. (Reference Wang, Lozano-Durán, Helmig and Chu2022) where transfer entropy was used to measure causal interactions between porous media and turbulent flows, the frequencies at which these interaction took place over the various porous media were in agreement with the results of Manes et al. (Reference Manes, Poggi and Ridolfi2011).
The dominant frequency reported by White & Nepf (Reference White and Nepf2007) was  $f = 0.032\bar {U}/\theta$, where
 $\theta = \int _{-\infty }^{\infty } (1/4 + (U-\bar {U}/\Delta {U})^2)\,{{\rm d}y}$;
 $\Delta {U} = U_{y=\delta } - U_{P}$;
 $\bar {U}=(U_{y=\delta } + U_{P})/2$ and
 $U_{P}$ is the velocity deep inside the porous medium. The frequencies reported by Manes et al. (Reference Manes, Poggi and Ridolfi2011) for their porous media (
 $1.9\leq {\sqrt {{K}^+}}\leq 8.4$) were much higher than
 $0.032$ and only the case of
 ${\sqrt {{K}^+}} = 17.2$ had a frequency close to
 $f = 0.032\bar {U}/\theta$.
A similar frequency characterization was performed for  ${\rm HP}1$ which has the highest wall-normal permeability
 ${\sqrt {{{\mathsf{K}}_y}^+}} = 3.4$ out of all the cases in table 1. First, SPOD (Towne, Schmidt & Colonius Reference Towne, Schmidt and Colonius2018) is applied to the surface flow of
 ${\rm HP}1$. Examination of the SPOD eigenvalues in figure 30 reveals a peak in the leading SPOD mode at
 $f = 0.22\bar {U}/\theta$ for both the streamwise and wall-normal velocity components. This is close to
 $f\approx 0.22\bar {U}/\theta$ reported by Manes et al. (Reference Manes, Poggi and Ridolfi2011) for their metal foam which had a permeability of
 ${\sqrt {{K}^+}} = 3.2$. Observing the first SPOD mode for both the streamwise and wall-normal velocity in figure 31 reveals recurrent spanwise-elongated patterns. Such patterns are not recovered in the SPOD modes for any of the
 ${\rm LP}$ cases (not shown). This further demonstrates the regime distinction that was described in §§ 3.4 and 3.5. So it can be concluded that for the porous substrates of table 1, the mixing-layer analogy does not hold, in agreement with the conclusion made by Manes et al. (Reference Manes, Poggi and Ridolfi2011).
The SPOD eigenvalues of the (a) streamwise and (b) wall-normal velocity fluctuations at the surface ( $\,y^+=0$) of
 ${\rm HP}1$. The peak in the leading SPOD mode at
 $f = 0.22\bar {U}/\theta$ is circled in red. The shading of the curves varies from dark to bright as the mode number increases.

First SPOD mode at  $f = 0.22\bar {U}/\theta$ of the (a) streamwise and (b) wall-normal velocity fluctuations at the surface (
 $\,y^+=0$) of
 ${\rm HP}1$.

Appendix C. Comparison of surface flow features between  ${\rm HP}2, {\rm HP}3$ and ${\rm HP}2', {\rm HP}3'$


Thus far, it has been shown that the flow structure close to the surface of the substrates are quite different between the  ${\rm LP}$ and
 ${\rm HP}$ cases. The
 ${\rm LP}$ cases are essentially smooth-wall-like and permit very little turbulent activity from taking place in the proximity of the surface and hence do not motivate further examination. The question now posed is how significant is the pore-coherent flow – determined by wavelengths of the porous medium – relative to the existence of the K–H-like structures. For this purpose,
 ${\rm HP}2'$ and
 ${\rm HP}3'$ are examined. They are similar to
 ${\rm HP}2$ and
 ${\rm HP}3$ but with
 $s_x$ and
 $s_z$ exchanged (table 1). The wall-normal permeability in this way remains the same but the pore-coherent flow will change and its effect on the flow can be scrutinized. Additionally, the
 ${\rm HP}2'$ and
 ${\rm HP}3'$ have streamwise preferential anisotropy which will be factored into the analysis that follows.
When considering the flow fields of  ${\rm HP}2$ and
 ${\rm HP}2'$, one can observe a greater degree of spanwise coherence for
 ${\rm HP}2'$ in both its streamwise velocity field (figure 32c) and its wall-normal velocity field (figure 32g) compared with those of
 ${\rm HP}2$ (figure 32a,g). The spatial patterns of the velocity and pressure fields for
 ${\rm HP}2'$ (figure 32c,g,k) also visibly mirror one another, whereas this is less evident for
 ${\rm HP}2$ (figure 32a,e,i).
Instantaneous fluctuations of the (a–d) streamwise velocity, (e–h) wall-normal velocity and (i–l) pressure at  $y^+=0$: (a,e,i)
 ${\rm HP}2$; (b, f,j)
 ${\rm HP}3$; (c,g,k)
 ${\rm HP}2^{\prime }$; (d,h,l)
 ${\rm HP}3^{\prime }$. Flow direction is from left to right.

Examining the spectra in figure 33, it can be observed that the ambient turbulence has broadband spanwise coherent scales, in the range of  ${200}\lesssim {{\lambda _{x}}^+}\lesssim {800}$ and
 ${200}\lesssim {{\lambda _{z}}^+}$, in both the streamwise velocity (figure 33i,m), wall-normal velocity (figure 33j,n) and Reynolds shear stress (figure 33l,p) spectra of
 ${\rm HP}2'$ and
 ${\rm HP}3'$. The structure of the ambient turbulence in
 ${\rm HP}2$ and
 ${\rm HP}3$ is similar. The spectra of
 ${\rm HP}2'$ do, however, demonstrate a patch of more energetic broadband spanwise scales compared with
 ${\rm HP}2$ (this could be the reason why the flow field of
 ${\rm HP}2'$ in figure 32 manifests a greater degree of spanwise coherency compared with
 ${\rm HP}2$). When examining the pore-coherent flow, which are the areas enclosed by green lines in the spectra of figure 33, the broadband streamwise component of them overlap with the ambient turbulence scales to a certain extent such that a degree of scale interaction is taking place between them, but it is not over a wide enough range of scales to alter the structure of the ambient turbulence. For
 ${\rm HP}2'$ and
 ${\rm HP}3'$, the spanwise pitch length,
 ${s_z}^+$, is larger compared with
 ${\rm HP}2$ and
 ${\rm HP}3$, and thus the streamwise pore-coherent flow component overlaps with the ambient turbulence to a greater extent, but still not great enough to be disruptive to the overall dynamics of the turbulence in the near-surface region.
Premultiplied two-dimensional spectral densities: (a,e,i,m)  $k_x k_z E_{uu}$; (b, f,j,n)
 $k_x k_z E_{vv}$; (c,g,k,o)
 $k_x k_z E_{ww}$; (d,h,l,p)
 $k_x k_z E_{uv}$ at
 $y^+=0$. Here (a–d) case
 ${\rm HP}2$; (e–h) case
 ${\rm HP}3$; (i–l) case
 ${\rm HP}2'$; (m–p) case
 ${\rm HP}3'$. The
 ${\mathrm {green}}$ lines enclose the most energetically significant parts of the pore-coherent flow and the
 ${\mathrm {red}}$ lines those of the K–H-like rollers.


 Open access

