INTRODUCTION
During their juvenile stage many marine fish, including flatfish, use estuarine and adjacent intertidal habitats as nurseries (e.g. Norcross et al., Reference Norcross, Blanchard and Holladay1999; Stoner et al., Reference Stoner, Manderson and Pessutti2001; Amara & Paul, Reference Amara and Paul2003). Providing suitable conditions for rapid growth, namely high food abundance, refuge from predators and high water temperature, it is well accepted that such habitats are of higher quality for juvenile fish than surrounding waters and that they play a crucial role in fish life cycle (Gibson, Reference Gibson1994; Beck et al., Reference Beck, Heck, Able, Childers, Egglestone, Gillanders, Halpern, Hays, Hoshino, Minello, Orth, Sheridan and Weintein2001). Despite their important ecological functions, estuarine and adjacent intertidal habitats are also naturally stressful systems, where the environment is characterized by rapid and large spatio-temporal fluctuations (McLusky & Elliott, Reference McLusky and Elliott2004). In this context, variations in the quality of these habitats, i.e. according to fluctuations in abiotic (temperature, sediment type, salinity and oxygen) and biotic factors (e.g. availability of food and density of newly settled fish: Selleslagh et al., Reference Selleslagh, Amara, Laffargue, Lesourd, Lepage and Girardin2009, Reference Selleslagh, Lesourd and Amara2011), into which fish juveniles settle may affect the nursery function, and ultimately the population size. For flatfishes, the availability of high quality nursery areas is essential for successful recruitment (Gibson, Reference Gibson2005).
Growth and condition of juvenile fish are assumed to be a comprehensive indicator of habitat quality and individual health (Gibson, Reference Gibson1994), as it integrates environmental conditions (e.g. food resources, salinity and temperature) and individual performances (e.g. Able et al., Reference Able, Manderson and Studholme1999; Meng et al., Reference Meng, Gray, Taplin and Kupucha2000). Many fish-based indices (morphometric, histological, biochemical and growth indices) have been used to evaluate biological performances of fish (see review in Ferron & Leggett, Reference Ferron and Leggett1994). Among them, condition indices such as RNA/DNA ratio, Fulton's K condition index and recent otolith growth are efficient proxies for growth rate and nutritional status and provide information on fishes’ responses to habitat quality and environmental conditions (Gilliers et al., Reference Gilliers, Amara, Bergeron and Le Pape2004; Islam & Tanaka, Reference Islam and Tanaka2005; Amara et al., Reference Amara, Meziane, Gilliers, Hermel and Laffargue2007; Vasconcelos et al., Reference Vasconcelos, Reis-Santos, Fonseca, Ruano, Tanner, Costa and Cabral2009). Based on fish biological performances, there are two approaches to evaluate if one habitat is favourable to organisms: (1) comparing performances of wild organisms between sites; and (2) comparing their biological performances with high/critical values preliminarily defined by experiments. Actually, very few studies using the second approach (e.g. Tanaka et al., Reference Tanaka, Satoh, Yamada, Takebe, Nikaido and Shiozawa2008) have been undertaken in order to assess the status of field-caught larval or juvenile fishes.
Plaice, Pleuronectes platessa, a commercially important flatfish, is characterized by a concentration of juveniles in restricted shallow coastal areas during spring and summer months (e.g. Van der Veer, Reference Van der Veer1986; Amara & Paul, Reference Amara and Paul2003). Van der Veer (Reference Van der Veer1986) and Al-Hossaini et al. (Reference Al-Hossaini, Lui and Pitcher1989) reported that the immigration of post-larvae to nursery grounds occurs in ‘pulses’ with some inter-annual variability in the timing of arrival (Hyder & Nash, Reference Hyder and Nash1998; Wennhage & Pihl, Reference Wennhage and Pihl2001). Along the eastern English Channel coast, and particularly in adjacent intertidal areas of the Canche estuary, settlement of juvenile plaice takes place from March to June (Amara & Paul, Reference Amara and Paul2003; Selleslagh & Amara, Reference Selleslagh and Amara2008a). Because environmental factors which regulate growth, condition and survival of fishes are highly variable during the plaice settlement period (Selleslagh & Amara, Reference Selleslagh and Amara2008a, Reference Selleslagh and Amarab), patterns of habitat suitability for newly settled juveniles may also be dynamic. In the Irish Sea, Al-Hossaini et al. (Reference Al-Hossaini, Lui and Pitcher1989) showed that plaice settling sub-cohorts can have different mortalities on the nursery ground. Likewise, Fonseca et al. (Reference Fonseca, Vinagre and Cabral2006) showed that performances of juvenile soles Solea solea and Solea senegalensis in the Tagus estuary differed according to their arrival date in the nursery ground.
Taking into account these considerations, it would be expected that biological performances would vary among sub-cohorts of settlers arriving on the Canche intertidal nursery ground. As feeding condition is one important determinant of nursery habitat quality (Gibson, Reference Gibson1994) that can affect the condition and growth of flatfish (De Raedemaecker et al., Reference De Raedemaecker, Keating, Brophy, O'Connor and Mc Grath2011), the objectives of this study were to: (1) analyse the response of condition and growth (estimated by RNA/DNA ratio, Fulton's K condition index and recent otolith growth) of juvenile 0-group plaice experimentally exposed to starvation; and (2) test the hypothesis that juvenile plaice which colonize the Canche found suitable feeding conditions throughout the settlement period.
MATERIALS AND METHODS
Experimental design
This experiment was conducted in accordance with European Commission recommendations, on revised guidelines for the accommodation and care of animals used for experimental and other scientific purposes. The University of Littoral Côte d'Opale is authorized to conduct experimentation on animals in its capacity as a certified establishment; according to the administrative order No. B62-160-2.
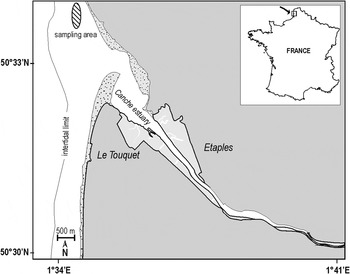
Newly settled juvenile plaice P. platessa were collected in April 2005 from the intertidal zone of a sandy beach located near a small estuary (the Canche) on the French coast of the eastern English Channel (50°33′N 1°35′E; Figure 1). This area has been identified as an important nursery ground for plaice (Amara & Paul, Reference Amara and Paul2003; Selleslagh & Amara, Reference Selleslagh and Amara2008a). Several short-time hauls (maximum 3 minutes to avoid stressing the fish) were performed until a sufficient number of individuals (N > 140) was obtained. Sampling was performed during daytime using a 1.5 m beam trawl equipped with fishing net with 5 mm mesh size in the cod-end. At the end of the sampling, juvenile plaice were delicately sorted, maintained in aerated seawater tanks (80 l each) and transported immediately to the laboratory. To reduce the potential size effect on biological analyses (e.g. Christensen & Korsgaard, Reference Christensen and Korsgaard1999), fish were selected according to size-classes (mean size ± standard deviation (SD) = 20.5 ± 3.6 mm).
Map of the Canche estuary and location of the adjacent sampling station (hatched circle).

In the laboratory (20 km from the sampling site), juvenile plaice were transferred into a large aquarium, attached to the seawater circulation system of the Station Marine of Wimereux, with sand as substratum (depth of 2 cm). The seawater was filtered (80 µm) and the sand previously burned at 450°C during 5 hours in order to minimize the occurrence of alternative sources of prey. One air-diffuser was placed in the aquarium to ensure full oxygen saturation and the experiment was conducted under natural photoperiod conditions. Fish were fed ad libitum once daily with frozen chopped mussels Mytilus edulis and Artemia sp. at 10:00 hours during 7 days (from 10 to 17 April) so they could recover from the stress of manipulations and laboratory conditions. Uneaten food was daily removed. At the end of the acclimatization period (17 April), 140 fish were equally and randomly divided into two groups and transferred respectively into two aquaria (160 l each) with identical precautions as described above. Food was withdrawn from the first group (starved S), and fish in the other group (fed F) continued to be fed ad libitum. Seven fish were randomly collected after 1 (T1), 2 (T2), 3 (T3), 4 (T4), 5 (T5), 7 (T7), 9 (T9), 14 (T14), 16 (T16) and 22 (T22) days from the starved group (S) and after 0 (to obtain the reference point T0), 1, 4, 9 and 14 days from the fed group. Since focus was made on response of starved fish in time, fish were sampled at different rates in the two treatments with more samples analysed for group S. Collected fish were immediately placed individually in a sterile cryogenic vial, deep frozen at −196°C in liquid nitrogen and later stored at −80°C until biological analyses were performed. Physico-chemical water quality (temperature, salinity, pH and oxygen) of aquaria were daily monitored during the experiment, except at the end due to technical problems.
Field collection
Wild juvenile plaice were collected in spring 2005 with a beam trawl, as described above, in the same nursery area where fish were captured for the starvation experiment. Weekly samplings were performed from early April to late May (eight sampling dates) in order to analyse growth and condition of juvenile plaice over the settlement period. After sampling, plaice were immediately sorted and newly settled individuals (total length (TL) < 25 mm) frozen at −20°C. In parallel, the following physico-chemical variables: temperature, salinity, pH and dissolved oxygen (mg. l−1) were measured at each sampling date using a Tetracon 325 and Cyberscan multiprobe.
Biological analyses
At the laboratory, experimental and field-caught juveniles were defrosted; measured (TL, mm) to the nearest 0.5 mm and weighed (wet weight (W), mg) with a sensitive electronic balance to the nearest 0.1 mg. Three biological indices were calculated on the same fish: RNA/DNA ratio, recent growth and Fulton's K condition indices as described below. Biological indices based on less than 5 individuals were excluded from results. Feeding activity of field-caught juveniles was evaluated by the vacuity index defined as the percentage of empty stomachs (Hyslop, Reference Hyslop1980).
RNA/DNA RATIO
This biochemical index is representative of the metabolic activity and then of the nutritional status (e.g. Tanaka et al., Reference Tanaka, Satoh, Yamada, Takebe, Nikaido and Shiozawa2008). The quantity of ribonucleic acid (RNA) varies with the rate of protein synthesis while the amount of desoxyribonucleic acid (DNA) per cell is species-constant in somatic tissue (Buckley & Bulow, Reference Buckley, Bulow, Summerfelt and Hall1987). A higher RNA/DNA ratio reflects a better nutritional condition (Clemmesen, Reference Clemmesen1994). Procedure used to determine RNA and DNA concentrations in individual fish is based on the Clemmesen (Reference Clemmesen1988) method. Only muscle tissue was carefully used because tissue from bone and skin could have very different RNA/DNA ratios and contribute to RNA/DNA measures. Dissecting tools were rinsed with deionized water after each sample dissections to avoid contamination. Fish muscle sample (±15 mg) was homogenized in 300 µl icecold (around 0°C) Tris-buffer (0.05 M Tris, 0.1 M NaCl, 0.01 M EDTA, 0.2 mg. ml−1 proteinase K, pH = 7.5) using an Ultra-Turrax. 30 µl 20% SDS was added and sample was mixed for 15 minutes and centrifuged (15 minutes, 6000 rpm). Then, 300 µl of phenol and 300 µl of chloroform-isoamylalcohol (24:1) were added to the solution before mixing (10 minutes) and centrifugation (10 minutes, 6000 rpm). This was carried out twice. The supernatant was then collected, washed twice with chloroform-isoamyalcohol, then mixed (1 minute) and centrifuged (5 minutes, 6000 rpm) to eliminate the phenol traces. Finally 200 µl of Tris-buffer was added to the resulting purified nucleic acid solution (aqueous phase). 5 µl of ethidium bromide (EB, specific fluorophor of nucleic acids) was added to 45 µl of sample to determine both RNA and DNA fluorescence. The fluorescence was determined by exciting at 365 nm and reading the emission at 590 nm using a spectrofluorometer. An aliquot of the sample was then treated with 0.3 µl ribonuclease A (10 mg. ml−1), incubated at 37°C for one hour and the fluorescence, assumed to be due to DNA, measured. The fluorescence due to RNA was then calculated as the difference between total nucleic acids fluorescence and fluorescence after ribonuclease treatment. Both RNA and DNA fluorescence were transformed to concentrations (ng. µl−1) from standard calibration curves (see Amara et al., Reference Amara, Selleslagh, Billon and Minier2009 for more details) and the RNA/DNA ratio was then calculated. The calibration curves were best fitted by the following linear regressions: DNA: y = 13.625 x; RNA: y = 8.229 x.
FULTON'S K CONDITION INDEX
Fulton's K condition index is considered a good indicator of the general welfare of the fish (Lambert & Dutil, Reference Lambert and Dutil1997) and is directly linked with food (Ferron & Leggett, Reference Ferron and Leggett1994). This morphometric index assumes that heavier fish for a given length are in better condition. It was calculated with the following formula:
 $$\hbox{K} \lpar \hbox{mg. mm}^{-3}\rpar = \lpar \hbox{W} / \hbox{TL}^{3}\rpar \times 100\comma \;$$
where W is the weight (mg) and TL the total length (mm).
RECENT GROWTH
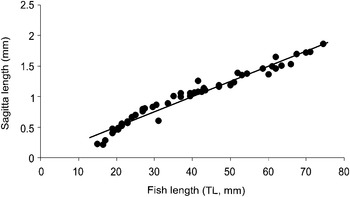
The recent growth index (RG; µm) was determined by measuring the width of the peripheral daily increments of the otoliths. Since the relationship between otolith diameter (sagitta) and fish length for juvenile plaice (based on plaice collected in the nursery area in spring 2006 with beam trawl as described above) was significant and best fitted by a linear regression (y = −0.034 + 0.0265 x: Figure 2), we used daily otolith increments from the last 5 days before capture as an indicator of recent growth (mean distance between the margin of the otolith back to the 5th ring). Sagittae (because they are the biggest otoliths and with distinct daily increments) were removed from the head and mounted on microscopice slides, sulcus side up, with cyanocrilate glue (Amara & Paul, Reference Amara and Paul2003). They were polished with a series of abrasive paper (from 5 to 0.1 µm grain size) until the accessory primordia and the increments at the outer edge were visible. Otoliths were analysed under transmitted light at 400 magnifications, using a video system fitted to a compound microscope. All the measurements were carried out by the same reader along the antero-posterior axis using an image analysis system (Leica FW 4000).
The relationship between fish length (total length (TL), mm) and the sagittal otolith diameter (µm) in juvenile plaice Pleuronectes platessa. Regression model: otolith diameter = −0.034 + 0.0265 TL; N = 54, R2 = 0.96, P < 0.001.

Statistical analyses
Differences in physico-chemical conditions and biological indices between treatments (fed F and starved S) and between samples for the field or each treatment were examined using t-test (N = 2) and one-way analysis of variance (ANOVA) (N ≥ 3) respectively, followed by post-hoc pairwise comparisons (Tukey test). Data were previously checked for normality and homogeneity of variances. Relationships between the 3 indices were tested using Pearson correlations. To test the null hypothesis of no effect of treatment fed/starved (that is no significant difference between starved and fed groups) on the RNA/DNA ratio, Fulton's K condition index and recent otolith growth, generalized linear models (GLMs), taking into account physico-chemical (temperature, salinity, pH and oxygen) and biological (density) variables, were computed. In the same manner, the best explanatory descriptors of biological variables of juvenile plaice collected in the field were tested by GLMs. Finally, equations computed by the GLMs allowed defining critical values below which fish can be classified as ‘starving'. A significance level of 5% was considered in all statistical analyses. XLSTAT was used to perform univariate analyses. GLMs were performed using R software (R Development Core Team, 2005).
RESULTS
Growth and condition under starving condition
Since no significant differences of temperature, salinity, pH and dissolved oxygen were observed between the two aquaria (t-test, P > 0.05), the mean value was presented for each variable (Table 1). During all the experiments physico-chemical parameters were constant, except for temperature which progressively and significantly (t-test, P < 0.05) increased from 14.5 on day 0 to 16.6°C on day 14 (Table 1). Mean (±SD) salinity was 34.2 ± 0.1, the pH was 8.1 ± 0.02 and the oxygen (mg. l−1) was 9.02 ± 2.26. During the experiment, there was no mortality of fish within the groups.
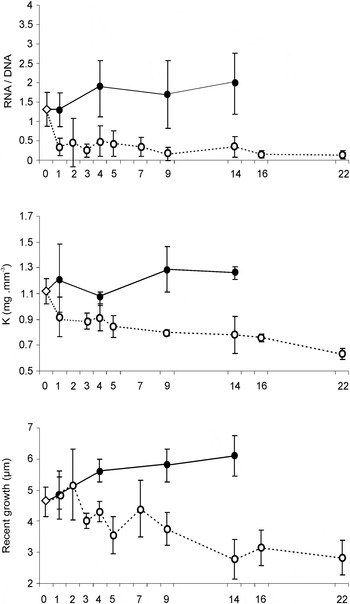
Variations in RNA/DNA, K and RG for fed (solid circles) and starved (open circles) juvenile plaice Pleuronectes platessa along the 22-days experiment. Grey lozenge denotes ‘reference point'. Vertical bars are 95% confidence limits.

Physico-chemical parameters (temperature, salinity, pH and dissolved oxygen) measured in aquaria during the experiment: 0, 1, 2, 3, 4, 5, 7, 9 and 14 days after the start of the experiment.

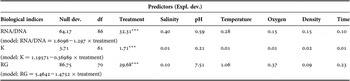
Over the 22-day experiment, there was a significant difference in the three analysed biological indices between fed ad libitum and starved groups (Figure 3; Table 2). According to GLMs (Table 2), treatment was clearly the best predictor which has significant effect on RNA/DNA ratio, Fulton's K index and RG index changes; percentage of deviance explained by treatment was 50.3, 46.1 and 34.2% for the three tested indices respectively. Other variables had no significant effect on the three tested variables (Table 2). In most cases, individuals from the starved group clearly had lower values than those from the fed group (Figure 3). In addition, the difference between the two groups (fed and starved) progressively increased with the length of the experiment, whatever the index (Figure 3). It was also noted that the timing of experiment necessary to observe a difference between the two groups varied according to indices. The three indices being considered, results indicated that the most drastic decrease was found in the RNA/DNA ratio. Indeed, after one day of food deprivation the RNA/DNA ratio of juvenile plaice dropped from (mean ± confidence interval) 1.30 ± 0.44 to 0.35 ± 0.22, showing a decrease of approximately 62%. The RNA/DNA ratio showed a significant difference between fed ad libitum and starved groups after 4 days of food deprivation (Figure 3). During the rest of the 3-week experimental study, the RNA/DNA ratio of starved fish remained below 0.5 and was not significantly different (ANOVA, P = 0.54). Although not significant (ANOVA, P = 0.39), the RNA/DNA ratio continued to slightly increase for juvenile plaice fed ad libitum (group F) and reached 1.98 ± 0.78 on day 14 (Figure 3).
Analysis of deviances for the generalized linear models computed on RNA/DNA, Fulton's K index (K) and recent otolith growth index (RG) for experimental plaice Pleuronectes platessa. Null dev., null deviance; df, degrees of freedom; Expl. dev., explained deviance; (**, P < 0.01; ***, P < 0.001).

Concerning the Fulton's K condition index, the pattern was relatively similar to that of the RNA/DNA ratio. GLMs based on the K index showed a significant effect of treatment (Table 2). Individuals from the starved group showed a rapid decrease of their general condition immediately after day 1 of experiment (Figure 3). On day 1, the K index of starved fish decreased by 18%, from 1.12 ± 0.09 to 0.92 ± 0.16 mg. mm−3 (Figure 3). The K index showed a significant difference between fed ad libitum and starved groups after 4 days of food deprivation (Figure 3). The K index of starved fish continued to progressively decrease until starvation day 22 (K = 0.63 ± 0.04 mg. mm−3: Figure 3) and significant differences were obtained along the experiment (ANOVA, P = 0.04). Three groups were identified (Tukey test): the first group consisted of days 1, 3 and 4; the second of days 5, 9, 14 and 16 and the third group consisted of day 22. In the fed group (group F), the K index indicated no significant variations (ANOVA, P = 0.09) over the time, with values ranging from 1.06 ± 0.05 mg. mm−3 (day 4) to 1.29 ± 0.18 mg. mm−3 (day 9) (Figure 3).
The recent otolith growth of juvenile plaice also showed a difference between starved and fed groups and a significant effect of treatment was observed (Table 2). Between starvation days 2 and 3, the last peripheral otolith increment widths decreased from 5.19 ± 1.14 µm to 4.02 ± 0.25 µm (Figure 3), indicating a decrease of 23% which was close to those of the K index but less important than those of the RNA/DNA ratio. The recent otolith growth significantly differed between fed ad libitum and starved groups after starvation day 9 (Figure 3). The recent growth of group S individuals showed variations between days 3 and 9 of the experiment procedure and then a decrease until the end of the experiment (day 22), reaching a value of 2.82 ± 0.55 µm (Figure 3). For both starved and fed groups, a significant difference was observed along the experiment (ANOVA, P < 0.05). Recent otolith growth decreased from 4.63 ± 0.47 µm (day 0) to 2.82 ± 0.55 µm for starved group (group S) but increased until 6.11 ± 0.65 µm (day 14) for fed group (group F) (Figure 3).
According to GLMs, the biological indices were predicted by the following equations: RNA/DNA = 1.6096−1.2907 × treatment; K = 1.19571−0.36989 × treatment; RG = 5.4642− 1.4752 × treatment (Table 2). Since ‘treatment = 1' (i.e. food deprivation), values of 0.32 for RNA/DNA, 0.83 mg. mm−3 for K and 3.99 µm for recent otolith growth have been referred to as critical threshold values below which juvenile plaice can be classified as ‘starving'. These values have been used as reference for analysing biological status of field-caught juvenile plaice.
Biological performances of wild juvenile plaice
Between April and May 2005, seawater temperature showed classical seasonal variation (Table 3) and increased gradually from 9.4°C in early April to a maximum of 14.0°C in late May. Salinity (ranging from 32.1 to 33.5), pH (between 8.4 and 9.3) and dissolved oxygen (ranging from 9.4 to 12.4 mg. l−1) showed stable values during the sampling period (ANOVA, P > 0.05: Table 3). Juvenile plaice occurred all over the study period with a mean density of 484.4 ind. 1000 m−2. Temporal variations of juvenile plaice density showed a classical trend with a progressive increase during April and a peak of settlement in early May (2120 ind. 1000 m−2), followed by a sharp decrease (Table 3). Preliminary samplings were performed in March to verify the start of the settlement period. Before April, only a few juveniles were captured. Since sampling lasted several consecutive weeks, alternation of spring/neap tides and full/new moons were observed (Table 3).
Variations of environmental variables and density of wild juvenile plaice Pleuronectes platessa during spring 2005.

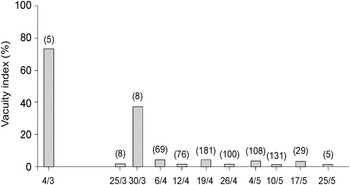
Vacuity index of field-caught juvenile plaice was very low all over the study period (mean value = 2.2%), ranging from 0 to 4.4% (6 April) (Figure 4), assuming that food availability was high in the intertidal nursery area for juvenile plaice during their settlement period.
Feeding activity (represented by vacuity index, %) of wild juvenile plaice Pleuronectes platessa between April and May 2005 (n = sample size).

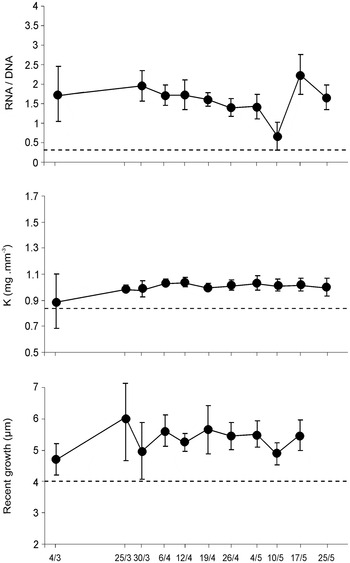
The RNA/DNA ratio of field individuals varied between 0.67 ± 0.36 (mean ± 95% confidence interval) (10 May, coinciding with peak density of plaice) and 2.24 ± 0.51 (17 May) and showed significant differences (ANOVA, P = 0.002) during the settlement period of juvenile plaice (Figure 5). The Fulton's K condition index ranged from 1.00 ± 0.02 mg mm−3 (19 April) to 1.04 ± 0.04 mg. mm−3 (6 and 12 April) and the recent otolith growth was high, ranging from 4.89 ± 0.36 µm (10 May) to 5.60 ± 0.51 µm (6 April) (Figure 5). Although fluctuant, K and RG did not vary significantly between samplings (ANOVA, P = 0.737 and 0.131 respectively). When comparing these results with critical threshold values defined experimentally, biological indices of wild juvenile plaice were, in general, clearly higher than those of stressed fish (Figure 5). These performances were under maximal values of fish fed ad libitum but close to optimal performances, defined by mean fed group values (RNA/DNA ratio = 1.71, K = 1.19 mg. mm−3 and RG = 5.4 µm). The three biological indices are poorly correlated between each other and a non-significant correlation was observed (P > 0.05).
Comparison of RNA/DNA, Fulton's K index (K) and recent otolith growth index (RG) of wild juvenile plaice Pleuronectes platessa between April and May 2005 to experimental critical threshold values (dotted lines). Vertical bars are 95% confidence limits.

Taken together, our results showed that only a very small number of fish can be classified as ‘starving' (Table 4). Indeed, less than 1% of juvenile plaice collected in the field during 2005 had a recent growth index lower than the critical threshold value of 3.99 µm. Likewise, the percentages of juveniles from the field with a RNA/DNA ratio and a Fulton's K condition index lower than threshold values (0.32 and 0.83 mg mm−3, respectively) were null (Table 4). Most individuals considered as starving fish were collected at the start of the settlement period (Table 4). Considering either RNA/DNA ratio, RG or K, the percentage of ‘starving fish' ranged from 0 to 3.3% whatever the index (Table 4). Only individuals collected on 10 May (and only from RNA/DNA ratios) were classified as ‘starved' (Table 4).
Percentages of starving wild juvenile plaice Pleuronectes platessa collected in 2005 according to RNA/DNA, recent otolith growth index (RG) and Fulton's K index (K). Global percentage is based on all individuals (N = number of fish analysed).

According to GLMs, RNA/DNA ratio, Fulton's K condition index and recent growth index of field-caught juvenile plaice were not explained by measured environmental variables (Table 5). Nevertheless, even if not significant, a weak density-dependent effect was suspected for the recent growth (P = 0.09: Table 5).
Analysis of deviances for the generalized linear models computed on RNA/DNA, Fulton's K index (K) and recent otolith growth index (RG) for wild plaice Pleuronectes platessa. Null dev., null deviance; df, degrees of freedom; Expl. dev., explained deviance; (*, 0.05 < P < 0.1).

DISCUSSION
The present study evaluates the sensibility of different biological indices on juvenile fish and estimates their efficiency by applying them to field data (e.g. Gwak & Tanaka, Reference Gwak and Tanaka2001; Tanaka et al., Reference Tanaka, Satoh, Yamada, Takebe, Nikaido and Shiozawa2008). Results indicate that the biological indices used in the present study can be applied with reliability on wild juvenile plaice. Indeed, the experiment clearly showed that the recent otolith growth, the Fulton's K condition index and the RNA/DNA ratio were sensitive to starvation and hence should detect environmental stress endured by juvenile fish in the natural environment. While the Fulton's K condition index and the RNA/DNA ratio showed a significant decrease after day 4 of food deprivation, the recent otolith growth significantly differed between fed ad libitum and starved groups after day 9 of the experiment procedure. RNA/DNA ratio and Fulton's K condition index seem to be more sensitive to stress (here nutritional conditions) than growth index. So, it is not surprising that employed biological indices were poorly correlated with each other, as reported by Gilliers et al. (Reference Gilliers, Le Pape, Désaunay, Bergeron, Schreiber, Guérault and Amara2006) on juvenile sole S. solea in the Bay of Biscay. This is explained by the fact that growth could be less responsive or less sensitive than biochemical indices (Haines, Reference Haines1973). Changes in food availability or deteriorating feeding conditions are reflected first on the RNA/DNA ratio, but their effects on recent otolith growth rates lag behind (Ramirez et al., Reference Ramirez, Cortés, Garcia and Carpena2004). This is due to the fact that RNA/DNA measure gives an estimation of the synthesis activity in tissues whereas growth results from both tissue synthesis and tissue degradation processes (Fukuda et al., Reference Fukuda, Sako, Shigeta and Shibata2001). Mehner & Wieser (Reference Mehner and Wieser1994) reported that in response to the stress of starvation, animals may reduce their resting metabolic rate and direct energy reserves away from growth into the support of vital processes. As reported by Gilliers et al. (Reference Gilliers, Le Pape, Désaunay, Bergeron, Schreiber, Guérault and Amara2006), the different time of response of biological indices suggests that no single measure may give an adequate description of fish habitat's quality.
Compared with results reported by other authors, the sensitivity of the biological indices measured on juvenile plaice is in accordance with the literature. For example, it has been shown that the RNA/DNA ratio of herring larvae significantly differs after 3–4 days of food deprivation (Clemmesen, Reference Clemmesen1994) and after one day following starvation for juvenile fishes (Stierhoff et al., Reference Stierhoff, Targett and Power2009). In the present study, the RNA/DNA ratio of starved individuals decreased after one day by a factor 3. This factor 3 has been observed on turbot larvae Scophthalmus rhombus by Clemmesen (Reference Clemmesen1988) following 5 days of food deprivation and on starved striped bass Morone saxatilis (Wright & Martin, Reference Wright and Martin1985). Likewise, recent otolith growth observed here showed a decrease of 60.9% (from 4.63 to 2.82 µm) after starvation day 22. A similar decrease (66%) has been reported for estuarine glass fish Ambassis vachelli by Molony & Choat (Reference Molony and Choat1990) after starvation day 33. As for RNA/DNA ratio, the sensitivity of the recent otolith growth toward food deprivation indicates variations between species. While in the present study an effect has been detected after day 4, which is consistent with post-larval Atlantic menhaden Brevoortia tyrannus (Maillet & Checkley, Reference Maillet and Checkley1989), a significant difference was observed on A. vachelli after starvation day 15 (Molony & Choat, Reference Molony and Choat1990). Current literature indicates that the time response to starvation varies according to fish species and the period of food deprivation, and might be attributed to the different physiological and ecological characteristics among fish species (Deng et al., Reference Deng, Zhang, Lin and Cheng2004). For the fed group, RNA/DNA and RG were higher at the end of the experiment. This can be explained by the natural temperature increase of seawater supplying the aquaria (from 14.5°C at the beginning to 16°C at the end of the experiment). Temperature is known to positively affect growth (e.g. Buckley, Reference Buckley1984; Hovenkamp & Witte, Reference Hovenkamp and Witte1991; Hjörleifsson & Palsson, Reference Hjörleifsson and Palsson2001) and RNA/DNA ratio (e.g. Hovenkamp & Witte, Reference Hovenkamp and Witte1991; Buckley et al., Reference Buckley, Caldarone and Ong1999) of both laboratory-reared and wild larvae/juvenile fish. For the same reason, it is not surprising that indices measured on field-caught juvenile plaice were lower than those from the fed ad libitum group (group F) because temperatures were always 3–4°C higher in the laboratory than in the field.
Consistent with other authors (Richard et al., Reference Richard, Bergeron, Boulhic, Galois and Person-Le Ruyet1991; Amara et al., Reference Amara, Meziane, Gilliers, Hermel and Laffargue2007, Reference Amara, Selleslagh, Billon and Minier2009), our study suggests that K, RNA/DNA and RG can be used as sensitive and efficient tools to assess nutritional condition and growth of fish and be applied on wild fish. According to the present experimental results, field-caught juvenile plaice were classified as ‘starving fish' when the RNA/DNA ratio, Fulton's K condition index and recent otolith growth were below 0.32, 0.83 mg. mm−3 and 3.99 µm, respectively. These threshold values are lower than those defined by other authors: 2 for striped bass M. saxatilis (Martin et al., Reference Martin, Wright, Means and Setzler-Hamilton1985) and 1.3 for sardine Sardina pilchardus (Chicharo, Reference Chicharo1998) for the RNA/DNA ratio for example. Comparisons between studies should be cautious since the critical values and the starvation status are species-specific (Tanaka et al., Reference Tanaka, Satoh, Yamada, Takebe, Nikaido and Shiozawa2008). Furthermore, measurements of nutritional status, based on the RNA/DNA ratio, vary with the procedure used (Esteves et al., Reference Esteves, Chicharo, Pina, Coelho and Andrade2000). These considerations underlie the necessity of the present experimental work to simultaneously assess biological performances for wild juvenile plaice collected in the Canche intertidal nursery area. Using the RNA/DNA ratio, 0.4% of field-caught juvenile plaice were classified as ‘starving'. It is important to note that nutritional status of fish was lower during the peak of density, in particular for RG, assuming that biological performance is density-dependent. However, according to GLMs, density of juvenile plaice in the area showed no significant effect on RNA/DNA values. This agrees with Gilliers et al. (Reference Gilliers, Le Pape, Désaunay, Bergeron, Schreiber, Guérault and Amara2006) who found no evidence for density-dependent effects on juvenile sole S. solea condition in the Bay of Biscay. Thus, other factors, which were not considered in the present study, are probably the cause of variability. Recently, De Raedemaecker et al. (Reference De Raedemaecker, Keating, Brophy, O'Connor and Mc Grath2011) showed that condition of juvenile plaice at sandy beach nursery grounds on the south-west coast of Ireland was affected by changes in diet. Likewise, Fonseca et al. (Reference Fonseca, Vinagre and Cabral2006) indicated that better food quality and quantity in certain periods could justify higher RNA/DNA ratios of young soles S. solea and S. senegalensis in the Tagus estuary (Portugal). For the two other indices K and RG, no density-dependent effect was observed. Taken together, these findings indicate that juvenile plaice are in good general condition since their biological performances were quasi-exclusively higher than critical values defined experimentally, suggesting that feeding conditions of the Canche intertidal nursery ground are favourable to fish settlement and survival.
The percentages of starving newly settled plaice were very low indicating that condition of fish is similar whatever their arrival time. This is consistent with previous studies showing that newly settled juvenile flatfish were in high condition in the first 2 months of coastal colonization (Fonseca et al., Reference Fonseca, Vinagre and Cabral2006; Glass et al., Reference Glass, Rooker, Kraus and Holt2008). In agreement with a previous study on juvenile plaice in the Wadden Sea reporting that food deprivation rarely occurs (Berghahn & Karakiri, Reference Berghahn and Karakiri1990), present results suggest that there is no ‘critical feeding period' for juvenile plaice during the settlement period. This finding was moreover supported by the fact that vacuity index of field-caught juvenile plaice was very low all over the study period, suggesting that food availability was high in the intertidal nursery area for juvenile plaice during their settlement period. Several studies showed that food for juvenile fishes was generally abundant and not limiting in shallow (e.g. Karakiri et al., Reference Karakiri, Berghahn and Van der Veer1991; Amara et al., Reference Amara, Laffargue, Dewarumez, Maryniak, Lagardère and Luczac2001) and offshore nursery areas (Amara & Bodin, Reference Amara and Bodin1995). Recently, Selleslagh et al. (Reference Selleslagh, Lesourd and Amara2011) confirmed this in the Canche estuary showing that macrobenthic organisms, in particular polychaetes, amphipods and molluscs which are important prey items of juvenile flatfishes, were abundant and not a limiting resource for fish during their settlement period. High conditions of juvenile plaice in nursery habitats, which is the present case, reduce the disease and predator vulnerability (Sogard, Reference Sogard1997), induce higher survival and ultimately favour recruitment success and maintaining fish stocks.
Although our findings suggest that environmental conditions of the Canche, in particular feeding conditions, are favourable to juvenile plaice growth and condition throughout the settlement period, it should be interesting to see how general this result is along the eastern English Channel. Investigations on biological performances of juvenile plaice, and other fish species, in the other main nursery areas would be realized.
ACKNOWLEDGEMENTS
This work was part of the CPER ‘Bloom de Phaeocystis' project with the support of Fond Européen FEDER and Conseil Régional Nord Pas de Calais. We are grateful to Christophe Minier (from LEMA laboratory, Le Havre) for nucleic acid analyses and students for their assistance during sampling and experiment. The authors wish to thank the two anonymous referees for providing useful comments on the paper.