Implications
This study found that genetically heavier sows have a greater genetic potential for high lactation feed intake, whereas fatness before the first farrowing was the most important factor for sows to complete lactation and survive to farrow in the second parity. Therefore, selecting for increased lactation feed intake could lead to larger commercial sows, which will ultimately have higher maintenance costs and potentially size-related production and welfare issues. From the genetic perspective, lactation intake was not the most informative criterion correlated with sow survival and should be considered in context with other sow attributes. Pre-farrowing feeding and management targeted at individual sows should be considered to improve phenotypic outcomes.
Introduction
Sow longevity, or retention of sows in a herd, is an increasingly important factor for the global pig industry (Serenius and Stalder, Reference Serenius and Stalder2006). A previous large-scale study based on data from an Australian production system (Hughes and Smits, Reference Hughes and Smits2002) showed that only 20% of sows reached a parity at which an economically sound management decision to cull was made, implying that 80% of the herd was being culled prematurely. The key factors associated with such high sow turnover were identified as increasing farm size, lack of skilled labour, disease, general management and genetics (Hughes and Smits, Reference Hughes and Smits2002). From a genetic point of view, it is important to establish the mechanisms that are responsible for declining sow longevity, as this trait is hard to change directly through selection.
Since the advent of best linear unbiased prediction (BLUP) and multi-trait selection, modern sows are the end product of breeding programmes characterised by accurate selection for key production traits of finishers and, more recently, litter size traits of sows. As a consequence of these breeding goals, it has been proposed that there are correlated responses to selection for lean growth efficiency in finishers, which have detrimental consequences for sow performance and longevity. First, sow maintenance requirements have increased because of a correlated response in mature body size, and there is good phenotypic evidence for this (McGlone et al., Reference McGlone, Vines, Rudine and DuBois2004) despite an absence of specific genetic parameters for mature body size in pigs. Second, it has been proposed that sow lactation feed intake capacity is reduced (Eissen et al., Reference Eissen, Kanis and Kemp2000), but there is little genetic or phenotypic data to substantiate this. Finally, owing to increased leanness, body condition (represented by fat reserves) of the breeding sow is reduced. Therefore, sows have lower reserves for maintenance, reproduction and re-breeding (Young and Aherne, Reference Young and Aherne2005), thereby exacerbating sow culling rates (Lopez-Serrano et al., Reference Lopez-Serrano, Reinsch, Looft and Kalm2000, Tarres et al., Reference Tarres, Tibau, Piedrafita, Fabrega and Reixach2006). Outcomes to selection for lean growth efficiency can potentially be exacerbated by concurrent successful selection for litter size traits, because this further increases demands on the sow during gestation and lactation. For example, on the basis of the results of the study conducted by Kim et al. (Reference Kim, Osaka, Hurley and Easter1999), Hermesch et al. (Reference Hermesch, Jones and Bunter2008) calculated that – for a realistic genetic trend in litter size of 0.1 to 0.2 piglets/year – sows need to eat an extra 50 to 100 g of feed/day during lactation to provide for the piglets alone. The overall scenario is that inadequate lactation intake will compromise both sow body condition at weaning and the survival or growth of their piglets.
Several phenotypic studies have shown the detrimental effects of low lactation feed intake on sow longevity (Koketsu and Dial, Reference Koketsu and Dial1997, Anil et al., Reference Anil, Anil, Deen, Baidoo and Walker2006, Hermesch and Jones, Reference Hermesch and Jones2007, Bunter et al., Reference Bunter, Smits, Luxford and Hermesch2008), but few have examined genetic relationship between these traits. Currently published studies suggest that genetic correlations between intake during lactation and sow longevity are more ambiguous than phenotypic results. For example, the results of the study conducted by Lewis and Bunter (Reference Lewis and Bunter2011), Bergsma et al. (Reference Bergsma, Kanis, Verstegen and Knol2008) and Bunter et al. (Reference Bunter, Lewis and Luxford2009) show low genetic correlations between lactation feed intake and longevity. It is possible that considering lactation feed intake in combination with aspects of sow body condition and health will be more informative.
The first paper in this series focused on genetic and phenotypic associations between finisher performance and the pre-mating period, with emphasis on growth, fatness and feed intake traits of the finisher, with lactation feed intake and sow survival to the second parity. In this paper, we examine the genetic and phenotypic associations between body condition before and after farrowing, reproductive outcomes, lactation feed intake and the gilts’ ability to survive unculled to farrow in the second parity.
Material and methods
Project data – animals
Project data for this study are the same as those described in the first paper of this series. Briefly, gilt production and feed intake data were collected on sows from two maternal lines at Rivalea, (Corowa, Australia). The project data comprised 3 604 individual gilts at selection generated from 216 sires. Project gilts that subsequently farrowed were recorded for their reproductive outcomes, lactation feed intake and body composition traits before and after farrowing. Historical records dating back to 2003 were included in analyses for performance test and litter size traits. The full data included 60 870 animals generated from 705 sires overall. Reproductive data from 19 680 sows were used in this study.
Project data – traits
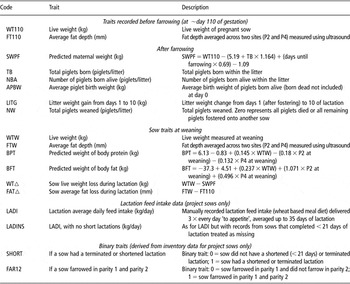
The traits used in this study are outlined in Table 1. Body condition and lactation feed intake data were available only on project females, recorded between mid-2006 and the last weaning in October 2008. Routinely recorded performance and reproductive traits were also available on their cohorts and historical sows (restricted to 2003 onwards). Reproductive data routinely recorded for all farrowed sows included total born (TB, pigs/litter), defined as the sum of live-born and fully formed still-born pigs, number of piglets born alive (NBA, pigs/litter) and the number of piglets weaned (NW, pigs/litter). Only first parity reproductive data were used, and litter size data from sibs and their cohorts farrowing outside the nucleus at other modules were available. Average piglet birth weight (APBW, kg/piglet) was recorded only in the nucleus herd.
Trait codes and definitions

P2: approximately 6.5 cm from the dorsal midline, at the level of the posterior edge of the head of the last rib.
P4 : 10 cm below tail base on the outside centre of the ham.
Only project sows were recorded for weight and fatness at day 110 of gestation (WT110, kg) and at weaning (WTW, kg), along with concurrent fat depth at the P2 and P4 sites. Project sows were also recorded for average daily lactation feed intake (LADI, kg/day) and litter weight at day 10 of lactation. Traits derived from these data included average fatness at day 110 of gestation (FT110, mm), predicted maternal body weight at farrowing (SWPF, kg), litter gain (LITG; kg) to day 10, average fat at weaning (FTW, mm), estimated body fat (BFT, kg) and protein (BPT, kg) mass at weaning, along with weight (WT△, kg) and fatness (FT△, mm) changes during lactation. Only sows that were weaned as part of their farrowing cohort were weighed and scanned for fat depth at weaning. The remaining unculled sows were subsequently weighed and scanned at mating. LITG was defined as the sum of piglet weight in a litter at day 10 of lactation minus the sum of piglet weight in a litter at day 1 after cross-fostering. In contrast to previous studies (Bunter et al., Reference Bunter, Lewis and Luxford2009), all LITG records were used, even if litter swaps occurred, as these types of records would typically not be identifiable in commercial data, which could be available for genetic evaluation. The traits of WT△ and FT△ were calculated as WTW−SWPF and FTW−FT110, respectively.
Prediction equations for BFT and BPT at weaning were developed in house using data from 58 mixed-parity sows culled at weaning. In brief, empty sow body composition was determined using Dual X-ray absorptiometry and combined with corresponding data recorded on non-carcase components, such as organs and viscera, to generate the reference data for sow's live weight and body composition. Live weight and scan data were subsequently fitted as covariates in a multivariate procedure to generate the prediction equations for BPT and BFT by parity group. The R 2 values for the prediction equations were 95.8% and 79.2%, showing a lower accuracy of predicting fat compared with protein mass. Predicted maternal mass after farrowing was also developed in house in a two-step process, using sow weight at day 110, placental and litter weight data in the first step (n = 66) and day 110 and post-farrowing weight of sows in the second step. The model for predicted maternal weight explained 92% of the variation in sow's post-farrowing weight (n = 139), which was also validated using a similar data set from a separate study.
Complete inventories were available for the project females. Therefore, information on the gilt such as age at test, age at mating(s), gilt gestational treatment and whether the gilt was medicated during gestation or the suckling period was available. Using inventory information, sows obtained binary descriptors for a shortened lactation length (SHORT), indicating whether the lactation event was <21 days, and survival from farrowing in first parity to farrowing in the second (FAR12). Data for sows that were transferred between units, where farrowing has subsequently been confirmed, were included in this study, in contrast to earlier studies (Bunter et al., Reference Bunter, Lewis and Luxford2009, Lewis and Bunter, Reference Lewis and Bunter2009). The sow's LADI or LADINS (LADI with shortened lactations removed) (kg/day) was similar to that defined in Lewis and Bunter (Reference Lewis and Bunter2011), the first paper of this series.
Data preparation and analysis
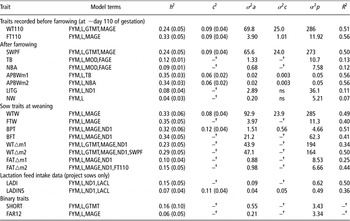
Data preparation and preliminary investigations were performed using SAS (SAS, 1999) and described as per Lewis and Bunter (Reference Lewis and Bunter2011). Approximate F-tests were used to assess the significance of systematic effects and/or their interactions. Only those effects significant at P < 0.05 were retained, with the exception of seasonal contemporary group, sow line and module (location), which were always fitted for the relevant traits regardless of the significance level. Seasonal effects, described as farrowing year/month (FYM: 61 levels), and line (L: 2 levels) were fitted in models for all traits, whereas the farrowing module (MOD: 3 levels) was significant for the routinely recorded litter size traits (TB and NBA). Treatments specifically applied during gestation (GTMT: 4 levels) included two dietary treatments (A and B) applied only to gilts that conceived at first mating; the remaining re-mated gilts were allocated to another class (C), and there was also a null treatment (H) for historical data. Treatment was considered significant only if treatment A was significantly different from treatment B, as treatment C could be accommodated through fitting an age covariate. Gilt treatment was only significant for WT110, SWPF and SHORT, but not condition (fatness) traits or APBW.
Random effect models were developed and parameter estimates were obtained using ASReml (Gilmour et al., Reference Gilmour, Cullis, Welham and Thompson2005), which estimates variance components under a linear mixed model by residual maximum likelihood procedures. Univariate analyses were used to obtain initial estimates of genetic parameters under an animal (continuous traits) or sire (binary traits) model, including the common litter as an additional effect if significant. The binary traits (SHORT and FAR12) were analysed using a logit link function. Solutions for model factors and regression coefficients were all derived from the univariate analyses. Genetic and phenotypic correlations were estimated using a series of bivariate analyses fitting the appropriate models for each trait as outlined in Table 2. A sire model was utilised in any bivariate analyses including a binary trait; ASReml allows the bivariate analysis of a binomial trait on the underlying scale (i.e. with a link function) combined with a normally distributed trait.
Estimates of heritability (h 2) and common litter (c 2) effects, with additive genetic (σ 2a), common litter (σ 2c) and phenotypic (σ 2p) variances from univariate analysesFootnote *

FYM = seasonal effect of farrowing year/month; L = line; GTMT = gilt gestational treatment class; MAGE = mating age in days; MOD = module number within farm; FAGE = farrowing age in days; ND1 = number of piglets alive at day 1 of lactation; LACTL = lactation length in days; TMTH = on test seasonal effect year/month.
* The proportion of variation explained by the model (R 2) is also shown.
–†Effect not fitted as not significant (P > 0.05); ‘mn’ refers to alternative (n) models used for APBW, WT△ and FAT△.
See table 1 for trait abbreviations.
Results
Data characteristics, solutions for systematic effects and heritability estimates for LADI, LADINS and longevity traits were discussed in the previous paper (Lewis and Bunter, 2011), and are not discussed again here.
Characteristics of the data
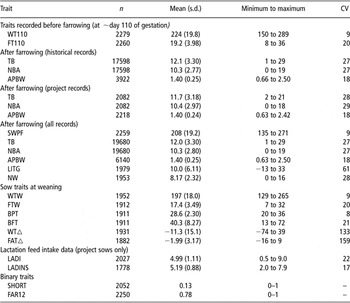
Overall means for reproductive traits (including historical data and non-nucleus sibs) for primiparous sows are presented in Table 3. Project gilts farrowed at 349 days of age on average following 115 days of gestation weighed 224 kg while pregnant, with a predicted post-farrowing maternal weight of 208 kg (Table 3).
Raw data characteristics for recorded sows (after editing)

See table 1 for trait abbreviations.
The average weight gain during gestation was 66 kg and included an average total litter weight of 14.4 kg (data not presented). This indicates that approximately 22% of gain during gestation in primiparous sows can be attributed to litter weight alone, on average; more if unweighed dead piglets and conceptus products are also considered. However, there was substantial variation among sows in the ratio of litter to maternal gain during gestation, where maternal gain can be calculated from SWPF. Gilts put on 2.06 mm of fat from mating to the end of their first gestation, on average, and obtained 19.2 mm fat depth before farrowing. On day 1 after farrowing, fostering was used to standardise the litter size suckled to ∼10 piglets/litter. This reduced the variability (as measured by the coefficient of variation (CV)) in piglets/litter from 27% to 10% at day 1 (data not presented). Piglet losses to day 10 were ∼11% on average, which was accompanied by an increased variability in average piglet weight between birth and day 10 (CV from 18 to 28) and the numbers remaining per litter (CV = 17) compared to day 1. During a targeted 4-week lactation, primiparous sows lost 11 kg of maternal BW and 2 mm of fat on average, showing that on average fat loss during lactation was similar to fat gained during gestation. The average age when weaning weight was recorded was 376 days.
CV for weight and fatness measures recorded at mating, before farrowing and weaning were generally very similar (∼9% to 10%). However, when weight and fat changes during gestation (CV = 26 and 81, data not presented) and lactation (CV = 133 and 159) are examined, a much greater level of variation is evident. Weight and fat changes during gestation ranged from 0 to +122 kg and −10 to +18 mm, whereas during lactation comparable values were −74 to +9 kg and −16 to +9 mm, showing enormous variability among sows in the transitions between different physiological states. A moderately high CV for LITG (61%) was also evident.
Systematic effects
Systematic effects including age at mating (MAGE) or farrowing (FAGE) were significant linear covariates for sow weight or fatness and farrowing traits; as these are highly correlated, only one alternative was fitted. APBW was adjusted for either TB or NBA (representing the number of piglets weighed) fitted as linear covariates, in two separate models. The number of piglets on day 1 (ND1) was a significant linear covariate for LITG, BFT, BPT, WT△ and FAT△. Additional model comparisons were performed for weight and fat loss during lactation; for example, maternal weight (SWPF) and fatness (FAT110) at the start of lactation were added to the model for WT△ and FAT△, respectively, as linear covariates.
Contemporary groups capturing seasonal changes alone accounted for 1% (TB) to 22% (FT110) of the observed variation in traits (data not presented). After season, line differences accounted for ∼0% (FTW) to 7% (APBW) of the variation in the data. Line differences were significant (P < 0.001) for the litter size traits (TB, NBA and NW), along with APBW and LITG. The significant line difference for number nursed, but not average piglet weight, was removed by cross-fostering on day 1. Significant line differences for finishing (2.3 kg) and mating (2.4 kg) weight increased in magnitude for pregnant weight before farrowing (6.1 kg), predicted maternal weight after farrowing (5.9 kg) and remained evident for weight loss during lactation (1.8 kg) and subsequently weaning weight (2 kg).
The variation associated with additional systematic effects was determined after fitting both season and line. Farrowing location (module) accounted for 1% of observed variation for TB and NBA. Gestational treatment accounted for 3% (WT110) to < 1% (FT110) of the trait variation (not significant). Increasing the mating age increased TB by 0.02 ± 0.002 pigs/litter per day and also moderately increased the total weight of the litter at birth (0.01 ± 0.004 kg/day). Older sows were also heavier and fatter at day 110 of gestation and lost slightly more weight during lactation (−0.01 ± 0.005 kg/day), but these effects are relatively small. For every piglet that was gestated, sow weight at day 110 was increased by 1.09 ± 0.11 kg/piglet, which was less than the average weight of a piglet at birth. Sow fat depth at day 110 was reduced with increasing TB by −0.08 ± 0.02 mm/piglet. The number of piglets that commenced suckling on day 1 (ND1) accounted for ∼1% of the variation in sow weight or fat loss. This equated to changes (reductions) of −0.83 kg in weight and −0.16 mm in fat per additional pig suckled, based on solutions for ND1.
Estimates of heritability
In general, genetic parameters were estimated using models that excluded alternate traits of interest as covariates. The reproductive traits of TB and NBA were lowly heritable (0.12 ± 0.01 and 0.09 ± 0.01), whereas APBW was moderately heritable (0.35 ± 0.03). In contrast, LITG to day 10 was lowly heritable (0.08 ± 0.04) and the estimate of heritability for NW did not significantly differ from 0 (0.04 ± 0.03). These results were in line with previously reported estimates (Rothschild, Reference Rothschild1996).
All traits measured on the sow at day 110 of gestation were moderately heritable (between 0.24 ± 0.05 and 0.33 ± 0.05) and were also affected by a common litter effect. Parameters for predicted maternal weight (SWPF) were almost identical to that for WT110, which is expected given the relatively small contribution of litter size and weight to variation among sows in their weight during pregnancy. Estimates of similar magnitude were estimated for pre- and post-farrowing weight or fatness traits. However, weight and fat change, in particular, during lactation were less heritable (0.23 ± 0.05 and 0.10 ± 0.04) than the absolute weight or fatness at weaning. The heritabilities of WT△ and FAT△ were increased after accounting for sow weight and fatness at the start of lactation, respectively (model 2 v. 1, Table 2). Whereas phenotypic variances for WT△ and FAT△ were reduced after fitting SWPF and FT110 as linear covariates, estimates of additive variation for weight and fat change were increased overall in the models in which the phenotypic starting point was accounted for.
Correlations between traits
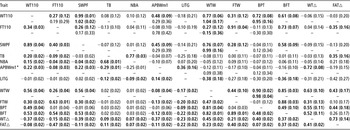
The genetic correlation between WT110 and SWPF did not differ from one, whereas the phenotypic correlation was 0.89 ± 0.04. Within-trait genetic correlations were very high between weight (0.77 ± 0.06) or fat depth (0.91 ± 0.04) recorded before farrowing and at weaning, whereas phenotypic correlations were much lower (0.56 ± 0.04 and 0.63 ± 0.01, respectively). Genetic correlations between weight before farrowing and weight or fat change (model 1) during lactation were low and negative but not different from 0, whereas corresponding phenotypic correlations were moderate and negative for weight change and low and negative for fat change. This indicates that phenotypically, heavier animals before farrowing lost more weight and fat during lactation; however at the genetic level this association was not apparent. In contrast, although the genetic correlation between FT110 and WT△ was also low (0.04 ± 0.14), the genetic correlation between fatness before farrowing and fat change during lactation was moderate and negative (−0.35 ± 0.16) and accompanied by a stronger negative phenotypic correlation (−0.47 ± 0.02), such that fatter animals before farrowing lost more fat during lactation. The phenotypic correlation between fatness before farrowing and weight change during lactation was negative (−0.15 ± 0.02), showing increased weight loss during lactation for fatter sows.
When WT△ and FAT△ were adjusted for pre-farrowing weight or fatness levels (model 2), estimates of genetic correlations generally did not significantly differ from model 1. However, phenotypic correlations were significantly altered: the negative correlations between WT110 and SWPF with FAT△ (Table 4) changed to 0.12 ± 0.02 and 0.10 ± 0.04, whereas that between FT110 and WT△ was weakened from −0.15 ± 0.02 to −0.01 ± 0.03. Subsequently, the positive correlations between weight or fat loss and sow attributes at weaning increased in magnitude. Genetic and phenotypic correlations between weight and fat changes during lactation and weight or fat at weaning were all positive, indicating that animals that lost less weight or fat during lactation were heavier and fatter at weaning. However, the genetic correlation between FAT△ and FTW was negligible (0.10 ± 0.17) contrasting with the moderate positive estimate (0.40 ± 0.02) at the phenotypic level. Weight change and FAT△ during lactation were highly correlated at the genetic level (0.73 ± 0.14) but only moderately correlated phenotypically (0.41 ± 0.02). The genetic and phenotypic correlations between weight and fat measures were very consistent across pre-farrowing and weaning traits (ranging from 0.26 ± 0.04 to 0.31 ± 0.12). Corresponding correlations between WTW and FTW were higher (0.44 ± 0.10 and 0.47 ± 0.02).
Estimates of correlations between genetic (above diagonal) or common litter (second line, above diagonal) effects, along with phenotypic (below diagonal) correlations from bivariate analyses

Correlations in bold differ from 0 by more than double the s.e.
Trait abbreviations are presented in Table 1.
*m1 Refers to model used for APBW.
When the body composition measures are examined in the context of reproductive output (TB and NBA), significant phenotypic correlations between WT110 and litter size traits (0.20 ± 0.02 and 0.15 ± 0.02) were diminished by correcting for the litter contribution to sow weight recorded before farrowing. The phenotypic correlations between SWPF and TB or NBA were therefore not different from 0 (−0.03 ± 0.02). Generally, no significant genetic or phenotypic correlations were evident between TB or NBA and maternal weight or fatness before farrowing or at weaning, or sow weight change during lactation. The exceptions were the low negative phenotypic correlation between FT110 and litter size traits, showing a negative association between gestating litter size and fat gain during gestation (results not reported), along with the moderate positive genetic correlation between litter size traits and fat loss during lactation. Sows gestating larger litters had less weight and fat loss during lactation, as indicated by the low but positive phenotypic correlations between litter size traits and WT△ or FAT△ (model 1, with model 2 showing nearly identical results).
In contrast to the above, there were strong positive genetic (and moderate phenotypic) correlations between sow weight (WT110 or SWPF) and APBW (0.48 ± 0.09 and 0.45 ± 0.09 v. 0.22 ± 0.03). However, correlations were low and negative between APBW and sow weight by weaning (r a = −0.12 ± 0.11; r p = −0.08 ± 0.04) because of strong negative correlations between APBW and WT△ (r a = −0.72 ± 0.08; r p = −0.37 ± 0.02) or APBW and FAT△ (r a = −0.19 ± 0.15; r p = −0.11 ± 0.02). That is, sows with heavier piglets at birth had more weight and fat loss during lactation, with a net reduction in sow weaning weight. Correspondingly, APBW and LITG were positively correlated genetically and phenotypically (0.36 ± 0.16 and 0.14 ± 0.02) and correlations between LITG and WT△ or FAT△ were negative (ranged from −0.42 ± 0.27 to −0.22 ± 0.02). As litter size was negatively correlated phenotypically with APBW, negative phenotypic correlations observed between TB or NBA and LITG could be expected. However, corresponding genetic correlations were not significantly different form 0, although stronger for NBA.
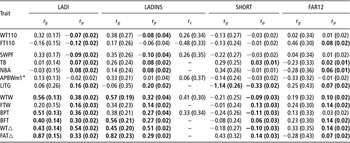
Genetic correlations between lactation feed intake and TB, NBA, APBW or LITG were low and not different from 0 (Table 5). However, phenotypic correlations between lactation intake and litter size or LITG were all positive (ranged from 0.07 ± 0.02 to 0.16 ± 0.02), indicating sows farrowing larger litters, or with higher LITG (as litter size and gain are negatively associated phenotypically, Table 4) ate more during lactation. The correlation between LITG and LADI was much lower than reported previously (Bunter et al., Reference Bunter, Lewis and Luxford2009), suggesting that trait definition (i.e. removing records associated with litter swaps) significantly affects estimates of correlations. Genetic correlations between LADI or LADINS and sow weight traits (WT110, SWPF) were positive (ranged from 0.32 ± 0.17 to 0.38 ± 0.27), contrasting with the significant negative phenotypic correlations between these traits (−0.07 ± 0.02 to −0.08 ± 0.04). Moderate genetic and phenotypic correlations between LADI or LADINS and WT△ (ranged from 0.43 ± 0.14 to 0.54 ± 0.02) were evident, showing that increased intake during lactation reduced sow weight loss during lactation and was associated with higher sow weaning weight (0.32 ± 0.04 to 0.57 ± 0.19). Genetic correlations between LADI or LADINS and FAT△ were even stronger (0.82 ± 0.23 and 0.87 ± 0.15), whereas phenotypic correlations were much weaker (0.33 ± 0.02 and 0.29 ± 0.02). The net result was that lactation feed intake was positively correlated genetically and phenotypically with FTW (estimates ranged from: 0.14 ± 0.02 to 0.34 ± 0.23), whereas the phenotypic correlation between fat and lactation intake was negative when fatness was recorded before farrowing. Moderate-to-high positive genetic and phenotypic correlations between LADI or LADINS and BPT or BFT (0.27 ± 0.04 to 0.56 ± 0.21) are consistent with the results for weaning weight and fatness.
Estimates of correlations between genetic (rg) and common litter (rc) effects, along with phenotypic (rp) correlations for sow physical characteristics and reproductive traits with lactation feed intake and survival traits

Correlations in bold differ from 0 by more than double the s.e.
Trait abbreviations are presented in Table 1.
*m1 refers to model used for APBW.
Phenotypic correlations indicate that sows with higher litter size, low LITG (in particular), more weight loss or less fat loss (model 1) were more likely to have shortened lactations. The net result was a negative association between SHORT and WTW or BPT, but a positive association between SHORT and FTW or BFT. However, it must be remembered that sows with shortened lactations were frequently not recorded for weight or fatness at their premature weaning, which may bias phenotypic estimates in particular. Phenotypic correlations also indicate that primiparous sows that were fatter before their first farrowing, farrowing larger litters, with good LITG to day 10, with less weight or fat loss during lactation and with higher weight and fatness levels at weaning were more likely to farrow in their second parity (phenotypic correlations ranged between 0.07 ± 0.02 and 0.14 ± 0.02). In most cases, corresponding genetic correlations were generally consistent with phenotypic correlations in direction and of larger magnitude, but with large standard errors. The exception was FAT△ in which a moderate negative genetic correlation was estimated, which was not significantly different from 0. After accounting for either pre-farrowing weight or fat levels (model 2), there were no significant changes in the direction or magnitude of the correlations between WT△ or FAT△ and SHORT or FAR12. All genetic correlations involving FAR12 or SHORT were accompanied by large standard errors.
Discussion
Genetic parameters for TB, NBA and APBW have been widely reported elsewhere and are not discussed in detail here. Generally, results from this study were consistent with those reviewed by others (e.g. Rothschild and Bidanel, Reference Rothschild and Bidanel1998) or estimated previously using data from this population (Tholen et al., Reference Tholen, Bunter, Hermesch and Graser1996; Bunter et al., Reference Bunter, Smits, Luxford and Hermesch2008). The relatively low genetic correlation between TB and APBW has also been observed previously in this particular population (Bunter et al., Reference Bunter, Smits, Luxford and Hermesch2008). Despite the low genetic correlations, moderate negative phenotypic correlations between litter size traits and APBW are consistent with other studies, supporting the concept that, generally, there is a linear decline in piglet birth weight with increasing litter size (Nguyen et al., Reference Nguyen, McPhee and Wade2003), probably as a consequence of increasing competition for limited resources during gestation with increasing TB. However, these correlations are not unity, reflecting the substantial variation among sows in the weight of their piglets for a given litter size.
In contrast to the above, there are relatively few studies that provide parameters to describe the body development of gilts from selection to parturition, and the correlations between these sow characteristics, sow reproductive performance and longevity. In this study, moderate estimates of heritability for sow weight and fatness, and the genetic relationships between weight and fatness, were largely consistent at different time points. That is, the proportional expression of genetic potential for weight (size) and fatness was similar at selection (20 weeks), before mating (29 weeks), before farrowing and (predicted) after farrowing and at weaning. This trend was also accompanied by high within-trait genetic correlations (0.77 ± 0.06 to 0.99 ± 0.01) between time points, suggesting that a high proportion of common genes act to influence sow body traits despite substantial changes to sow physiology during pregnancy and lactation. This is consistent with the continuing growth and development of the sow that occurs during their first gestation, when they have still not attained mature body size. However, it can also be shown that the gestating litter hinders the gilt in displaying her individual genetic potential for growth. For example, the heritability of maternal gain during gestation was estimated (0.14 ± 0.04) and this estimate is significantly lower than the heritability for growth earlier in life (0.20 ± 0.01, see previous paper in this series).
In contrast to very high genetic correlations are the relatively lower within-trait phenotypic correlations (∼0.60) between time points, accompanying the enormous variability observed among sows in weight or fat changes between mating and farrowing, or between farrowing and weaning; time intervals of ∼16 and 4 weeks, respectively. However, for comparison, genetic and phenotypic correlations between sequential live weight of non-pregnant growing pigs averaged 0.87 and 0.63, respectively, over a sequence of four-week intervals, from 18 to 22 weeks of age, (Huisman et al., Reference Huisman, Veerkamp and van Arendonk2002). Thus, characteristics of parameters for the live weight development of sows during their first gestation are quite similar to those of non-pregnant growing pigs over comparable time frames. Ferguson et al. (Reference Ferguson, Harvey and Irvin1985) previously reported low phenotypic (0.62) and residual (0.27) correlations between sow weight at day 110 and weaning. Strong environmental influences (health, lactation intake) within the farrowing environment clearly reduce the association between sow weight before and after lactation, such that considerable re-ranking can be expected.
Means for BPT and BFT at weaning were lower in this study compared with those of Bergsma et al. (Reference Bergsma, Kanis, Verstegen and Knol2008), who predicted sow body protein and fat mass at the start of lactation for multiparous sows. Heritability estimates for predicted body fat and protein mass in this study were consistent with heritabilities for WTW and FTW, but substantially lower (0.32 and 0.34) than the comparable values of 0.52 and 0.39 reported by Bergsma et al. (Reference Bergsma, Kanis, Verstegen and Knol2008). However, it is not possible to directly compare prediction equations between these studies.
Results of this study, Bunter et al. (Reference Bunter, Smits, Luxford and Hermesch2008) and elsewhere (Rothschild and Bidanel, Reference Rothschild and Bidanel1998; Estany et al., Reference Estany, Villalba, Tibau, Soler, Babot and Noguera2002) show that genes affecting litter size, which is largely controlled by ovulation rate and embryo survival, are generally independent of the genes controlling sow body size and fatness. Therefore, there were generally no significant antagonistic genetic correlations between sow body size or fatness and litter size traits. However, there were antagonistic phenotypic correlations in these data between litter size and sow maternal gain (data not presented, see Bunter et al., Reference Bunter, Smits, Luxford and Hermesch2008 and Reference Bunter, Lewis, Hermesch, Smits and Luxford2010). Primiparous sows gestating larger litters attained less maternal gain and lower fat levels before their first farrowing. This outcome is logical: as there is no differential feeding among sows according to their gestating litter size demands, there is, on average, a trade-off between sow maternal gain during gestation and in utero litter growth at the phenotypic level. This trade-off would be expected to be highest for large, fast-growing sows carrying large litters and, as is noted later, has implications for both sow and litter performance.
The generally positive correlations between sow BW and piglet birth weight (and thus subsequent growth) in this study have also been observed previously (Hogberg and Rydhmer, Reference Hogberg and Rydhmer2000; Johnson and Nugent, Reference Johnson and Nugent2004). This outcome is consistent with the positive correlations between piglet birth weight and lifetime growth rate (Suarez et al., Reference Suarez, Hermesch, Braun and Graser2005). Progeny of sows with higher lean growth potential are expected to have heavier birth weight on average, based on both within-line and between-line association studies. Whereas APBW was moderately heritable, LITG was only lowly heritable. This outcome partly results from the fact that values for LITG can be dominated by variation in piglet survival, which itself is only lowly heritable. Weight attributable to piglets that subsequently die is not accounted for in the calculation of LITG. LITG was favourably correlated with APBW, consistent with favourable associations between birth weight and piglet survival (see review by Bunter, Reference Bunter2009) or piglet growth rate thereafter (Suarez et al., Reference Suarez, Hermesch, Braun and Graser2005). LITG, however, was largely uncorrelated with sow body characteristics (WT110 and FT110) before farrowing, but was negatively associated with litter size gestated at the phenotypic level, consistent with the strong negative phenotypic association between APBW and TB.
The moderately high CV for LITG (Table 3) was accompanied temporally by high CVs for sow WT△ and FAT△ during lactation. This could suggest that there is considerable variation in the amount of resources that the sow will put into her litter during lactation, but might also simply be an artefact of the short time frame involved and potentially measurement error. Following on from the concept of a gestational trade-off between the sow and piglets, it is plausible that there is a trade-off between self-maintenance of the sow and providing for her litter during lactation, leading to greater variation within these traits. In addition, there were strong negative genetic (−0.72 ± 0.08) and phenotypic (−0.37 ± 0.02) correlations between WT△ and APBW. Heavy piglets have better vitality at birth, suckle more and survive better (Edwards, Reference Edwards2002). Therefore, lactation demands on the sow are increased, coincidental with diminished pre-farrowing fatness and increased sow maintenance requirements. If fat is less available for mobilisation, sows will lose more protein (and therefore weight) during lactation (Shurson et al., Reference Shurson, Isler, Irvin and Peterson1991). The genetic and phenotypic correlations between APBW and FAT△ were weaker (−0.19 ± 0.15 and −0.11 ± 0.02, respectively) but in the same direction when compared under models 1 and 2. Although the importance of weight and fat loss during lactation for subsequent reproductive outcomes have previously been highlighted in other studies (Close and Mullan, Reference Close and Mullan1996), they constitute substantial reductions in primiparous sows, which are still developing. In this study, maternal weight and fat losses were ∼5% and 10%, respectively, which are similar to the 7% reported by Shurson et al. (Reference Shurson, Isler, Irvin and Peterson1991) and the 7% protein loss reported by Bergsma et al. (Reference Bergsma, Kanis, Verstegen and Knol2008).
At the genetic level, weight and fat losses during lactation were highly correlated (0.73 ± 0.14), suggesting that the mobilisation of both protein and energy resources is coordinated by the same genes during lactation. The phenotypic correlation was much lower (0.41 ± 0.02). Changes in sow BW during lactation were uncorrelated genetically with maternal weight at the start of lactation, whereas the corresponding genetic correlation between FT110 and FAT△ was −0.35 ± 0.16. This suggests that sows that are more able to accumulate fat during gestation owing to their genetic potential are also more able to mobilise fat during lactation. These sows are potentially smaller and earlier maturing than their leaner counterparts (Eissen et al., Reference Eissen, Kanis and Kemp2000) or have increased genetic potential for fat deposition and mobilisation. Significant negative phenotypic correlations between SWPF and WT△ or FT110 and FAT△ confirm that heavier and fatter sows before farrowing lost more weight during lactation. The net result was almost neutral in the sense that the gestational gain in fatness was only slightly less than loss during lactation. Researchers have suggested that (mature) lactating humans generally attain pre-pregnancy fatness levels by the end of lactation (Abrams, Reference Abrams2000), although certain health issues and obesity can compromise this pattern. Therefore, low availability of accumulated resources before farrowing will be accompanied by low mobilisation of resources during lactation, on average. Unless this deficit can be fully compensated for by increased lactation intake, lactation and re-breeding performances will be compromised.
Only a couple of previous studies have examined body fat changes during lactation along with feed intake data (Grandinson et al., Reference Grandinson, Rydhmer, Strandberg and Solanes2005; Bergsma et al., Reference Bergsma, Kanis, Verstegen and Knol2008). Other studies focused on fat levels at farrowing (Dourmad, Reference Dourmad1991; Young et al., Reference Young, Tokach, Aherne, Main, Dritz, Goodband and Nelssen2004), which, as noted above, are not independent of the potential to lose fat during lactation. In this study, it is clearly shown that lactation feed intake is positively correlated with sow weight and fatness at weaning, and reduced weight or fat loss during lactation. Although part of phenotypic correlations might be through an autocorrelation arising from variation in gut fill associated with feed intake, correcting for gut fill has only a minor impact on the estimates. Similar results were observed by Serenius and Stalder (Reference Serenius and Stalder2004) and Bergsma et al. (Reference Bergsma, Kanis, Verstegen and Knol2008). Between-line differences showed that larger maternal size and higher lactation intake also accompanied selection for increased litter size in a mouse model (Rauw et al., Reference Rauw, Hermesch, Bunter and Gomez-Raya2009), but these associations were not necessarily evident from within-line associations.
However, in contrast to results for weaning weight and weight or fat loss, genetic and phenotypic correlations between pre-farrowing weight and lactation intake are opposite in sign; larger sows have the genetic propensity to eat more, consistent with their expected higher maintenance requirements and larger size, but the phenotypic correlations indicate that heavier and fatter sows in particular eat less during lactation. Similar results were obtained by Bergsma et al. (Reference Bergsma, Kanis, Verstegen and Knol2008). As weight and fatness are positively correlated phenotypically, there is again the possibility of an autocorrelation between weight and lactation intake that arises from the effect of fatness, rather than weight, on intake. The negative association between fatness before farrowing and lactation intake has been observed previously (Mullan and Williams, Reference Mullan and Williams1989) and suggests that fatter sows do not need to eat as much during lactation. In the current data, fatter sows ate less in early lactation, which will reduce average lactation intake values, but it is yet to be established that they eat less throughout the entire lactation. In contrast, heavy, lean sows might not eat less during lactation because they have a more limited ‘dispensable’ energy source for lactation, in the form of fat stored before farrowing. Heavy, lean sows that do not have sufficiently high lactation intake will likely have poorer longevity due to excessive weight loss. However, weight loss-associated stress can trigger increased appetite to compensate (Doucet et al., Reference Doucet, Imbeault, St-Pierre, Almeras, Mauriege, Richard and Tremblay2000) or alternatively inhibit appetite suppression (Ozcan et al., Reference Ozcan, Ergin, Lu, Chung, Sarkar, Nie, Myers and Ozcan2009), as shown in other species.
Bergsma et al. (Reference Bergsma, Kanis, Verstegen and Knol2008) were the first to coin the term lactation efficiency (LE, defined as output/input), which combines the resources provided by the sow (through weight and fat loss) with lactation intake into an input variable, after accounting for sow maintenance requirements, and relates this input to piglet output. Their study showed strong positive correlations between LE and output and strong negative correlations of similar magnitude between total inputs (and lactation feed intake) and LE, suggesting that the most efficient sows during lactation mobilised their own body reserves less and also ate less for a positive litter survival (%) and weight gain. However, better LE was only based on piglet output and therefore not accompanied by improved re-breeding at weaning at the phenotypic level. Therefore, one can assume that this definition does not fully describe sow level outcomes that are beneficial for longevity.
Extensive studies in humans show that the mobilisation of both fat and protein reserves occurs during periods of energy deficit, as occurs during physiological states such as starvation or lactation. Although the relative proportions vary among individuals, there are a few guiding principles (see Payne and Lipton, Reference Payne and Lipton1994). The first principle is that it is more efficient to mobilise fat than protein because fat is essentially dispensable, costs less to mobilise and yields greater net energy per unit metabolised. Therefore, it is metabolically efficient to store fat before periods of energy deficit. Second, if there is limited fat to mobilise, protein must be mobilised as an energy source, but only dispensable protein can be mobilised if there is to be no impact on ongoing health or reproductive outcomes. Third, the continual swings that occur between positive and negative energy balance with changes in physiological state (or food supply) do not result in a permanent change in the body composition of mature individuals provided there is a period when fat and protein stores can be replenished. In the context of pig production, this suggests that fat mobilisation is not detrimental generally, whereas protein mobilisation is. This concept was confirmed by Le Dividich and Seve (Reference Le Dividich and Seve2000) who showed that underfeeding markedly increases fat but not protein mobilisation, indicating that significant physiological stress is required for protein mobilisation. These observations are confirmed generally in this study (and also in Bunter et al., Reference Bunter, Smits, Luxford and Hermesch2008) by the fact that heavier and fatter sows before farrowing were less likely to have shortened lactations and more likely to farrow in their second parity. However, extension of the current analyses to longevity until later parities unfortunately does not support an ongoing favourable association between sow weight and longevity, whereas the positive associations between fatness measures and longevity is maintained (Bunter et al., Reference Bunter, Lewis, Hermesch, Smits and Luxford2010).
The next logical step in controlling sow condition and thus longevity could be to examine gestational feed intake strategies. The majority of production systems do not have formal strategies to feed sows differentially based on their own and gestating litter requirements, although adapting feeding level according to sow body condition may indirectly go some way towards achieving this goal. Not adapting gestational feeding to individual requirements can place both sows and piglets (Kim et al., Reference Kim, Hurley, Wu and Ji2009) in a sub-optimal state before farrowing and increase the necessity of obtaining high lactation intakes to meet energy requirements. This is not always possible, as seasonal constraints such as high temperature, parity effects (Hermesch and Jones, Reference Hermesch and Jones2007) and health issues (Lewis and Bunter, Reference Lewis and Bunter2009) can hinder lactation intake. If the condition of the sow could be more controlled upon entry into the farrowing house, then perhaps pressure could be alleviated on LADI as a means of maintaining good, or making up for poor, condition on entry. Controlling individual gestational feed intake (and thus condition upon entry into the farrowing environment) will likely become increasingly important for sow longevity issues when sows are group housed.
With respect to FAR12, productive sows with good litter size and litter weight gains were more likely to survive to the next parity, as also seen previously in studies conducted by Tholen et al., (Reference Tholen, Bunter, Hermesch and Graser1996) and Serenius and Stalder (Reference Serenius and Stalder2006). Further, LITG and beneficial outcomes for sow body condition at weaning are favourably correlated with lactation intake overall. Sows in better condition at weaning are more likely to re-breed and retain their pregnancy, whereas low lactation intake is also associated with health issues (Bunter et al., Reference Bunter, Lewis and Luxford2009; Lewis and Bunter, Reference Lewis and Bunter2009). Coheritabilities (Yamada, Reference Yamada1968) between each trait and FAR12 were calculated to determine the traits most associated with survival to the second parity. The coheritability between trait i and FAR12 is defined as hir ah FAR12, where h is the square root of the heritability and r a is the genetic correlation between trait i and FAR12. The largest coheritabilities were between FAR12 and FT110 (0.07) followed by WT△ (0.04), with coheritabilities involving most of the other traits at ∼0.01. The traits with the lowest coheritabilites were SWPF and LITG. These results suggest that, from the genetic perspective, pre-farrowing fat levels play a more critical role in survival to the second parity than reproductive traits or condition changes during lactation. Parameters presented in this study show that factors associated with the current farrowing and lactation event are much more informative in predicting survival to the next parity than previous records (e.g. performance as a finisher, see Lewis and Bunter, Reference Lewis and Bunter2011), perhaps because of the extremely variable nature of transition characteristics between the two time points. It seems likely that the events surrounding farrowing and lactation have more direct ramifications on survival within the herd, but are not entirely independent of the underlying genetic potential that influences the development of phenotypic characteristics of sows later in life.
Acknowledgements
The authors thank the Pork CRC for funding projects 2D-104-0506 and 2E-101-0506, which generated data for this study, and Brian Luxford at Rivalea Australia (formally QAF Meat Industries) for supplying the data. Special thanks are extended to Matthew Tull and other staff at Rivalea for their diligent data collection.