Implications
Responses in mean fibre diameter (MFD) of Merino wool to changes in fleece-free liveweight (FFLwt) were in accord with the primary response of MFD being proportional to the changes in the skin surface area arising from changes in animal size. However, this response can change with individual sheep and nutritional environment. Comparisons of MFD between sheep are more likely to have a biological basis when standardised to a common FFLwt than when standardised to a common age. Wool quality (MFD and staple strength) will be optimised in management systems that maintain constant FFLwt of adult sheep within and between years.
Introduction
Mean fibre diameter (MFD) is the primary determinant of the price received for apparel wool, but its importance varies with fashion trends and other factors which influence commercial trade and wool processing. Generally, finer wool receives greater prices. MFD is the most important physical property of wool as it influences processing variables such as top-making yields, quantities of waste products, yarn properties and processing speeds (e.g. Hunter, Reference Hunter1980). Further, as fibre diameter has fundamental effects on the bending and buckling behaviour of fibres it is the main influence on the ability of manufacturers to manipulate fabric properties such as mass per unit area and fabric drape (Hunter, Reference Hunter1980), fabric comfort and handle attributes including the sensations of prickle, sweat and moisture experienced by consumers (e.g. McGregor et al., Reference McGregor, Naebe, Wang, Tester and Rowe2015).
Fine wool is produced in many countries where it is understood that as Merino sheep increase in age the MFD of their wool increases. The view, regarding the importance of age in determining wool MFD, has been reinforced in the many investigations into the genetics of the properties of wool, where the main method of reporting the results uses increments in age as a primary classifying method, for example, Australian Merino (Newton Turner and Young, Reference Newton Turner and Young1969; Hill et al., Reference Hill, Ponzoni and James1999; Fozi et al., Reference Fozi, van der Werf and Swan2012); Chinese Merino (Di et al., Reference Di, Zhang, Tian, Lazate, Liu, Xu, Zhang and Zhang2011); South African Merino (Snyman et al., Reference Sumner and Bigham1996); Spanish Merino (Valera et al., Reference Valera, Arrebola, Juarez and Molina2009). This approach of using increments in age to report production attributes differs from the results of nutritional investigations, where the changes in wool production and wool attributes are related to changes in nutrient availability (Black and Reis, Reference Black, Robards and Thomas1979). Changes in nutrient availability usually result in changes in liveweight, and thus any systematic long-term change in the nutritional status of sheep that affects their liveweight will also affect MFD. For example, the results from numerous investigations into systematic changes in the stocking rate of Merino sheep provide evidence, that where measured, sheep grazed at higher stocking rates had both lower mean liveweight and lower MFD compared with similar sheep grazed at lower stocking rates which had higher mean liveweight and higher MFD (White and McConchie, Reference White and McConchie1976; Black and Reis, Reference Black, Robards and Thomas1979; McGregor, Reference McGregor2010c). Wool sheep breeds, such as the Merino, continue to grow wool when chronically undernourished and losing weight (Standing Committee on Agriculture (SCA), Reference Schmidt-Nielsen1990). Although Allden (Reference Allden1979) reported that wool growth was related to the rate of change in liveweight and to liveweight per se, there was no information regarding MFD.
Wool MFD is reported as being generally phenotypically and genetically positively correlated to liveweight of Merino sheep (Newton Turner and Young, Reference Newton Turner and Young1969; Adams and Cronjé, Reference Adams and Cronjé2003). Across 268 Merino blood lines (genotypes), Martin et al. (Reference Martin, Atkins, Semple, Sladek, Thackeray, Staines, Casey, Graham and Russell2010) reported that for each 1-μm increase in MFD, liveweight increased 1.2%.
With Merino sheep, and other fibre-producing animal, fibres are produced from skin follicles. Skin follicle initiation is completed by about 4 months postpartum. As sheep grow, there are continuing reductions in the density of fibre-producing follicles and this reduction in follicle density is positively correlated with the diameter of wool fibres (Fraser and Short, Reference Fraser and Short1960; Maddocks and Jackson, Reference Maddocks and Jackson1988). It has been accepted that the mechanism for this relationship is that larger animals have larger skin surface areas (Burns, Reference Burns1954) resulting in a decline in the density of skin follicles and less competition between follicles, increasing skin follicle bulb dimensions (Hynd, Reference Hynd1994) and increasing cross-sectional area of fibres. If this was the dominant process then, in line with distances being proportional to the cube root of volumes in similar shapes, it would be expected that MFD would be proportional to the cube root of liveweight. Evidence for such a relationship has been detected in studies with mohair, namely that the diameter of fibres is related to the size of the animal through an allometric relationship (McGregor et al., Reference McGregor, Butler and Ferguson2012). Allometric relationships are widespread in biology (Schmidt-Nielsen, Reference Snyman, Olivier and Olivier1984) and animal production, for example, metabolic activity of mammals is proportional to liveweight0.75.
Thus, the scientific literature does not provide a coherent explanation of the biological driver of changes in MFD. That is, is it age which is the biological determinant, as implied by the reports into the genetics of wool properties, or is it the nutrition of the sheep which is the determinant of fibre diameter, or are the fundamental changes in size of sheep the biological determinant of wool fibre diameter?
This study addresses the issue of determining the primary influences on MFD as sheep age, by allometrically relating MFD to the fleece-free liveweight (FFLwt) of Saxon Merino sheep over 14 periods during their growth from age 1.3 to 4.3 years of age. The present study corrected liveweight for the mass of fleece present at any sampling time. This is not an insignificant correction, as in this study the average greasy fleece weight was 4.48 kg and the average FFLwt at sampling times was 40.1 kg, indicating a correction of up to 11%, and the correction would vary throughout the year as the fleece grew and liveweight varied. Thus, studies which do not correct for the mass of the fleece have a bias, and will be less sensitive to the true effects of animal mass as animals approach the time of shearing. We used restricted maximum likelihood (REML) mixed model analysis to determine how the allometric relationship of MFD with FFLwt differed with period of growth and FFLwt change during each period.
Material and methods
General
Full details relating to the environment, rainfall, pasture composition and management before and during the grazing of the sheep have been previously described (McGregor, Reference McGregor2010a, Reference McGregor2010b and Reference McGregor2010c). In brief, the experiment was conducted at the Animal Research Institute, Werribee, Victoria, 32 km west of Melbourne (144° 41' E, 37° 54'S, elevation 24 m). The climate is of the Mediterranean type with a growing season of 7 months (April to October) and a relatively dry summer.
Data analysed originated from sheep involved in a larger grazing experiment that had a 3×3 factorial design with three grazing systems (GS; sheep, Angora goats, sheep and goats mixed at the ratio 1 : 1); and three stocking rates (7.5, 10 and 12.5 animals/ha) obtained by varying the area of each plot. Each treatment was replicated twice. Each replicate was grazed by 10 animals. This report is only concerned with the wool production from the sheep.
Animal management
Castrated male Saxon Merino sheep (wethers) that were 14 months old and producing superfine wool were shorn immediately before the start of the experiment in August and subsequently shorn at 12-month intervals. During the experimental period, when the mean liveweight of animals in a plot declined as a result of seasonal drought, supplementary feed was provided to maintain liveweight.
All animals were weighed to the nearest 0.5 kg during the 2nd week of every month. Dye-bands (Chapman and Wheeler, Reference Chapman and Wheeler1963) were carefully and precisely applied by one of the authors (B. A. M.) successively to the same wool staples, at skin level on the mid-side site, immediately following particular liveweight measurements. Dye-bands were applied in December, March and June each year, and in the 1st year dye-bands were also applied in October and April. Immediately before shearing, the staples with the dye-banded wool were carefully removed at skin level using small animal clippers. At shearing, fleeces, which included bellies, pieces and crutchings, were weighed to the nearest 50 g.
Seasonal fibre growth rate was determined by the dye-band method (Chapman and Wheeler, Reference Chapman and Wheeler1963). The average fibre growth rate was calculated for each segment for all sheep. Using three staples with dye-bands, a hand-operated guillotine was used to cut 2 mm snippets from individual staples immediately before each dye-band, or at the base of the staple, to sample the wool grown just before the application of the dye-band and before animal liveweight measurement. For each staple segment the snippets were bulked and individually identified. MFD (μm) was determined using the OFDA100 (BSC Electronics, Ardross, Western Australia, Australia; International Wool Textile Organisation, 2005) following scouring, drying and reconditioning at 20°C and 65% relative humidity, and using duplicate counts of 6000 fibre snippets. These dye-banded staple segments provided wool from 14 known time intervals per sheep.
Statistical methods
FFLwt’s were determined for each sheep by subtracting cumulative greasy fleece growth from liveweight recorded immediately before dye-banding. Cumulative greasy fleece growth was determined using segment fibre growth rate and the elapsed number of days for each segment. FFLwt average daily gain (ADG) per day was determined for each segment by dividing the change in FFLwt during the period by the elapsed number of days.
The unit of analysis was each segment for each animal. A parsimonious random coefficient REML regression mixed model was then developed for log10 transformed MFD, as enacted by GenStat 17 (Payne, Reference Payne2014). Separate terms were developed for fixed effects related to FFLwt, ADG, GS, stocking rate and segment, random individual animal effects, random plot effects and random combinations of segment and plot effects. Differences in the random effects associated with fixed effects were modelled using a random coefficient regression approach with correlated regression coefficients. The parsimonious model was developed to account for background sources of variation, using χ 2 change in deviance tests for random effects and Wald F-tests for fixed effects (Payne, Reference Payne2014). No outliers were deleted. Approximate 95% least significant intervals were calculated for the predicted proportionality constant of each segment, using the normal approximation on the logarithmically transformed scale with the least squares method option of the SEDLSI procedure in GenStat (Hannah, Reference Hannah2012), and then back transforming to the coefficient scale.
Results
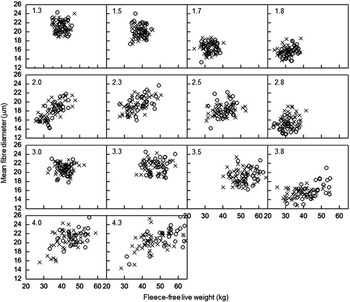
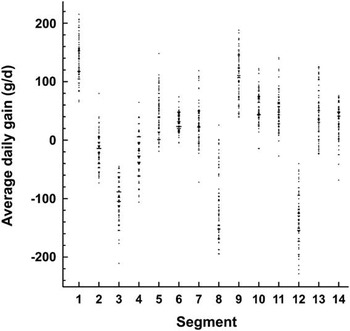
The mean and range in key measurements were as follows: FFLwt, 40.1 (23.1 to 64.1) kg; ADG, 10 (−228 to +216) g/day; greasy fleece weight, 4.48 (2.85 to 7.20) kg; MFD, 18.8 (12.7 to 25.8) μm. The relationship between FFLwt and MFD for each segment is shown in Figure 1. In the sheep only treatment the lowest FFLwt occurred at the end of summer in sheep less than 3 years old (Segments 3, 4, 8). In the sheep only treatment the highest FFLwt occurred in sheep greater than 3 years old. The FFLwt data were clustered for the first 6 months (Segments 1 to 4) until effects of stocking rate treatments occurred, and a similar clustering of FFLwt occurred at the end of the drought period (Segment 9). Otherwise, there was substantial fluctuation within each year, as shown by the changes between each segment (Figure 1) and there was considerable variation in both MFD and FFLwt within each segment, with the variation within each segment increasing as the experiment progressed (Figure 1). Figure 2 shows the large range in ADG in each segment for the sheep only treatment.
The relationship between fleece-free liveweight and mean fibre diameter of wool for each segment and for each grazing system. Numbers on each graph indicate the age in years of sheep at the sampling date. Symbols for grazing system: ×, sheep in sheep only plots; Ο, sheep in mixed grazed plots.

Dot histogram of average daily gain in sheep only plots, for each segment.

Model selection process
The REML model for the logarithm of MFD has four types of terms. These were (a) fixed effects, (b) random terms associated with each combination of plot and segment, (c) random animal effects and (d) random terms associated with each observation (residual error). The three types of random effects were mutually independent.
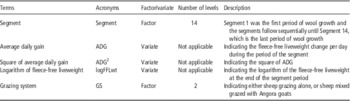
The fixed effects in the model for the logarithm of MFD can be represented as (Tables 1 and 2) α ij +β i ADG+γ i ADG2+δ j log10FFLwt, where α ij is a coefficient that differs with GS and segment, β i and γ i the coefficients that differ with each of the 14 segments, and δ j a coefficient that differs with GS.
Fixed terms in parsimonious restricted maximum likelihood model for the log10 (mean fibre diameter)

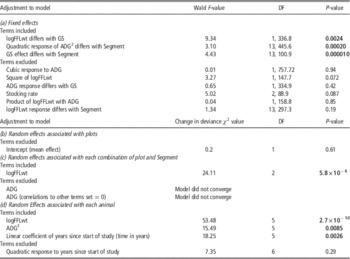
Tests for including and excluding (a) fixed effects, (b) random effects associated with plots, (c) random effects associated with each combination of plot and segment and (d) random effects associated with each animal on predicted wool mean fibre diameter for Saxon Merino sheep

FFLwt=fleece-free liveweight; GS=grazing system; ADG=average daily gain.
P-values in bold are significant at the 5% level.
The random effects associated with each combination of plot and segment can be represented as (Table 2) α+β log10FFLwt; where α and β are correlated random variables that have different values for each combination of plot and segment.
The random individual animal effects can be represented as (Table 2).
α+β 1Time+β 2ADG+β 3ADG2+β 4 log10FFLwt; where α, β 1, β 2, β 3, β 4 are correlated random variables that have different values for each individual animal. Time is a variate representing the number of years since the start of the study.
The random effects associated with each observation (combination of animal and segment) (Table 2) was the residual error.
Allometric response to fleece-free liveweight
Apart from a multiplicative independent error term we can write the response as
 $$\eqalign{ {\rm MFD}\,{\equals}\,\kappa \left( {{\rm GS,}\,A{\rm ,}\,{\rm Segment}{\rm .\,Plot,}\,{\rm Segment,}\,{\rm ADG}} \right)\cr\,\,\,\quad\quad{\times}{\rm FFLwt}^{{\left( {\alpha \left( {{\rm GS}} \right){\plus}\beta \left( A \right){\plus}\gamma \left( {{\rm Segment}{\rm .Plot}} \right)} \right)}} $$
where
 $$\alpha \left( {{\rm GS}} \right)\,{\equals}\,\left\{ {\matrix{\!\! {0.32\left( {{\rm SE}\,{\equals}\,{\rm 0}{\rm .038}} \right)\,{\rm when}\,{\rm sheep}\,{\rm are}\,{\rm grazed}\,{\rm alone}} \hfill \cr \!\!{0.49\left( {{\rm SE}\,{\equals}\,{\rm 0}{\rm .049}} \right)\,{\rm when}\,{\rm sheep}\,{\rm are}\,{\rm mixed}\,{\rm with}\,{\rm goats}} \hfill \cr } } \right.$$
β(A) are separate independent random variables for each animal with SD (β(A))=0.12 (SE=0.004).
γ(Segment.Plot) are separate independent random variables for each plot–segment combination with SD (γ(Segment.Plot))=0.06 (SE=0.001).
κ (GS, A, Segment.Plot, Segment, ADG) is a proportionality constant that depends on grazing system, random animal effects, random segment.plot combination effects, segment and average daily gain.
Proportionality constant and average daily gain
The exponent of FFLwt contains terms for GS, A and Segment.Plot and thus, from the marginality principle, it is reasonable to expect that the proportionality constant will also change with GS, A and Segment.Plot. However, we can still meaningfully examine how the proportionality constant (κ) changes with segment and ADG at a level of GS, and at the expected value (which equals 0) of the random effects of A and Segment.Plot (Figure 3). We only need to examine the relationship with ADG at one level of GS (which we choose to be sheep only) because we have found no interactions between GS and ADG.
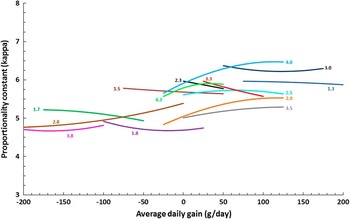
The relationship between the proportionality constant and average daily gain in sheep only plots, for each segment, when the A and Segment.Plot random variables are at their expected values (0). The responses only cover the range of average daily gain observed in sheep only plots of the appropriate segment. The age of sheep in years (range 1.3 to 4.0 years) is shown for each segment.

The relationship differs with segment, although the proportionality constant generally appears to be larger with greater ADG (Figure 3). There is evidence that the relationship differs between segments (e.g. P=0.002, for a difference in quadratic response between segments on the logarithmic scale, see Table 2), but the clarity of the general trend is limited by the relatively low range of ADG between animals within any specific segment. Figure 3 shows the age of the sheep when the MFD was tested. It is clear from Figure 3 that although, at any specified ADG, the proportionality constant systematically differs between segments, these segment differences do not align with a chronological change in age. For instance, at −100 g/day the proportionality constant increases in the order 3.8, 1.8, 2.8 and 1.7 years and at 100 g/day the proportionality constant increases in the order 3.5, 2.0, 3.3, 2.5, 1.3, 3.0 and 4.0 years (Figure 3).
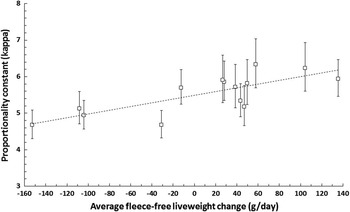
To further clarify the general relationship between the proportionality constant and ADG we calculated the ADG of sheep in sheep only plots for each segment. The predicted proportionality constant at this ADG value was then plotted against the ADG, for each segment (Figure 4). Figure 4 indicates that the proportionality constant increases as the average ADG for a segment increases. The 95% least significant intervals show that the three lowest proportionality constant values (mean κ 4.77, ADG loss 30 to 150 g/day) differ from the proportionality constant values of the three highest ADG (mean κ 6.17, ADG gains 58 to 135 g/day).
The relationship between the proportionality constant at the average daily gain and the average daily gain, for each segment. Average daily gains are calculated using fleece-free liveweight of sheep from sheep only plots. Predicted proportionality constants are calculated for the situation where when the A and Segment.Plot random variables are at their expected values (0). Error bars represent ~95% least significant intervals. The fitted dashed line is a least squares fit to the values in the graph, and is only meant to be used as a guide line in the graph.

Discussion
Relationship of mean fibre diameter to animal size
In sheep only plots, MFD was proportional to the cube root of animal size, as the coefficient α(GS) was 0.32 (SE=0.038). This is a strong response, whereby every 10% increase in FFLwt (e.g. 50 to 55 kg) will be associated with a 3.2% increase in MFD (e.g. 18.0 to 18.6 μm). This response is exactly what would be expected if the mechanism for the relationship between MFD and FFLwt is that changes in skin surface area and the concomitant change in skin follicle density determines the diameter of fibres (Fraser and Short, Reference Fraser and Short1960; Maddocks and Jackson, Reference Maddocks and Jackson1988; Hynd, Reference Hynd1994). Such an allometric response to animal size has also been observed in Angora goats producing mohair (McGregor et al., Reference McGregor, Butler and Ferguson2012) but was not identified in reviews linking wool MFD with liveweight of sheep (Sumner and Bigham, Reference Steel, Symons and Jones1993; Adams and Cronjé, Reference Adams and Cronjé2003).
For sheep in the mixed grazed plots, the response of MFD to animal size was even stronger, with MFD being proportional to the square root of animal size, as the coefficient α(GS) was 0.49 (SE=0.049). Thus, for every 10% increase in FFLwt (e.g. 50 to 55 kg) there will be an associated 4.9% increase in MFD (e.g. 18.0 to 18.9 μm). A response to the square root of animal size indicates that mechanisms in addition to those related to changes in skin surface area and skin follicle density are in play. We regard the increase in the proportionality constant in these mixed grazed sheep to be related to fundamental changes in the nutritional ecology of the sheep and these are discussed in the following section.
Although in the sheep only treatment MFD is generally proportional to the cube root of FFLwt, the response differed greatly between sheep. The between animal SD in the exponent of FFLwt was 0.12. This indicates that a 95% probability interval of the exponent for different sheep was 0.32±0.24, that is 0.08 to 0.56. This indicates that there is a good deal of lifetime variability among animals, and the differences in the response of MFD to FFLwt in different animals, is not entirely related to changes in skin follicle density.
Relationship of mean fibre diameter to nutrition
Generally, the proportionality constant (κ) was much higher when sheep were growing than when they were losing weight (Figures 3, 4). That is, during catabolism, when animals mobilise their tissue reserves, there is possibly an associated effect of reducing MFD as the proportionality constant is lower (Figure 4), perhaps as a consequence of the requirement to maintain critical body and rumen function. The alternative explanation that loss of weight results in a smaller surface area with increased skin follicle density is unlikely because such a response would already be included in the model as a response to FFLwt.
Unfortunately most investigations into the efficiency of nutrient partitioning into wool growth focus on wool mass and omit to report fibre diameter properties (e.g. Black et al., Reference Black and Reis1973; Cronjé and Smuts, Reference Cronjé and Smuts1994; Liu et al., Reference Liu, Mata, O’Donoghue and Masters1998) and so it is not possible to use such data to interpret nutrition effects upon MFD. When nutrition was improved over short periods from below maintenance to above maintenance, Liu et al. (Reference Liu, Mata, O’Donoghue and Masters1998) found an increase in wool protein synthesis, and this increase was associated with an increase in skin protein synthesis but not in the ratio of wool protein: skin protein synthesis, but no data on wool MFD were reported.
In the present study, MFD was generally lower at the end of summer than at other times of the year. However, Figure 3 indicates this can be explained by the lowest FFLwt change occurring at this time, with most animals losing substantial amounts of weight. It has been documented for many years that in Mediterranean type environments, such as that grazed by sheep in the present study, that senescent pastures are deficient in digestible nitrogen and energy (Black and Reis, Reference Black, Robards and Thomas1979; SCA, Reference Schmidt-Nielsen1990).
The result that the allometric coefficient for sheep grazed with goats is about ½ (square root), rather than about 1/3 (cube root), indicates that when the sheep were grazed with goats there was greater partitioning of nutrients towards the cross-sectional growth of wool follicles as liveweight increased. This did not occur with sheep grazed without goats, as the allometric coefficient was 1/3, which is the coefficient that would be expected purely from expansion of the skin surface area. The question which then arises from this investigation is what differences arose between the two GS that may have influenced this substantial difference in the way nutrients were partitioned.
A major difference was that the grazing of goats led to major changes in pasture availability and composition, particularly a higher proportion of legume species (McGregor, Reference McGregor2010a). This change in grazing ecology resulted in a 10% reduction in the time spent grazing (McGregor, unpublished data) and lower levels of gastro-intestinal parasitism, as shown by lower levels of adult nematodes in their gut (McGregor et al., Reference McGregor, Presidente and Campbell2014). Both reduced grazing time and reduced parasitism would lead to lower nutrient expenditure on grazing and resisting these infections (Steel et al., 1980; SCA, Reference Schmidt-Nielsen1990) and therefore more nutrients would be available for production. This result indicates that improving pasture quality may lead to a stronger relationship between the partitioning of nutrients to follicle cross-sectional area as size of animal increases.
Despite a large difference in the relationship between MFD and FFLwt between the two GS, there was no effect of stocking rate on the relationship. While GS affected pasture composition and availability, the effect of stocking rate was mainly on pasture availability with minimal effect on composition (McGregor, Reference McGregor2010a). This indicates that the differences in the relationship between MFD and FFLwt with different pasture resources are not simply related to pasture availability per se.
The result that there was an observed random effect of combinations of plots and segment on the allometric coefficient is evidence that nutritional conditions, which vary with plots at different times, affect nutrient partitioning to follicle cross-sectional area.
Relationship of mean fibre diameter to chronological age of sheep
In our allometric model relating MFD to FFLwt, age of sheep can only be systematically included through the contribution of segment to the proportionality constant (κ) because, except for random effects associated with animal and plot–segment combinations, the allometric coefficient for each of the GS is constant. An examination of the relationship between the proportionality constant and ADG, for each segment (Figure 3), shows that there is no clear systematic effect of chronological increases in age on the proportionality constant. This is irrespective of whether ADG is taken into account or not (Figure 3). The implication is that, even after accounting for all the variation due to FFLwt and ADG, chronological age was not a determinant of wool fibre diameter. This result is despite the animals being observed from 1 year old to near mature adult size (4 years old).
In many studies, MFD has been reported to increase as sheep age (Newton Turner and Young, Reference Newton Turner and Young1969; Hill et al., Reference Hill, Ponzoni and James1999; Fozi et al., Reference Fozi, van der Werf and Swan2012). Our results indicate that FFLwt is a determinant of MFD and chronological age is not a major determinant of MFD. This suggests that the reported increase in MFD as sheep age may be a consequence of better than maintenance nutrition resulting in increasing FFLwt (i.e. growth) with chronological age.
Individual animal variation in mean fibre diameter
The component of the model related to individual animal effects on the proportionality constant has major implications for the way the variability in MFD between animals changes as those animals age. This is an important issue for the wool industry in its own right. For the purposes of this report, its inclusion in the model is primarily a way of appropriately describing the correlation structure so that the allometric aspects of the model are correctly quantified and that statistical analysis is valid.
Implications
It appears that the primary mechanism that MFD is positively related to FFLwt is via changes in skin surface area and concomitant changes in skin follicle density, that is, via the allometric coefficient of 1/3 (cube root). In such cases, this is in accord with the allocation of nutrients to follicle cross-sectional area being proportional to the increase in skin surface area arising from changes in the size of the animal. Thus, fibre diameter changes in a ‘proportionate’ manner to the size of the animal.
However, this allometric coefficient varies substantially with individual sheep, and also with the environment of the sheep (e.g. GS and plots at different occasions). When this occurs, nutrients are preferentially partitioned towards follicle cross-sectional growth when the allometric coefficient is >1/3, and are preferentially partitioned away from follicle cross-sectional growth when the allometric coefficient is <1/3. Although in virtually all cases the allometric coefficient appears to be positive, and thus MFD will increase with FFLwt, the preferential partitioning towards or away from follicle cross-sectional growth can be substantial. For instance, in sheep only grazing, we estimate that the allometric coefficient varies from 0.08 to 0.56. When the value is 0.08, every 10% increase in FFLwt, for example, 50 to 55 kg FFLwt, will be associated with a 0.8% increase in MFD, for example, 18.0 to 18.1 μm, whereas when the value is 0.56, every 10% increase in FFLwt will be associated with a 5.6% increase in MFD, for example, 18.0 to 19.0 μm. Although the allometric coefficient varies with individual and environment, it does not appear to systematically vary with chronological age of the sheep, quantity of feed available (stocking rate) or ADG of individual sheep.
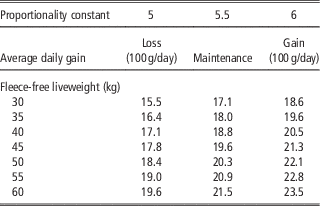
Nevertheless, the proportionality constant changed substantially with ADG. When losing weight (−100 g/day), the proportionality constant is about 5, whereas gaining weight (+100 g/day) is about 6 (Figure 4). For a 50 kg sheep without any preferential partitioning towards or away from follicle cross-sectional area, that is the allometric coefficient=1/3, when ADG =−100 g/day, MFD=18.4 μm but when ADG=+100 g/day, MFD=22.1 μm (Table 3). The effect on MFD of varying FFLwt from 30 to 60 kg upon MFD (change 4.1 to 4.9 μm) is greater than varying ADG from −100 to +100 g/day upon MFD (change 3.1 to 3.9 μm, Table 3). In practice, a sheep which loses weight during summer, to reach a FFLwt of 35 kg and then grows during winter and spring to a FFLwt of 55 kg will grow wool with MFD varying from 16.4 to 22.8 μm (Table 3).
The effect of different proportionality constants related to average daily gain on predicted wool mean fibre diameter (μm) for Saxon Merino sheep of different fleece-free liveweight when the allometric coefficient is 1/3

The environments traditionally used to graze Merino sheep for superfine wool production have been those which have a consistent but low level of nutrition which maintains the sheep throughout the year (e.g. rangelands in central Spain, cold rain shadow regions of Australia (e.g. central Tasmania, Victoria Valley in western Victoria, Monaro plains in New South Wales), subalpine native pastures in New Zealand). This is usually obtained through the maintenance of natural pastures with minimal or no use of artificial fertilisers and introduced pasture species. There has been criticism of this type of management in many Australian scientific and economic circles because the traditional practice limits the quantity of wool produced (Alexander and Williams, Reference Alexander and Williams1973). However, the results of the present work indicate that this traditional management approach is sensible for producers that aim to produce a consistent high-quality product (low MFD, uniform fibre diameter along the fibre, high staple strength). In this approach, keeping nutrition consistent maintains FFLwt and avoids increasing MFD over time. This consistent diameter along the fibre will maximise staple strength (Collins and Chaikin, Reference Collins and Chaikin1968).
The practice of reporting that MFD of wool increases as sheep age requires examination. The only fixed effect term in our model that could be proxy for age of sheep is the segment effect in the proportionality constant. However, although the proportionality constant systematically varies between segment, the segment differences do not align with a chronological change with age (Figure 3). A consequence is that if animals were managed to maintain a near constant FFLwt during their adult life, then an increase in MFD with age would not be expected.
As indicated above, the allometric coefficient relating MFD to FFLwt varies substantially between individual sheep. This indicates that comparing MFD between sheep is more likely to have an important biological basis when standardised to a common FFLwt than when just standardised to a common age, as is the common practice. For instance, the result suggests that it may be preferable to look for genes that regulate biological processes associated with allometric relationships rather than genes associated with just the physical dimension of wool at a common age.
Acknowledgements
Financial support for the grazing study was provided by the then Victorian Department of Agriculture and the Rural Credits Development Fund. Former colleagues from the Ruminant Nutrition Department, Werribee and the Fibre Quality Department, Attwood are thanked for their assistance.