


Introduction
The threat posed by climate change, due to the disruption of the planet’s natural balance,Reference Crutzen and Stoermer1 represents an unprecedented challenge for humanity, particularly in the context of climate-related disasters,2 creating scenarios demanding new preventive measures. The increasing frequency and intensity of these disasters worldwide have led to growing interest in disaster risk assessment. According to the World Risk Report 2024, extreme natural phenomena, pandemics, and conflicts are increasingly interconnected and amplify each other, exacerbating poverty and social inequality worldwide.3
Climate-related disasters also represent a major global economic challenge,Reference Pelling4 especially in developing countries where governments often lack the resources to respond effectively. States now face a disaster landscape marked by a sustained increase in recurrence and probability,Reference Cardona, Brauch, Oswald Spring and Mesjasz5 requiring more precise monitoring and management. It is essential to use available knowledge and technology to manage disasters effectively. Technology has become a key ally.Reference Birkmann6
The American continent is particularly exposed to natural hazards, with 7,398 such events recorded between 2000 and 2021, mainly hydrological, meteorological, and climatological.Reference Fernandez-Garcia, Gan Rick and Cernuda-Martinez7 In Chile, 2010-2024 records from the United Nations Office for Disaster Risk Reduction (UNDRR) and the National Disaster Prevention and Response Service (SENAPRED) document multiple disasters. SENAPRED emphasizes that the social impact and lack of resilient infrastructure highlight the need to strengthen early warning systems and coastal planning.8
According to the National Office of Emergency (ONEMI), the region’s vulnerability and fragile infrastructure show the importance of risk assessment to identify weaknesses before disasters occur.Reference Wisner, Blaikie, Cannon and Davis9 The objective of this study is to propose a methodological approach for disaster risk calculation and assessment using open-source information and to demonstrate its application in Coquimbo, Chile.
Methods
Conceptual Framework
To operationalize the disaster risk assessment, a structured framework was used based on a conceptual model aligned with the models promoted by the UNDRR10 and various authors such as Wisner, Blaikie, Cannon, and DavisReference Wisner, Blaikie, Cannon and Davis9:
 $$ RD=f\left(A,\mathit{\operatorname{Re}},E\right) $$
Where RD is the Disaster Risk, A is the Hazard (probability of the event occurring), Re is the resilience factor, and E is the Exposure, which quantifies the elements at risk (infrastructure, properties, people) that could be affected by the disaster. The weights for each index were based on expert judgment and bibliographic review, considering a Likert scale for the quantitative interpretation of the qualitative estimate. Data layers from SENAPRED, extracted from its GIS tools with historical data, were used, along with datasets requested by the Municipality from primary response institutions (Health, Fire, Police) and data from the Territorial planning project for risk management (PROTEGER)11.
Hazard
According to the terminology of the UNDRR, a hazard refers to a process, phenomenon, or human activity that may cause loss of life, injury, property damage, social and economic disruption, or environmental degradation. Hazards are commonly characterized by attributes such as location, intensity, frequency, and probability. In disaster risk research, hazard is frequently modeled as the probability of occurrence of damaging events over time.
In this study, hazard assessment considers the historical frequency and intensity of events occurring within the community. Historical disaster records were compiled and analyzed to estimate the probability of occurrence of hazardous events over time, allowing a probabilistic representation of disaster likelihood in the study area. The hazard factor is therefore defined as:
 $$ A={P}_t(x) $$
Where Pt (x) represents the probability of occurrence (P) of a specific hazardous event (x) in a given unit of time (t). The calculation of the average annual frequency is a simple metric, which is an estimate of how many natural disasters occur on average each yearReference Smith and Petley12
 $$ {F}_{mean}=\frac{N}{T} $$
where F mean is the frequency or recurrence of the disaster; N is the number of recorded events; and T is the total number of years considered. Under this approach, historical frequency is used as an approximation of the probability of occurrence:
 $$ F\approx {P}_t(E) $$
There are more advanced statistical methods to delve deeper into the calculation with greater precision; however, given the magnitude and focus of the study, they are excluded.
Resilience
Resilience refers to the capacity of a community to anticipate, withstand, adapt to, and recover from disasters through the balance between its vulnerabilities and its available capacities within a given socioeconomic, structural, and cultural context. It is defined as an adaptive process that allows communities not only to resist and recover from disasters, but also to improve their structures, systems, and capabilities in the face of future threats.Reference Norris, Stevens, Pfefferbaum and Wyche13 In this study, resilience is operationalized as the balance between vulnerability factors and community capacities. This relationship is expressed through the following equation:
 $$ \mathit{\operatorname{Re}}={\sum}_i\frac{f\left({V}_i\right)}{V_{max}}-{\sum}_j\frac{f\left({C}_j\right)}{C_{max}} $$
where
 $ {V}_i $
represents the vulnerability factors (i) assessed;
 $ f\left({V}_i\right) $
is the weighted contribution of the factors;
 $ {V}_{max} $
is the maximum score of the sum of vulnerability variables;
 $ {C}_j $
represents the capacity factors (j) assessed;
 $ f\left({C}_j\right) $
is the weighted contribution of the capacity factors; and
 $ {C}_{max} $
is the maximum score of the sum of capacity variables. A higher resilience factor indicates that vulnerabilities are not offset by community capacities. A lower resilience factor means that community capacities reduce the fragility of their vulnerabilities. Capacity and vulnerability factors are quantified between 0 and 1. To maintain analytical balance in the model, the number of vulnerability variables cannot exceed the number of capacity variables, ensuring proportional weighting in the resilience calculation.
 $$ N{}^{\circ}{V}_i>N{}^{\circ}{C}_j $$
If the sum of capacity evaluation is numerically greater than vulnerabilities (negative Re factor), a minimum quantification criterion is used, adjusting Re to 0.01. This ensures a baseline level of exposure that helps prevent underestimation of risk (such as the false assumption of zero risk), maintains the operability of the model (as even in areas with minimal exposure, the risk does not completely disappear from the analysis, thus preserving the model’s sensitivity), and acknowledges latent risks even in seemingly empty zones (such as areas with low population density or infrastructure that still present exposure). This adjustment criterion is incorporated into the model to preserve analytical stability and prevent unrealistic zero-risk estimations.
This conceptualization aligns with the resilience approaches proposed in disaster risk frameworks such as the WorldRiskIndex, where resilience arises from the interaction between vulnerability and capacity factors.3
Exposure
Exposure analysis allows for the identification and quantification of community elements at risk (population, buildings, infrastructure, supplies, productivity, etc.). It is an absolute value that can be obtained from census and geographic data.Reference Wisner, Blaikie, Cannon and Davis9
 $$ E={\sum}_k{E}_k $$
where Ek represents the community’s exposed elements (k) and their monetary magnitude; k can take various values. For the present study, it is associated with public infrastructure.
In summary, the equation used to calculate the disaster risk estimate is:
 $$ RD={P}_t(x)\ast \left[{\sum}_i\frac{f\left({V}_i\right)}{V_{max}}-{\sum}_j\frac{f\left({C}_j\right)}{C_{max}}\right]\ast {\sum}_k{E}_k $$
This equation aligns with the holistic disaster risk approach as defined by CardonaReference Cardona, Brauch, Oswald Spring and Mesjasz5 considering that risk is a function of hazard, vulnerability, and exposure, but it must also consider the adaptive or response capacity of communities. It also corresponds with the analytical framework proposed by UNDRR, which states that disaster risk arises from the interaction between hazards, vulnerability conditions, response capacity, and exposed elements.
This methodological proposal consists of a series of sequential steps and a guiding algorithm for implementing the assessment based on the community’s reality and context. The case study reviews the major events that occurred in the municipality of Coquimbo between 2020 and 2024. The proposal is based on seven steps for conducting a disaster risk assessment, as detailed in Figure 1.
Methodological framework of the 7 steps or phases followed in the disaster risk assessment. Source: Prepared by the Author, 2024.

Operational Steps
Step 1: Definition of Sectorization
Sectorization allows for a more specific and personalized geographic approach to local needs, improving the effectiveness of interventions and the resilience of communities to disasters.Reference Lavell14 Two key aspects of sectorization are defining the smallest viable sectoral unit and considering an official, publicly known definition. In this study, the Neighborhood Units (UV) of the Coquimbo commune (Figure 2) are used as a reference, as indicated in Exempt Decree No. 2328,15 which defines administrative boundaries based on neighborhood groups. The original alphanumeric assignments were maintained for correct identification, and the “Sector” attribute used in the Communal Development Plan 2019-202316 (PLADECO) was incorporated.
Sectorization of the Coquimbo commune according to the Communal Development Plan 2019-2023 and UV designations. Source: Prepared by the Author, 2024.

Step 2: Identification of Threats
Correctly identifying community hazards allows for the establishment of a hazard and/or danger inventory. These inventories are essential tools for identifying and managing natural and anthropogenic hazards and serve as the basis for disaster adaptation and resilience strategies in the context of climate change and urbanization.Reference Pelling17 For the study, the average recurrence of events is annualized for simplicity. Disaster frequency is applied as a relative probability in the operation.
Step 3: Review of Recurrence
The recurrence of an event provides clarity on the impacts to which the community has been exposed and allows for projecting preparedness periods, taking into account lessons learned from past events and the community’s historical memory. Depending on the characteristics of the UV, the assessment provides potential impacts and, therefore, a first step in prioritizing preventive, reactive, and corrective resource planning to integrate them into resource allocation plans and state strategic approaches to civil protection.
Step 4: Analysis of Resilience
Vulnerabilities are determined by variables that depend on the natural characteristics of the territory and the sociocultural factors of the community context. In the study, coastal and mountainous areas present favorable scenarios for the development of these vulnerabilities. Community capacities represent the possibilities and strengths to cope with disaster situations using the community’s own resources.
Based on scientific studies and community knowledge of the area, 6 vulnerability variables and five capacity variables have been established to determine the concept of resilience for each UV. These criteria are consistent with widely used disaster-risk frameworks that conceptualize resilience as the interaction between vulnerability conditions and response capacities within a given territory, including the conceptual approaches promoted by the UNDRR, the WorldRiskIndex framework, and the social vulnerability models proposed by Cutter and Wisner. The vulnerability variables are: Socioeconomic Vulnerability (V1); Infrastructure Vulnerability (V2); Preparedness Vulnerability (V3); Geographical Vulnerability (V4); Connectivity Vulnerability (V5); and Climatic Vulnerability (V6). The five capacity variables are: Construction Capacity (C1); Response Capacity (C2); Community Management Capacity (C3); Resource Capacity (C4); and Cultural Capacity (C5).
The variables determined represent the i-th component of the vulnerability factors and the j-th component of the capacity factors, which together form the sums of the factors f(Vi) and f(Cj), contributing to the calculation of resilience. Based on an in-depth analysis of variables, an evaluation scale is established. Five measurement intervals are defined with their proportionalities (Table 1). The qualitative transformation is based on a Likert scale, considering that vulnerability increases risk and capacity decreases it.
Quantitative and qualitative integration scale for the analysis of vulnerability and capacity variables

Source: Prepared by the Author.
The study also assessed the presence of primary care capacity in each UV: health, fire, and police, as these are key elements of community resilience. The area’s disaster prevention protocols and systems were also studied, including drills, evacuation routes, availability of early warning systems, and educational or community engagement plans.
Step 5: Estimation of Exposure
Community exposure not only reflects damage to people, the environment, and available resources. The economic impact is also relevant to physical infrastructure, which forms the foundation upon which people conduct most of their activities. Critical public infrastructure, such as hospitals, schools, and transportation networks, is essential for community resilience to disasters. Critical infrastructure is the backbone upon which response and recovery capabilities are built.Reference Cutter, Boruff, Shirley and Turner18 If these systems fail, recovery time is prolonged and damage can be catastrophic.
In this study, we will consider the magnitude of exposure as the value of public infrastructure. k-th variables can be incorporated into the exposure calculation factor based on available data. We will use the approximate surface area of public infrastructure by UV as a reference, considering the following factors: I1—Surface Area of Public Buildings (200,000 CLP/m2); I2—Surface Area of Public Land (10,000 CLP/m2); and I3—Surface Area of Public Roads (75,000 CLP/m2). The equation is as follows:
 $$ E=\left[I1+I2+I3\right] \ast {UV}_{IP} $$
where E is the Exposure; components I1, I2, and I3 are already detailed; and UVIP is the surface of public infrastructure recorded by the UV according to state sources.
The reference values per square meter used are estimates from the Internal Revenue Service (SII)19 according to its report on fiscal appraisal values for public and private properties in Chile, the Conservator of Real Estate20 with its registry of fiscal and private properties, and the Ministry of Public Works (MOP)21 in its report on road infrastructure costs in Chile.
Step 6: Calculation of Risk Estimate
The study considers the quantification of risk for each inventoried threat. The simplified equation considers multiplying the results of the recurrence indicator, resilience, and exposure for each UV and each threat (RD = A × Re × E). The base UV segmentation will consider 30 areas, and the threat inventory will consist of 5 hazards. The resulting output will generate a matrix of 150 evaluations with individual results for each UV and each type of threat. Additionally, the impact expressed according to the exposed public infrastructure will be represented in millions of Chilean pesos (MM$).
Step 7: Prioritization
The strategy of the national disaster risk reduction policy, in its 2020-2023 strategic plan,22 states that actions to prevent new risk scenarios and mitigate existing ones must prioritize the protection of life and integrity of people, and promote self- and mutual assurance as a contribution to a more resilient, inclusive, and supportive society.
There are several ways to interpret the results and obtain a prioritization criterion, for example, by generating a vector segmentation that allows for comparison of each component evaluated. Prioritization is suggested by considering approaches such as the level of economic impact, the vulnerability index, or the specific frequency of disaster occurrence in relation to the impact on the assessed areas.
Technologies for Disaster Risk Management
The study used technological tools such as Geolocation, Web Services, and QR Codes. Geolocated maps enhance spatial understanding of risk and identification of vulnerable areas in real time.Reference Birkmann6 In this study, .kmz files with geolocated data layers were created and displayed on Google My Maps for visualization and sharing. The real-time visualization tools help prioritize actions during disastersReference Cutter, Boruff, Shirley and Turner18; therefore, results were published on Google Sites for easy online access. QR codes enable offline access to linked maps and databases, crucial in areas with limited telecommunications.Reference Ramsden and Jordan23
Results
Using the 7-step methodology, 30 zones were established to be assessed using the threat inventory, the resilience factor, and their exposure to determine the risk level.
Threats and Recurrence
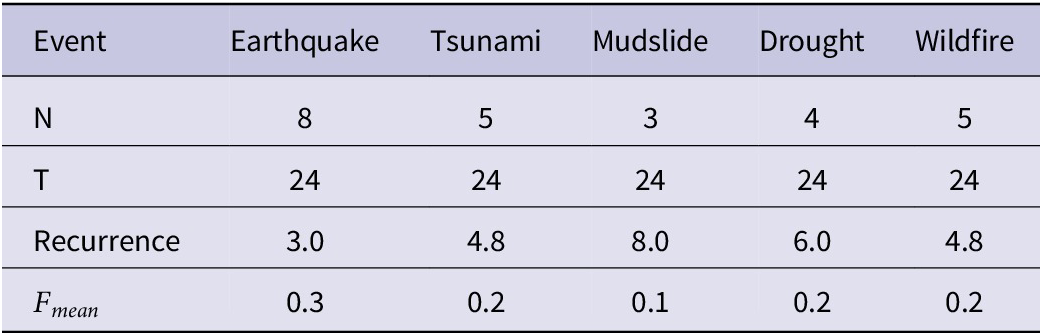
The threats that make up Coquimbo’s risk profile are earthquakes, tsunamis, and floods, according to the technical report PROTEGER and the Risk-Based Study of the Communal Regulatory Plan.24 The threat of forest fires is included since between 2017 and 2022, the Region suffered an average of 66.4 fires that affected 712.55 hectares.25 The threat of drought was also identified due to the decrease in rainfall in the Coquimbo Region since the last century.26 Table 2 provides a 24-year recurrence analysis.
Recurrence and average frequency of the Coquimbo threat inventory

Source: Prepared by the Authors.
Vulnerability Profile
Wildfires
A study conducted by the Coquimbo Region Forest Fire Protection Department in 202225 details the updated risk sectors, identifying 28 sectors with potential risk based on fire use, microdischarges, and urban expansion. The high-risk sectors are UV20 Pan de Azúcar, UV24 El Sauce, and UV28 Guanaqueros.
Droughts
In July 2022, the General Directorate of Water (Decree 109)Reference de Chile. Decreto Exento No27 declared Coquimbo a water scarcity zone. During 2023, the Center for Advanced Studies in Arid Zones (CEAZA) reported in its Climate Bulletin that the rainfall deficit reached 77%, which is 100 mm less than the climatological average recorded for the area.28 This impacts agricultural areas such as UV20 Pan de Azúcar, where recurring droughts have intensified the population’s economic vulnerability. Rural areas such as UV28 Guanaqueros and UV29-UV30 Tongoy are also severely affected due to their dependence on water resources. According to data from CEAZA and SENAPRED, these rural areas have recorded lower precipitation levels than urban areas.
Earthquakes
Coastal residential areas increase exposure to seismic risk, which can even trigger a tsunami. Urbanization in areas such as UV05 Baquedano and UV17-UV18 Tierras Blancas increases vulnerability due to high population density and nonseismic-resistant buildings (poorer areas). Areas such as UV01 Parte Alta, UV05 Puerto, and UV28 Guanaqueros are vulnerable due to their older buildings, the materials used in their construction, and their proximity to the ocean. UV20 Pan de Azúcar, being a rural area, has less robust infrastructure and lower seismic building regulations, making it vulnerable to earthquakes. Its distance from urban centers hampers rapid emergency response.
Evacuation and response preparedness in areas with low community organization increases vulnerability. Improvements in building codes and the implementation of early warning systems in areas such as UV06 Sindempart have reduced the risk (observed in drills conducted by the PROTEGER project).
Tsunamis
Coquimbo is highly vulnerable to tsunamis due to the presence of densely populated areas along its coast. SENAPRED, PROTEGER, and the Founded Risk Study recognize areas susceptible to tsunami flooding in coastal towns (UV28 Guanaqueros, UV29-UV30 Tongoy). The O’Higgins Park area, the bus terminal, and the Coquimbo city seaport (UV05 Centro Baquedano) are built on landfill sites, where historically there was a lagoon of water that flooded permanently, making the area highly susceptible to storm surge and tsunami flooding. Before the construction of the seawall, the coastline had water throughout the winter as it was a wetland (UV12 El Culebrón, UV15 La Herradura), similar to those still seen today between Tongoy and Puerto Aldea (UV28 Guanaqueros, UV29 and UV30 Tongoy).
The central area of UV05 Baquedano floods due to storm surges, as does the pedestrian bridge crossing the Tongoy stream in UV30 Tongoy. UV13 Guayacán is highly susceptible to tsunamis according to SHOA and ONEMI,28 but the coast is not occupied by residential areas. In UV28 Guanaqueros, a large portion of the residential areas are built in tsunami-prone areas, as is the case in Puerto Aldea (UV28 Guanaqueros).
Mudslides
Coquimbo has experienced landslides exacerbated by climatic and geographic factors, as well as soil saturation. These events primarily affect steep slopes near rivers and ravines, generating a high risk for exposed communities, intensified by population expansion. Areas such as Quebrada de Camarones UV23 Rinconada and UV31 Las Cardas are the most prone to landslides during intense rainfall. Unplanned urban growth near ravines, such as UV17 Tierras Blancas Nororiente and UV16 San Juan, increases the risk, aggravated by poor drainage infrastructure. The Cruz de Caña basin, east of UV20 Pan de Azúcar, has experienced historic flooding.
According to SERNAGEOMIN, a 2011 flood at the Coquimbo Hospital revealed the fragility of the infrastructure. The PROTEGER project emphasizes strengthening prevention capacity, given that most buildings date from 1980 to 2000.
Vulnerabilities and Capacities
The analysis reveals that UV12 El Culebrón, UV17, UV18 Tierras Blancas Nororiente, and Norponiente are more vulnerable due to their high socioeconomic exposure and lack of preparedness, connectivity, and climate factors. UV05 Baquedano faces serious infrastructure problems and socioeconomic conditions, presenting high vulnerability. UV06 Sindempart, UV10 El Llano, and UV15 La Herradura have more robust infrastructure and better preparation, which reduces their vulnerability (details in Table 3).
Vulnerability and capacity analysis of the neighborhood units of the Coquimbo commune

Source: Prepared by the Author.
In terms of capacity, UV12 El Culebrón, UV17, and UV18 Tierras Blancas Nororiente and Norponiente have the most limited capacities, with poor infrastructure, scarce resources, and weak community organization. These are high-priority areas. On the other hand, UV06 Sindempart Nororiente, UV07 Sindempart Surponiente, UV10 El Llano, and UV15 La Herradura have greater capacities, with more robust infrastructure and solid community management that allow them to cope with disasters with greater solvency.
The results of the resilience factor assessment can be easily communicated to authorities and the community using GIS tools and data layers (Figure 3).
Geolocated map of the UV Re factor assessment. Source: Prepared by the Authors, 2024.

Exposure and Risk Calculation
A matrix of 150 assessments is generated for the 30 UVs, the 5 types of threats, and the impact on exposed public infrastructure. In Coquimbo, the coastal areas UV13 Guayacán and UV05 Baquedano (with much of the public infrastructure) are most exposed to phenomena such as tsunamis and earthquakes, which could collapse hospitals and evacuation routes, affecting thousands of people. Highly vulnerable areas, such as UV17-UV18 Tierras Blancas, which lack infrastructure designed to withstand major disasters, could suffer serious consequences (details in Table 4).
Estimate of monetary impact according to the risk level and its public infrastructure for each UV

Source: Prepared by the Authors.
Limitations
The research includes general criteria that assume the subjectivity of the experts who carried out the intervention through evaluations derived from specific research focuses for the analysis of the zones. For this reason, an evaluation using the Likert method is included. The information obtained is the result of a long process of collecting open sources; therefore, the results could achieve greater accuracy if such information were provided directly by the institutions responsible for managing it. In addition, the study considers past history as fundamental; however, it recognizes the significant analytical potential of incorporating projective and predictive analysis in a future study.
Discussion
The proposed framework was designed to be adaptable to different territorial contexts. The methodological structure remains constant (hazard, resilience, exposure), while the specific variables and spatial units can be adjusted according to local administrative divisions, data availability, and dominant hazard profiles. This flexibility allows the model to be applied in municipalities, districts, or regions with different institutional structures and risk configurations.
Reducing disaster risk requires coordinated action among local authorities, SENAPRED, technical agencies, the private sector, and communities, with plans updated every 3-5 years. Proper use of technology can strengthen resilience and improve decision-making, while this open-data approach can be replicated globally to support adaptive, evidence-based risk management.
Many disaster-risk models fail to reflect local realities and social vulnerabilities, complicating standardized assessments. In Chile, the lack of unified disaster databases and the use of separate systems by firefighters, police, and health services limit accurate event measurement. Limited technological literacy and weak system maintenance also reduce the effectiveness of tools such as Chile Preparado, while weak territorial planning encourages unregulated expansion. The proposed methodology addresses these gaps through a structured and adaptable framework based on resilience, exposure, and hazard probability, enabling clearer prioritization of public actions and stronger community protection.
Conclusions
The proposed methodology based on open-source data proves effective for disaster-risk assessment, as demonstrated in Coquimbo. Its reliability depends on the quality and updating of data, institutional coordination, and community participation. The analysis identified earthquakes as the main threat (≈30% annual probability) and revealed significant disparities among sectors: UV17 Tierras Blancas Nororiente shows the highest exposure; UV06 Sindempart, UV07 Sindempart Surponiente, UV10 El Llano, and UV15 La Herradura exhibit greater capacities, while UV12 El Culebrón, UV17, and UV18 remain the most vulnerable due to socioeconomic and infrastructural deficiencies. Coquimbo’s coastal urbanization, landfilling, and expansion into high-risk zones increase exposure and complexity.
Capacity Profile
The synergy of primary care institutions (health, firefighters, and police) is vital for response capacity in each UV. Resources are limited, so their activation depends on authority prioritization and community visibility of needs. In Chile, Municipalities coordinate these organizations through the Disaster Risk Management Committee (COGRID). Despite this framework, they lack a unified data system, as each entity applies its own criteria for sectorization and event recording. This fragmentation weakens coordinated management. Across 30 UVs, there are 30 health centers, 12 firefighting units, and only 9 police units to address all emergencies.
Prevention System
SENAPRED has led prevention improvements in Coquimbo, implementing drills, evacuation routes, and early warning systems. After the 2015 earthquake, the installation of coastal sirens significantly reduced potential tsunami casualties.Reference Fritz, Petroff and Catalán30 Measures in UV05 Baquedano and other coastal sectors improved response capacity, though older structures remain vulnerable. Warning systems in UV29 Tongoy and UV28 Guanaqueros allow timely evacuation, reducing impacts.Reference Cardona, Brauch, Oswald Spring and Mesjasz5
Community organization is another key capacity, essential for communication and coordination. Participation in drills and training has reduced risk in areas such as UV15 La Herradura, where social cohesion supports efficient tsunami response.2 Conversely, dispersed populations and scarce resources hinder networks in rural sectorsReference Cardona, Brauch, Oswald Spring and Mesjasz5 like UV20 Pan de Azúcar. Strengthening preventive culture and training local authorities is therefore crucial. According to the municipal cultural plan (2023-2026)31 and SINIM,32 Coquimbo has 1,556 legally active organizations, including neighborhood and cultural associations that promote microlearning and preparedness.
Education also contributes to prevention. Awareness programs in Guayacán (UV13) have improved community preparedness,2 demonstrating the value of integrating disaster education into local curricula.
Sectoral Resources
Coquimbo presents economic and educational disparities among UVs, creating barriers between social strata. According to the municipal plan, 94.2% of inhabitants live in urban and 5.8% in rural areas, with UV20 Pan de Azúcar having the largest rural population. UV15 La Herradura and UV06 Sindempart show higher per capita incomes (over $600,000 per household) while UV20 Pan de Azúcar and UV24 El Sauce average below $350,000.33 Lower rural incomes relate to limited formal employment and weak economic diversification.34 SENAPRED8 highlights the lack of financial resources in UV12 El Culebrón, where precarious buildings and limited early warning systems heighten vulnerability. According to CEAZA,29 investments in infrastructure and insurance have improved resilience in UV06 Sindempart, enhancing response capacity.
Education strongly influences income. WisnerReference Wisner, Blaikie, Cannon and Davis9 identifies it as key to reducing socioeconomic vulnerability by facilitating access to stable jobs. UVs with greater educational attainment, such as UV06 Sindempart and UV15 La Herradura, have better economic indicators and higher university access rates (over 20%).33 In contrast, rural UV20 Pan de Azúcar reaches only 8% due to fewer institutions and distance from cities. PNUD2 confirms that educational level determines entry into the formal labor market, explaining economic disparities. In UV17–UV18 Tierras Blancas, lower education limits employment and income.
Most disaster-risk models fail to capture local realities or social vulnerabilities, complicating standardized field assessments. In Chile, the absence of unified disaster data and the use of separate systems by agencies such as firefighters, police, and health services hinder accurate event measurement. Limited technological literacy and weak maintenance reduce the impact of tools like Chile Prepared, while weak planning perpetuates unregulated expansion. The proposed methodology addresses these gaps by providing a structured, adaptable framework for disaster-risk assessment based on resilience, exposure, and hazard probability, enabling more precise state prioritization and community protection.
Author contribution
-
• Cristóbal Trigo: Conceptualization, methodology, data curation, formal analysis, writing—original draft, visualization, and project administration.
-
• Pedro Arcos: Supervision, writing—review and editing, validation, and methodological guidance.
Competing interests
The authors declare that they have no known competing financial interests or personal relationships that could have appeared to influence the work reported in this paper. All authors have read and approved the final version of the manuscript and agree with its submission to Cambridge Disaster Medicine and Public Health Preparedness. The research was conducted independently, without financial support or sponsorship from any institution or organization that could benefit from its results.




 Open access

