Introduction
The olive tree crop extends from the Mediterranean Basin where it was first introduced into cultivation more than 3000 years ago, to countries as far away as Australia, North America, Chile and Argentina. Traditional olive orchards, with an average density of less than 100 trees ha−1, were designed when manual work was the only known system to carry out the necessary crop operations. In this sense, manual harvesting of the olive is the most expensive task to perform. Being still practiced in many farms, it is still a major source of employment and income for many people during the 2–3 months harvesting period (Rallo et al., Reference Rallo, Barranco, Castro-García, Connor, Gómez del Campo and Rallo2013). However, nowadays those systems are evolving. Fast and efficient machinery becomes essential to achieve economical, food safety and environmental viability in the production of high quality olive oil as well as table olives.
More than 40 years ago, trunk shakers were the first machines used for harvesting of traditional olive groves. They are still being used despite problems associated with separation of the cambium (stripping bark) at the attachment point of the clamp to the trunk, and/or dislodging of roots, both of which may reduce tree longevity (Lavee, Reference Lavee2010).
Today, the first criterion in the design of new olive groves is facilitating mechanized harvesting. Orchards are configured by hedgerows at High-Density (HD), 250–400 trees ha−1 or Super-High-Density (SHD), 1500–2200 trees ha−1, well suited for using straddle harvesters. These machines work over-the-row by continuously beating the tree canopy where most of the fruits are concentrated (Tous et al., Reference Tous, Romero and Hermoso2010). The mechanical energy applied to the canopy transmits to the fruit causing its detachment.
Fruit detachment and tree damage depends on the amount of shaking/beating energy transferred to the tree limbs by the harvester. The more energy transferred, the more fruit removed; however, more energy may also result in more tree damage (Gupta et al., Reference Gupta, Ehsani and Kim2016). Fruit removal force depends on cultivar and stage of maturity (Barranco et al., Reference Barranco, de Toro, Oriq and Rapoport2002) but is fairly high (2–12 N g−1) (Camposeo et al., Reference Camposeo, Vivaldi and Gattullo2013). Such force increases the risk of trunk, branch, and fruit damage that may also reduce oil quality (Connors et al., Reference Connor, Gómez-del-Campo, Rousseaux and Searles2014).
Most of the evaluation and comparative studies on olive harvesters include a quantification of damage caused to the trees using a direct visual evaluation of stripping bark or broken branches (Ravetti, Reference Ravetti2008), with the consequent consumption of time and effort. Therefore, a more efficient contactless automated system, to quantify the harvester-induced damages to the tree on-the-go, is necessary.
Many different applications of ground-based LiDAR systems can be found regarding agricultural environment: navigation/autoguidance (Choi et al., Reference Choi, Yin, Yang and Noguchi2014); weed controlling (Andújar et al., Reference Andújar, Escolà, Rosell-Polo, Fernández-Quintanilla and Dorado2013); safety (Armbrust et al., Reference Armbrust, Braun, Föhst, Proetzsch, Renner and Schäfer2011); crop characterization (Zhang and Grift, Reference Zhang and Grift2012), as well as for tree crop characterization.
Direct measurement of canopy structural properties is time-consuming and laborious, and requires destructive leaf sampling. Indirect approaches based on measurements of transmission of radiation through the canopy (Ross, Reference Ross2012; Norman and Campbell, Reference Norman and Campbell1989), image-analysis, ultrasonic sensors, and LiDAR sensors (Palacín et al., Reference Palacín, Pallejá, Tresanchez, Sanz, Llorens, Ribes-Dasi, Masip, Arnó, Escolá and Rosell2007) are suitable for rapidly obtaining a large amount of data. Ground-based LiDAR scanners mounted on an off-road vehicle have also been used for canopy structural studies (Rosell et al., Reference Rosell, Sanz, Llorens, Arnó, Escolà, Ribes-Dasi, Masip, Camp, Gràcia, Solanelles, Pallejà, Val, Planas, Gil and Palacín2009).
In this work, the main aim was to develop and test a LiDAR-based simple method for monitoring olive harvester-induced canopy changes. However, the study also investigated the travel speed and beat frequencies that could explain harvester-induced damage occurring in two different varieties of SHD olive orchard.
Materials and methods
Terrestrial laser scanning
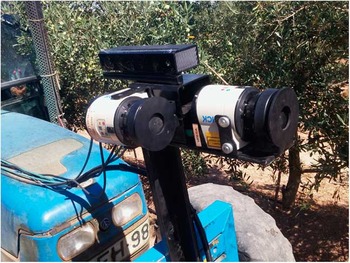
A LiDAR laser scanner LMS111 (SICK AG, Waldkirch, Germany) was installed in a vertical orientation: mounted at the front of the tractor at a height of 1.55 m above ground level, with one sensor with the 270° field of view (FOV) facing upwards (‘vertical’), and the other sensor with FOV facing sideways (‘lateral’, Fig. 1). The LiDAR sensors were interfaced to a computer through an RJ45 Ethernet port for data transfer. The lateral LiDAR orientation provided the tree’s lateral projection. Its resolution in the direction of travel was greatly affected by the tractor speed. Maintaining a constant speed was a key factor for accurate measurements. LiDAR data were recorded by the use of a developed Labview software program (National Instruments Co., Austin, Texas, USA), collecting three items (the scans themselves, encoder pulses and timestamps). Once the point cloud was obtained by the LiDAR sensor and represented using a self-developed software, several distance measurements were made. Additionally, the point cloud obtained by the LiDAR was cross-analyzed with the images recorded during the experiments by a Kinect v2 image sensor (Microsoft, Washington, USA).
Image of the sensors (LiDARs and Kinect v2) mounted on the front of a tractor for monitoring olive tree structure.

Kinect v2 sensor
The Kinect V2 commercial sensor was mounted sideways on the developed platform during the field trials. This sensor captures RGB, NIR and Time-of-flight depth images of olive trees. Visible images were used for the supervised detection in the field trials and to serve as a reference for the LiDAR scans. Kinect RGB images have a resolution of 1920×1080 pixels and a field of view (FOV) of 84.1° × 53.8° resulting in an average of about 22×20 pixels per degree. Although systems such as the Kinect sensor were primarily designed to be used under controlled light conditions, on the second version of this sensor the infrared sensing capabilities were improved, allowing a more light-independent view and being able to be used outdoors under illumination conditions. In spite of this, the quality of the RGB images were somewhat conditioned by the luminosity and the direct incident light. The images taken by the Kinect sensor were simultaneously acquired and synchronized with the LiDAR by the use of an encoder device. Kinect data were recorded by a developed routine in Matlab R2016b (MathWorks, Natick, MA, USA), embedding the timestamp in the image data. Thus, with the same timestamp value for the LiDAR as for the image, both information were related and images provide information about the forward movement of the platform (Figure 1).
Kinect and LiDAR data fusion
Using algorithms developed with ImageJ-image analysis software it has been possible to investigate point clouds ‘before’ and ‘after’ the work of the harvester. Use of the color range select function to perform these measurements is a defining feature of this method. Thus, the precise tones associated with a region of interest can be selected, discriminated from background tones, and quantified.
USB accelerometer data logger
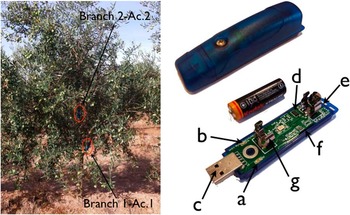
Acceleration was measured using four compact self-recording accelerometer data loggers (USB Accelerometer X16-1D, Gulf Coast Data Concepts, Waveland, MS, USA) that were set to record the acceleration (maximum of 16 g) in 3-axis separately at 100 Hz with 16-bit resolution. Accelerometers were battery-powered (type AA) and weight and dimension was 55 g and 26×26×104 mm. The data from the digital accelerometer was time stamped using a real-time clock (RTC) and were stored into a removable microSD card (8 GB) in simple text format. Two USB accelerometers were strapped to each tree, split between two main branches at different heights from the ground (Fig. 2).
(left) 3-axis accelerometers mounted on an olive tree and (right) view of the X16-1D accelerometer: a) red LED data indicator, b) blue LED status indicator, c) Type-A USB connector, d) ADXL 345 sensor, e) on/off button, f) microSD card (under circuit board) and g) AA battery holder.

Field experiments
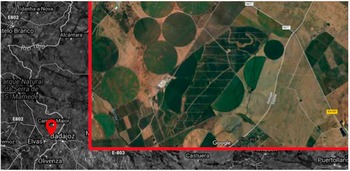
Field trials were performed during the harvesting season in 2016 in Portugal very close to the border with Badajoz (Spain) (Latitude: 38°55'55.1”N, Longitude: 7°02'36.8”O). The two main criteria used for choosing the test area were that it was a commercial olive orchard with two varieties in SHD (Manzanilla ‘Cacereña’ and ‘Sevillana’) that were planted on the same date (9 years old) (Fig. 3).
Orthophoto of the commercial field used in the study.

The harvesting operation was carried out using a self-propelled olive harvester (New Holland Braud 9090X Olive). The machine is characterised by a beater with bow-shaped poles, a conveyor belt transport system with buckets, and a mixed pneumatic and mechanical cleaning apparatus comprising four extractors and a stalk-remover. Two of the extractors were positioned beneath the beater and two above the stalk-remover. The variety Manzanilla ‘Cacereña’ was harvested on the 26th September and the variety Manzanilla ‘Sevillana’ on the 30th of the same month. Three harvesting treatments were established as a combination of different harvester nominal speed (2 and 3 km/h) and different vibration frequencies (430 and 470 Hz).
Each test consisted of two random olive row transects across a length of 15 m and 10 olive trees. Each side of the row was monitored and recorded twice by LiDAR and Kinect sensor, ‘before’ and ‘after’ the harvest operation. The odometry system was monitored using an incremental optical shaft encoder (model 63KS256, Grayhill, Inc., IL, USA) interfaced to an unpowered ground wheel to provide a resolution of 3 mm in the direction of travel. The cumulative odometry pulse count was stored in the microcontroller and were used to determine the instantaneous location of the data along the row. Two olive trees within of row transects were randomly monitored with two portable accelerometers at different heights.
Results and discussion
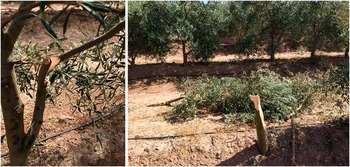
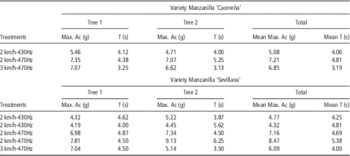
A total of 80 olive trees were scanned using the LiDAR sensor and 32 USB accelerometers were used to monitor and record the vibrations in trees in both experimental trials. Table 1 shows the root mean square (RMS) maximum acceleration measured by the accelerometer and time values recorded for the time of machine passing over the tree. In both olive varieties, the increase in the beating frequency (from 430 to 470 Hz) caused an increase in maximum acceleration by 40% in the variety Manzanilla ‘Cacereña’ and 70% in the variety Manzanilla ‘Sevillana’. A change in harvester nominal speed didn’t cause any significant differences in the maximum acceleration, but it reduced the vibration time per tree by 20%. At the maximum frequency, it is possible to break branches (Fig. 4a) or even to cut olive trees (Fig. 4b). These plant damages may be an indirect cause of concealed losses (Pezzi and Caprara, Reference Pezzi and Caprara2009).
(left) olive tree with branch damage and (right) tree tear by the harvester in the same commercial field where trials were provided.

Maximum acceleration and time values for tree vibration for each treatment.

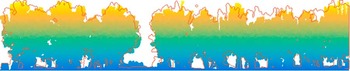
Figure 5 shows an example of change in LiDAR point clouds due to harvesting equipment single-pass. Two passes on each side of the row crop were carried out monitoring an olive tree section using LiDAR and kinect sensor.
Illustration showing the classified LiDAR points: color gradient is point cloud geometry achieved ‘before’ the harvester pass and red line is the contour of the data achieved after passing the harvester. During actual operation the sensor traveled at the same speed in both passes.

Once the images ‘before’ and ‘after’ were scaled, the area with biomass and total area of the image were determined. The comparison of the two maps shows that for variety Manzanilla ‘Cacereña’ the proportion of pixels without biomass increased by 3–5% and by 6–10% for variety Manzanilla ‘Sevillana’. If this increase of pixels without biomass is assumed to be an indirect measure of the tree damage, it indicates that at 430 Hz vibration frequency, there was 3% damage occurring in ‘Cacereña’ and twice as much damage in ‘Sevillana’. For a frequency of vibration of 470 Hz, there was 5% damage occurring in ‘Cacereña’ and 10% in ‘Sevillana’.
In this work, the RGB image provided by the kinect v2 sensor was used to visually validate some unique areas in both images, ‘before’ and ‘after’. This allowed an investigation of the real lost cause of biomass pixels (e.g. broken branches, displaced branches, etc.).
Conclusions
This paper has proposed an approach to estimate olive harvester-induced canopy changes. With the results obtained it could be shown that at a higher beat frequency, greater changes in tree structure were observed; although this initial study only considered two beating frequencies. Variation of the nominal speed in the harvester has not resulted in an increase in the vibrations transmitted to the tree by the harvester, but it has reduced the vibration time for each tree. A fast estimate of the damage produced by an over-the-row harvester with contactless sensing, could be useful information for adjusting the machine parameters in each olive grove automatically in the future, if these type of sensors are mounted on the front and/or back of the harvester.
Acknowledgements
The research was supported in part by the Spanish Ministry of Economic and Competence (Project: AGL2013-46343-R) and the Regional Government of Andalucía (Project: P12-AGR-1227).