


Sir,
Reference Wilch and HughesWilch and Hughes (2000; hereafter WH) present a calculation of the subglacial thermal zones in parts of East and West Antarctica using Reference DrewryDrewry’s (1983) maps of ice surface and basal topography. Their calculations suggest that the ice-sheet base is “thawed” beneath Dome C, in central East Antarctica, across the Vincennes Subglacial Basin, but in their figure 12 a large region of frozen-based ice has been drawn for this area. The figure caption has been miswritten, and the correct denotation of melting and freezing zones should be “horizontal lines are complete subglacial melt zones, and vertical lines are complete freeze zones”.
A comparison between WH’s calculations and maps, and the locations of subglacial lakes in this region of Antarctica is quite interesting (Fig. 1). Regions where WH calculated that the ice-sheet base was completely thawed are closely related to the position of many known subglacial lakes. Subglacial lakes are pockets of water stored within topographic hollows beneath the ice sheet. They can be readily identified on airborne radio-echo sounding (RES) records since they have a characteristic flat, bright, near-horizontal radar reflection, compared with the weaker, undulating signal reflected from ice–bedrock interfaces. An inventory of Antarctic subglacial lakes (Reference Siegert, Dowdeswell, Gorman and McIntyreSiegert and others, 1996) shows the locations of 77 known subglacial lakes in the region of the Scott Polar Research Institute RES survey (i.e. the same region as that investigated by WH). Beneath Dome C the 40 or so known subglacial lakes are mostly < 12 km long and occupy < 10% of the total subglacial area in this region (Reference Siegert and RidleySiegert and Ridley, 1998). The lakes are often located across the flanks of deep, extensive troughs like the Vincennes Subglacial Basin, the Aurora Subglacial Basin and the Adventure Subglacial Trench. Since relatively thicker ice will have a lower sub glacial pressure-melting point, lakes located at the elevated flanks of deep troughs can be interpreted as evidence for subglacial melting across a much wider region (i.e. across the deep troughs) than just their surface areas. The wider distribution of subglacial lakes is even more compatible with the results of WH, since even a predominantly frozen zone will contain a thawed fraction to accommodate a pool of subglacial water. No subglacial lakes are positioned within regions where the WH model shows a completely frozen bed.
The distribution of Antarctic subglacial lakes, denoted as circles (the centre of each marks the lake location) (Reference Siegert, Dowdeswell, Gorman and McIntyreSiegert and others, 1996), superimposed over figure 12 of WH, in which the location of calculated subglacial freezing and melting zones is denoted. Lake Vostok is outlined and shaded. Horizontal lines indicate regions where f = 1 (complete thawing), whilst vertical lines represent areas where f = 0 (no thawing).
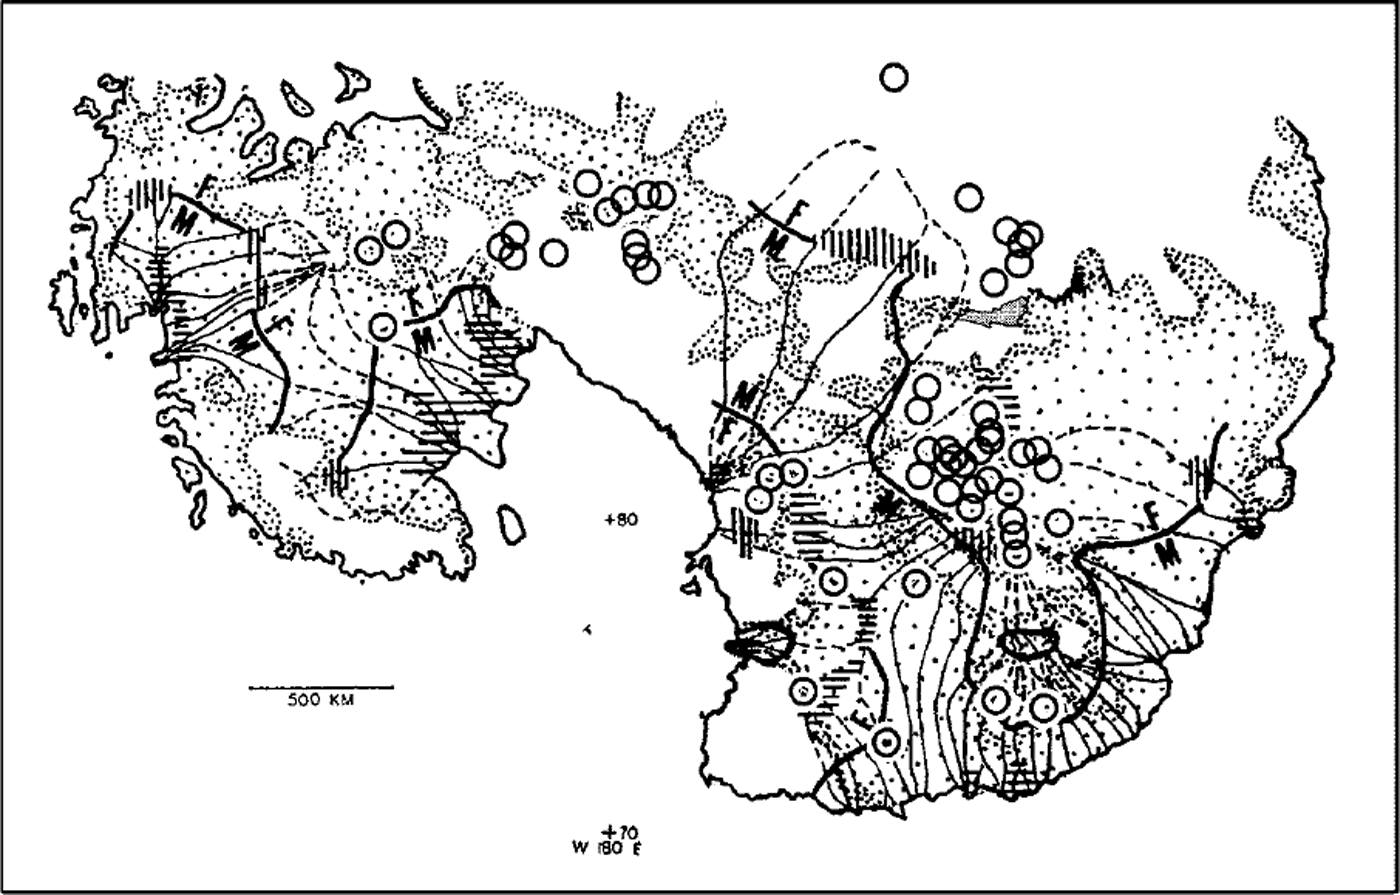
The Reference DrewryDrewry (1983) map of surface elevation used by WH has been much improved in the last 17 years. For example, European Remote-sensing Satellite 1 (ERS-1) altimetry of the region provides much more accurate ice-surface slopes (Reference Bamber and BindschadlerBamber and Bindschadler, 1997), and the new BEDMAP depiction of the ice-sheet basal elevation (Reference Lythe and VaughanLythe and others, 2000) is also much improved. Many relatively large (>30 km wide) low-sloping ice-surface features found in the ERS-1 data overlie either known subglacial lakes around Dome C (Reference Siegert and RidleySiegert and Ridley, 1998) or regions interpreted as water-saturated sediment pockets (Reference Siegert, Maltman, Hubbard and HambreySiegert, 2000). Further, a model of ice-sheet flux, using these recent datasets as input, shows that several subglacial lakes are located close to the onset of enhanced ice flow (Reference Siegert and BamberSiegert and Bamber, 2000) and suggests that a number of ice-flow units in Antarctica may be subglacially thawed. It would be interesting to see if the WH calculations, driven with these newer input data, would match (1) the known distribution of subglacial lakes better than the match shown in Figure 1, and (2) the distribution of warm-based ice-flow units.
5 March 2001



