

Alcohol consumption has increased in Sweden and was almost 20% higher in 2009 compared with the mid-1990s (Ramstedt, Reference Ramstedt2010). Thirteen per cent of men and 8% of women drink more than 14 and 9 standard drinks per week in the age group of 16 years to 80 years. According to a Swedish Labor Force Survey (AKU), about two thirds of the population aged 16 to 64 is employed. Babor et al. (Reference Babor, Caetano, Casswell, Edwards, Giesbrecht, Graham and Rossow2010) suggest that early intervention is one of seven alcohol prevention areas that have been shown to be effective in reducing problem-drinking. Therefore, it is reasonable to believe that many problem-drinkers could be reached with early interventions in the workplace.
Richmond, Kehoe, Heather, and Wodak (Reference Richmond, Kehoe, Heather and Wodak2000) examined the incidence of alcohol prevention efforts in 67 Australia Post workplaces. Twenty-four per cent of all employees surveyed reported that their workplace had a program for people with risky alcohol consumption. Twenty-one per cent of men and 9% of women had hazardous or harmful alcohol consumption (i.e., more than 27 or 14 units per week, respectively). In addition, most people surveyed expected that the employer should take an interest in the employees’ alcohol consumption, but only a minority would actively seek counselling for alcohol problems via the employer. After the initial screening was carried out a brief intervention for at-risk consumers was performed, consisting of information about the effects of high alcohol consumption, feedback on their own consumption compared to the average population, and ways to reduce alcohol intake (Richmond et al., Reference Richmond, Kehoe, Heather and Wodak2000). The result was that female employees significantly reduced their alcohol consumption, but no significant change was observed among men. This result is consistent with previous research. A systematic review found that 9 out of 10 published articles on interventions in the workplace reported significant reductions in alcohol consumption and injuries related to alcohol (Webb, Shakeshaft, Sanson-Fisher, & Havard, Reference Webb, Shakeshaft, Sanson-Fisher and Havard2009). Four of these studies used randomised designs (RCT) but had other methodological problems (sample representativeness, contamination between groups, and unacceptable validity/reliability of measurements).
Brief interventions for alcohol problems have also demonstrated positive effects among university students. For example, one study of a program for students who have committed an alcohol- or drug-related offense (Student Assistance Program [SAP]) showed that SAP was significantly better in reducing alcohol consumption compared to a conventional treatment program (Amaro et al., Reference Amaro, Ahl, Matsumoto, Prado, Mulé, Kemmemer and Mantella2009).
Elevated or risky alcohol consumption can increase the risk of sickness absence, accidents and work-related injuries among employees, and can have a detrimental effect on the work environment (Hermansson, Reference Hermansson2004; Smith & Kraus, Reference Smith and Kraus1988). A study by Salonsalmi, Laaksonen, Lahelma, and Rahkonen (Reference Salonsalmi, Laaksonen, Lahelma and Rahkonen2009) showed that both abstainers and those who drank unhealthy amounts of alcohol had a higher than average annual sick leave compared to those who drank moderate amounts of alcohol. The high sickness absence among the abstainers can be explained by the fact they do not drink alcohol due to other health problems. In conclusion, alcohol consumption can lead to increased costs for both the employer and the employee.
A previous study (Källmén & Leifman, Reference Källmen and Leifman2009) examined whether a one-day alcohol and drug workplace prevention program affected the establishment of alcohol policies and action plans. The results showed that training in alcohol prevention can intensify prevention efforts. The employees who received training, compared with untrained control subjects, reported a greater number of alcohol policy and action plans. After the program, they felt greater efficacy than the untrained employees in how to manage a co-worker with an alcohol problem.
Based on these findings, there are good reasons for both employers and employees to implement secondary preventive methods at workplaces. Both the Swedish Council on Health Technology Assessment (2001) and the National Board of Health and Welfare report (Socialstyrelsen, 2007) that secondary prevention is an effective way to minimise alcohol problems.
A secondary alcohol preventive method that can prevent high and/or risky alcohol consumption is ‘screening and brief intervention’ (in Sweden this is the ‘Risk Drinking model’). The method is currently used in primary health care but it can also be applied to workplaces. It involves systematic screening for risky drinking habits and engaging the identified risk consumers in a short, nonconfrontational conversation influenced by motivational interviewing techniques in order to initiate change. This method has demonstrated efficacy in motivating risk consumers to drink less (Swedish Council on Health Technology Assessment, 2001). To conduct effective secondary alcohol prevention on a population basis, it is necessary to screen a large portion of the total population to find at-risk consumers. The workplace provides an excellent access point for most individuals. Since 2005, the Swedish National Institute of Public Health has disseminated knowledge about the Risk Drinking Project and model (screening and brief intervention) to many Swedish workplaces. Initially, the aim was to train the occupational health services (OHS) to implement alcohol screening and counseling in connection with lifestyle surveys; referred to here as the Risk Drinking model. The project later received an expanded mandate to also disseminate the model to workplaces. Alcohol screening at Swedish workplaces is often done in cooperation with OHS in the context of a health or lifestyle survey. The approach can be summarised in three steps (Hermansson, Helander, Brandt, Huss, & Ronnberg, Reference Hermansson, Helander, Brandt, Huss and Ronnberg2010):
1. In connection with a health and lifestyle checkup, employees are offered alcohol screening.
2. Screening is carried out with the use of the AUDIT form (Alcohol Use Disorders Identification Test; Bergman & Källmen, Reference Bergman and Källmen2002) and when appropriate, a carbohydrate deficient transferrin (CDT) blood test (Helander, Reference Helander2003).
3. Based on the AUDIT score and/or CDT result, the employees with elevated or hazardous alcohol consumption are offered brief counselling, where the objective is to encourage the person to reflect on their own drinking habits.
Purpose and Research Questions
The main purpose of this study was to estimate the proportion of Swedish workplaces involved in alcohol prevention and more specifically, to estimate the use of the Risk Drinking model. We further aim to describe the characteristics of workplaces that conduct alcohol prevention using the Risk Drinking model.
The specific research questions are as follows:
• What percentages of Swedish workplaces are engaged in activities to prevent alcohol and drug problems?
• How widespread is the Risk Drinking model in Swedish private and public workplaces?
• What characteristics define workplaces implementing alcohol and drug prevention?
Method and Materials
Selection of Participants
In collaboration with PAR, a private company selling addresses to be used for direct marketing and with access to registers containing addresses to Swedish workplaces, a random sample of 1,000 workplaces was drawn. The sample came from a registry called ‘Parad’ containing all officially registered workplaces in Sweden (more than 1.1 million in total) workplace. The sample was stratified by industry (Swedish Standard Industrial Classification), employment sector and product area. It was also divided into nine different size divisions based on the number of employees. PAR is Sweden's leading company in the field of business information and ensures that customer databases are kept up to date.
As a questionnaire would be sent to managers with responsibility for staff, names and e-mail addresses were required. The final sample contained contact details for staff managers within 211 private and public workplaces. Web sites on the Internet were scanned to obtain contact information for managers responsible for staff at the remaining 789 workplaces. E-mail addresses were confirmed by telephone. Telephone numbers were missing for 19 workplaces. In total 929 sites were identified with correct names and e-mail addresses for personnel managers or the manager with staff responsibility.
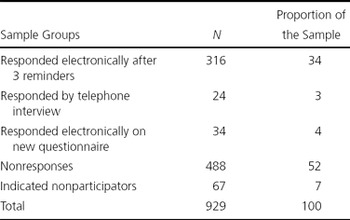
After the questionnaire was sent out and followed-up with three reminder letters, we had 316 responses (34%). There were 67 responders who indicated that they did not want to participate. In order to increase the number of participating worksites, a random sample of 200 nonresponding workplaces were drawn from those remaining (n = 527).
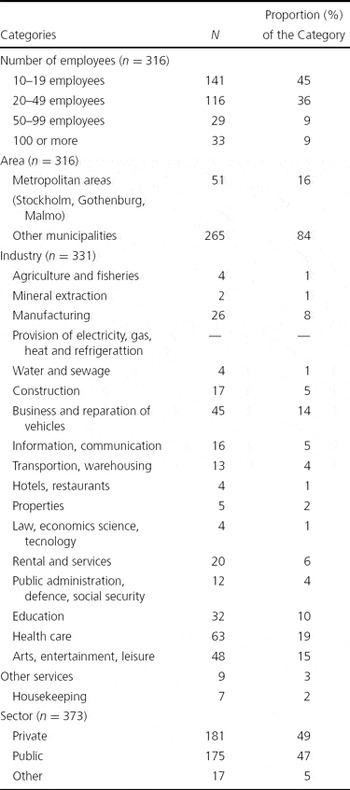
The 200 workplaces were contacted by telephone and asked to complete the questionnaire, resulting in 58 additional responses. Twenty-four people responded to a telephone interview and 34 via an electronic copy of the questionnaire. Table 1 shows the sample of 929 workplaces (including 19 without telephone number) divided into five different groups based on their response status. The 374 sites that responded were categorised by size, area, branch and sector. A number of workplaces did not have complete demographic data due to incomplete matching of the 58 responders that were contacted. A majority of the participating workplaces were small with 10 to 19 employees (45%) and 20 to 29 employees (37%), respectively. Sixteen per cent of the workplaces are located in one of three metropolitan areas and a similar proportion in the private sector.
Number and Proportion of the Sample Allotted to Different Groups

Questionnaire
A questionnaire (APW09) containing 25 questions was constructed specifically for this study. It consisted of demographic questions (age, gender, living area and professional experience), items concerning the presence of an alcohol policy, how prevention at work was conducted (if at all), and knowledge about the Risk Drinking model. Questions about manager and employee training in alcohol issues and the rehabilitation of employees with alcohol problems were also included. Items about ongoing work with the physical and psychosocial work environment were included, as were questions about the need for greater knowledge in prevention.
Procedure
A group e-mail with a letter addressed to all respondents explaining the purpose of the study was sent to all 929 people in the sample. The e-mail contained a link that the recipient could open to answer the questionnaire. The answers were automatically saved on a file that was later exported to us. Reminders were posted out one, two and four weeks after the initial mailing.
Statistics and Data Analyses
All analyses were conducted in the SPSS 18.0 software environment. Descriptive statistics, chi square and logistic regression were calculated due to the categorical variables. A model consisting of eight explanatory variables was included in the regression. Due to the large proportion of nonresponders, some variables were weighted to make the respondents represent the whole sample. Unfortunately no weighting to make respondents similar to the population was possible.
Although an inspection of the correlation matrix showed that no variables co-varied highly (>0.6) there were some variables that correlated between 0.2 and 0.4 (sector -training, sector-gender distribution of employees). Control for co-variation between the explanatory variables in the regression model were made by a step-wise ‘backwards’ elimination method. Only unique covariance is reported. The potential explanatory variables were (a) the respondent had either more than 5 years experience or 5 years or less experience; (b) if there were more men than women at the workplace; (c) which sector (public or private) the workplace belonged to workplace; (d) the location — city area (Stockholm, Gothenburg or Malmö) or not; (e) the number of employees (more than or less than 50); (f) if the employees received alcohol prevention training during the last 3 years or not; (g) manager training in alcohol prevention within the last 3 years or not; and (h) if the managers were trained in drug prevention during the last 3 years or not.
Response Bias
Records indicating the number of employees, the workplace location and industry type workplace (Standard Industrial Classification [SIC] codes) were obtained from the Parad database. Industries were grouped into 21 categories based on SIC codes. Chi square analyses compared differences in the proportion of respondents and non-responders with regard to workplace location (city or not; χ12 = 0.101; p = .751), number of employees (< or > 50; χ21 = 4.47, p = .035), and branch distribution (χ218 = 62.43, p < .001). A greater proportion came from responses came from large workplaces and workplaces involved with public administration, education and care.
Table 2 shows the pattern of response by size of enterprise, area, industry and sector. About 80% are small enterprises with fewer than 50 employees and are located outside metropolitan areas. Dominating industries were business and reparation of vehicles, education, health care, arts, entertainment and leisure. There was an even distribution between responders from the public and private sectors.
Proportion (%) of Respondents in Each Category

Results
Alcohol
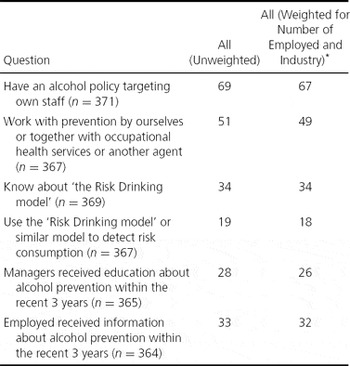
Table 3 shows the results from the key questions about alcohol prevention at the workplace (both unweighted and weighted values). As shown, the difference between the unweighted and weighted results was small. This means that the distribution among the respondents was representative of the sample and that nonresponders did not affect the results significantly. We, therefore, chose to present results based on unweighted values.
Proportion (%) of Worksites Reporting Different Alcohol Preventive Measures

Note: * The distribution of number of employed and industry among the respondents has been weighted according to the distribution in the sampling frame containing 929 worksites (e.g., the proportion among the respondents corresponds to the proportions in the sampling frame)
Table 3 shows that a majority of the workplaces (about two-thirds) had an alcohol policy and that about half said they are working with alcohol and drug prevention alone or together with another organisation. Just over a third of respondents said that they knew about the Risk Drinking model but only about 3% indicated that they used it; 16% said they use a similar model. This means that nearly one in five respondents reported that their workplace used the Risk Drinking model or a similar model as shown in Table 3.
Furthermore, almost 28% of workplaces had trained their managers in alcohol prevention methods during the past three years, and 33% reported that employees received information on alcohol during the same period.
Factors Associated with Alcohol Prevention
Logistic regression was used to determine what factors characterised workplaces engaged in alcohol prevention. A model consisting of eight variables was used in the regression of alcohol prevention. The eight variables were (a) sector (public/private); (b) estimated gender distribution (mostly men, mostly women, or equal); (c) level of experience (more or less than 5 years in the present position); (d) region (metropolitan or not); (e) age (above or below 50 years); (f) education to employees in alcohol and drugs; (g) alcohol education to bosses within 3 years; and (h) drug education to bosses within 3 years. The results indicate that four variables were significantly associated with ‘doing alcohol prevention’ (see Table 4).
Multiple Logistic Regression Analysis of the Question Regarding Occurrence of Alcohol Prevention at the Workplace*

Note: * (n = 367) Significant explanatory variables: Beta coefficients, χ2 test, odds ratio, and confidence interval for odds ratio.
Large workplaces with 50 or more employees were nearly five times more likely to work with alcohol prevention than smaller workplaces with less than 50 employees. Workplaces where employees received information about alcohol prevention during the past 3 years were four times more likely to work with alcohol prevention than workplaces that had not trained their staff during this time. Moreover, alcohol prevention was more than twice as common in public sectors compared to private workplaces, and also in female-dominated workplaces compared to workplaces comprised mainly of men. We controlled for experience, region, and training of managers in alcohol or drugs in the analyses
The same eight explanatory variables were tested in a logistic regression using responses to the item ‘use of Risk Drinking model or similar model at the workplace’ as the dependent variable. The results showed that two of the eight variables were significantly related to the use of Risk drinking model or a similar model (see Table 5). If the managers received training on drugs within the last 3 years, it was almost seven times more likely that they would be working with the Risk Drinking model or a similar model. At workplaces where staff received training on alcohol within the last three years, the probability increased six-fold.
Multiple Logistic Regression Analysis of the Question Regarding Use of Risk Drinking Model at the Workplace*

Note: * (n = 323) Significant explanatory variables: Beta coefficients, χ2 test, odds ratio, and confidence interval for odds ratio.
Discussion and Conclusions
The purpose of this study was to identify the extent of alcohol prevention in Swedish workplaces in general and to measure the dissemination of a model for secondary alcohol prevention — the Risk Drinking model.
The results show that approximately 70% of responding workplaces had an alcohol policy for its own staff and about 50% reported that they conduct alcohol preventive initiatives. One fifth of the workplaces used a model with alcohol screening and brief counseling. However, a smaller proportion of workplaces called it a Risk Drinking model. Large and public workplaces were overrepresented among respondents since approximately 90% had less than 100 employees, compared to about 99% with less than 250 employees in the European Union (EU; and Sweden; Eurofound, 2012). Therefore, there is a risk that the prevention activities have been overestimated. Several Swedish studies show that training in health and working environment issues and support from OHS are more common in larger workplaces compared to smaller ones (e.g., Frick, Langaa Jensen, Quinlan, & Wilthagen, Reference Frick, Langaa Jensen, Quinlan and Wilthagen2000; Swedish Work Environment Authority, 2012).
It is interesting to note that a third of the workplaces reported that they knew about the Risk Drinking model. However, a small number (15%) of workplaces reported that information about alcohol risks were included in the training provided to managers. Information about the treatment of problem drinking among employees was a dominating theme in the training programs. Although this study cannot prove that knowledge about the Risk Drinking model came from the various seminars and conferences held about hazardous alcohol use, it is reasonable to assume that these were relevant in bringing about greater awareness of the model.
The fact that one in five workplaces implemented the Risk Drinking model, or a similar model containing screening and brief counseling, and one in three knew about the Risk Drinking model can be interpreted as a partial success in both the dissemination and implementation of the model. Guldbrandsson (Reference Guldbrandsson2007) summarises some key methodological criteria for the successful implementation of a prevention method. She states that the method should be relevant, have visible benefits, be consistent with the recipient's values, be simple to use and adaptable to the needs of the user. These criteria were followed with the marketing of the Risk Drinking model. Therefore, one recommendation is that alcohol screening and counselling should be integrated within the existing lifestyle and health surveys that OHS implements. Learning to handle the method in a clinical interview is relatively simple and is generally accepted by co-workers (Hermansson, Knutsson, Rönnberg, & Brandt, Reference Hermansson, Knutsson, Rönnberg and Brandt1998). The cost to add the model to an existing lifestyle study is low (Swedish Council on Health Technology Assessment, 2001).
The concept of adding screening and brief counselling to health and lifestyle evaluations appears to have impeded the implementation of the model in workplaces that do not offer health and lifestyle surveys to employees. The results of this survey show, for example, those workplaces with few employees use the Risk Drinking model significantly less compared to mid-sized and larger workplaces. Similarly, workplaces with few employees do not always cooperate with OHS standards and do not demand health and lifestyle surveys to the same extent as larger organisations (Frick et al., Reference Frick, Langaa Jensen, Quinlan and Wilthagen2000). This result raises the related issue of whether or not the Risk Drinking model should be tested in other ‘settings’ than health and lifestyle surveys, and whether the method can be implemented by people other than OHS officers in order to achieve a wider distribution among smaller workplaces.
Approximately half the workplaces surveyed indicated that they need more knowledge of methods aimed at detecting and preventing alcohol problems at an early stage. This need could lead to increased use of the Risk Drinking model or a similar secondary preventive model. An important prerequisite for this need being met is that OHS (or other relevant personnel) continue to spread knowledge about the method to their employers and clients, and that OHS are supported in maintaining the skills to disseminate knowledge about the method, not least the implementation of alcohol screening and brief counselling.
Nearly nine out of ten workplaces indicated that they had systematically worked with the psychosocial work environment to improve employee health and safety. Of these, almost half (49%) reported that alcohol and drug prevention were included in that work. However, a lower proportion said they had trained managers and staff in alcohol prevention during the past 3 years. The lack of appropriate training could be due workplace to the alcohol issue being given a low priority and not viewed as a natural part of the systematic work. It could also be that the workplaces assessed the alcohol problem as low and not a risk among the employees.
In a previous study of Swedish workplaces (Källmén & Leifman, Reference Källmen and Leifman2009) it was shown that training key personnel in alcohol prevention was associated with more alcohol prevention activities. Similar results were found in this study. The likelihood of working with the Risk Drinking model or a similar model increased six times if staff had been trained in alcohol prevention within the past 3 years. One possible conclusion is that education is important for the implementation of alcohol prevention and alcohol screening with brief counseling. Another conclusion is that workplaces actively working with alcohol prevention, such as the Risk Drinking model, should also include training of staff in this work. It is also possible that training in itself is considered a preventive activity, something we did not consider.
As previously discussed, the specific alcohol prevention method (the Risk Drinking model) was more common in workplaces with 50 or more employees than among smaller workplaces. It was further shown that alcohol and drug prevention were more common among large sites (≥50 employees) than among those with few employees. This could be explained by the fact that large organisations have specific legal requirements for the consideration of occupational health and safety issues, with representatives from both the employer (i.e., business or organisation) and for the employees. Such a committee will probably lead to more active measures related to working conditions and health at the workplace.
This study has several practical implications and makes an important contribution to literature on alcohol prevention in Swedish working life. The results are promising concerning the use of secondary prevention models such as the Risk Drinking model. It is important to further educate managers in Swedish working life about work-related alcohol problems, and to increase the implementation of the model at both public and private workplaces. In particular, it is important to focus on small enterprises and to also inspire a range of working environments and health consultants, not only the OHS.
Methodological Considerations
Swedish Standard Industrial Classification (SIC) is primarily used for classifying production units into groups according to the activity carried out. Using this classification, we evaluated whether or not alcohol prevention efforts differed among industries. Since there were few responding workplaces in some industries the results are difficult to interpret. Some sectors are relatively active on one or a few areas but not in others.
A weakness in this survey is the nonresponse rate. We received replies from 374 managers (40%) from 929 workplaces. This failure means that some results must be interpreted with caution. The analysis of response bias showed that among the respondents there was a greater proportion of large workplaces and public administrations, education and health care sectors, and a smaller proportion in construction and manufacturing. However, the analysis showed that there was no difference in the proportion of respondents between workplaces situated in large cities (Stockholm, Gothenburg or Malmö) and in other municipalities.
Acknowledgements
The authors are grateful to Swedish National Institute of Public Health and Swedish Council for Working Life and Social Research (grant nr 2009-1705) for supporting this study. The authors report no conflicts of interest.