I. INTRODUCTION
FGH96 is a kind of precipitation-strengthened nickel-based superalloy using powder metallurgy (P/M) technology that is considered as an innovative method to minimize the segregation of alloying elements. It shows a good combination of mechanical properties and physical properties up to 750 °C, having potential for use in high thrust–weight ratio engine and turbine disk manufacture. Reference Viswanathan, Sarosi, Henry, Whitis, Milligan and Mills1,Reference Zhang, Li, Wang and Liu2 However, it possesses poor workability and has a high cracking tendency during forging as other superalloys due to the high amount of alloying and γ′-forming elements that tend to form γ′ phase in superalloys, such as Al, Ti, Nb, Ta, etc. Reference Pan, Li, Wang, Zhang and Yin3 Therefore, it's of great importance to investigate the hot deformation behavior of this kind of superalloy.
The flow stress and constitutive equation are the basic parameters for characterizing plastic deformation behavior of metals and alloys, which can be used to determine the load and energy needed during deformation. Recently, processing map that based on dynamic materials model (DMM) has been developed to optimize hot working processes and control microstructural evolution. Ning et al. have studied the hot deformation behavior of hot isostatic pressed (HIPed) FGH96 and investigated the effects of initial grain size on it. Moreover, they characterized the microstructural evolution after hot compression and proposed that dislocations stimulate the occurrence of dynamic recrystallization (DRX) at previous particle boundaries (PPBs) as well as grain boundaries and twin sources. Reference Ning, Yao, Zheng, Guo and Fu4–Reference Ning, Yao, Lei, Guo and Fu6 Wu et al. studied the effects of processing parameters on deformation behavior using processing maps for a Ni–Cr–Co-based P/M superalloy. Reference Wu, Liu, Hu, Wang, Zhang, Tao and Liu7,Reference Wu, Liu, Hu, Li, Zhang, Tao and Liu8 Similar works concerning DRX, flow behavior, and processing map establishment for other superalloys were also conducted by researchers. Reference Kang, Zhang, Sun, Li and Shen9–Reference Li, Guo, Guo, Peng and Wu12 However, few works have been carried out on clarifying the influences of microstructure and γ′ phase distribution on the flow behavior of superalloys, even though the superalloys contain a certain amount of γ′ phase. The microstructures and γ′ phase distributions are varied in the HIPed and solution states, which are two key stages of the forming process for FGH96. Clarifying the effects of microstructure and γ′ phase distribution on the deformation behavior is of significance for adjusting process parameters and improving the performance of this kind of superalloy.
In this work, the P/M superalloy FGH96 in HIPed and solution states were prepared, attempting to introduce different initial microstructures with γ′ phase distributions for hot compression tests. The flow stress, processing map, microstructural evolution, and morphology of γ′ phase distribution during deformation were investigated to confirm the effects of microstructure and γ′ phase distribution on the deformation behavior for FGH96.
II. EXPERIMENTAL
The experimental material used in this work is a P/M nickel-based superalloy FGH96. The nominal chemical compositions (in wt%) are detailed in Table I. The as-received material was in a HIPed state. It was produced by plasma rotation electronic pole technology followed by HIP treatment. Solution treatment was conducted at 1150 °C for 2 h to harmonize microstructure and, after that, water quenched to room temperature. The specimens in the HIPed state and solution treatment after HIP were used to study the hot deformation behavior, denoted as HIPed and Sol, respectively.
Chemical compositions of the tested FGH96 (wt%).

Cylindrical specimens with a diameter of 8 mm and height of 12 mm were machined from the HIPed and Sol bars. The isothermal compression tests were performed with a Gleeble1500 thermal mechanical simulator (Dynamic System Inc., Luoyang, China). The specimens were heated to 1000–1150 °C at a heating rate of 20 °C s−1. After holding for 30 s to reduce the temperature gradient, the specimens were compressed to 1.0 strain at the strain rate of 0.001, 0.01, 0.1, and 1.0 s−1. Then, the specimens were quenched to normal temperature via water spraying. The compressed specimens were machined parallel to the compressed direction for microstructural observation using an optical microscope and a scanning electron microscope (SEM).
III. RESULTS
A. Initial microstructures
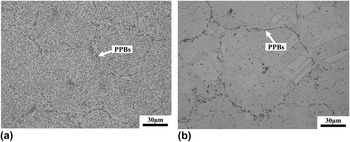
Figure 1 shows the initial microstructures of FGH96 in the HIPed and Sol states. In the HIPed specimen, the microstructure contains a lot of round PPBs, with no appearance of recrystalized grains. There are quite a lot of γ′ phases inside the particles. After solution treatment, the amount of PPBs and bigger γ′ phase decreases significantly. Equiaxed grains with annealed twinnings appear in microstructure.
Initial microstructures of FGH96 superalloy in (a) HIPed state and (b) solution state.

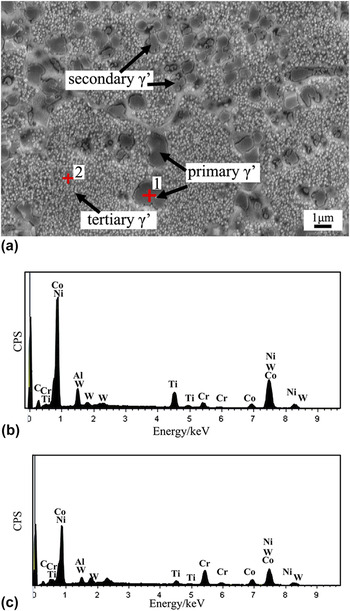
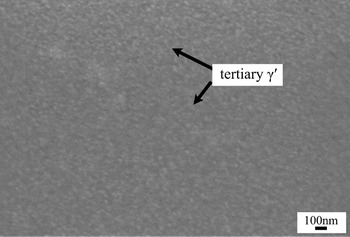
Figure 2 shows the morphology of γ′ distribution in HIPed sample, which is composed of primary, secondary, and tertiary γ′ phases. The primary γ′ phase is usually formed at grain boundaries and shows a relative big size in either a blocky morphology or dendritic morphology, which is thought to be formed at the early stage of solidification. And the secondary and tertiary γ′ phases are thought to be re-precipitated from the high supersaturated base metal with smaller sizes. Reference Qiu, Attallah, Wu and Andrews13,Reference Chen, Slater, Lewis, Francis, Burke, Preuss and Haigh14 As indicated in Fig. 2, the coarse primary γ′ in the HIPed sample is formed at the grain boundaries and showed a range of 1–3 μm. The size of the secondary γ′ phase decreases to around 300 nm–1 μm. And the tertiary γ′ phase shows a spherical shape with much smaller diameter. Energy dispersive system (EDS) analysis indicates that the γ′ phase mainly contains Ni, Cr, Co, Al, and Ti. And the γ′ distribution in the Sol FGH96 is presented in Fig. 3. It can be seen that, after solution treatment, the coarse γ′ particles are dissolved in the sample, and certain amount of fine tertiary γ′ phases forms in the sample.
SEM micrograph of γ′ particle distribution and EDS analysis in the HIPed FGH96 (a) secondary electron SEM micrograph; (b) EDS analysis for point 1; (c) EDS analysis for point 2.

SEM micrograph of γ′ particle distribution in the solution-treated FGH96.

B. Flow stress curves
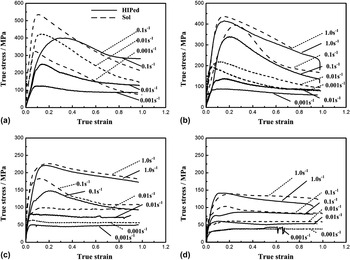
The true stress–true strain curves at various deformation temperatures and strain rates are shown in Fig. 4. For comparing the hot deformation behavior in different initial microstructures, the flow curves of the specimens in HIPed and Sol states are illustrated in the same figure. The flow stress curves exhibit a flow-softening feature after reach peak stress, indicating that DRX occurred during the compression process. By comparing the curves at different temperatures and strain rates, it can be seen that the tendency of DRX increases with the decrease of deformation temperature and increase of strain rate. The flow curves show dynamic recovery (DRV) characteristic when deformed at higher temperatures with small strain rates. When deformed at 1000 and 1050 °C, the resistance values of Sol specimens are much higher than the HIPed ones. With the deformed temperature increasing to 1100 °C, the difference of the deformation resistances between the HIPed and Sol ones decrease to 20–30 MPa. And when the temperature increased to 1150 °C, the resistances of the two kinds of samples are approximately the same, in which the differences are just in the range of 0–10 MPa.
True stress–true strain curves of HIPed and Sol samples during hot compressive deformation at (a) 1000 °C, (b) 1050 °C, (c) 1100 °C, and (d) 1150 °C.

C. Constitutive equation and processing map
The Zener–Hollomon parameter is introduced to characterize the combined effects of strain rate and temperature on the deformation process. Reference Lin, Wen, Deng, Liu and Chen15
 $$Z = \dot \varepsilon \exp \left( {{Q \mathord{\left/ {\vphantom {Q {RT}}} \right. \kern-\nulldelimiterspace} {RT}}} \right)\quad ,$$
where
 $\dot \varepsilon$
represents the strain rate (s−1), and T is the absolute temperature (K), Q is the activation energy (kJ mol−1), and R is the gas constant (8.314 kJ mol−1·K).
The Arrhenius equation is widely used to describe the relationship of flow stress, strain rate, and temperature Reference Wu, Liu, Hu, Wang, Zhang, Tao and Liu7,Reference Lin, Wen, Deng, Liu and Chen15 :
 $$\dot \varepsilon = AF(\sigma )\exp \left( { - {Q \mathord{\left/ {\vphantom {Q {RT}}} \right. \kern-\nulldelimiterspace} {RT}}} \right)\quad ,$$
in which,
 $$F(\sigma ) = \left\{ {\matrix{ {{\sigma ^{{n_1}}}\quad\;\;\;\;\;\;\; \;\;\alpha \sigma \;\lt \;0.8} \cr {\exp (\beta \sigma )\quad \;\;\alpha \sigma > 1.2} \cr {{{\!\!\![\sinh (\alpha \sigma )]}^n}\quad \!\!\!{\rm{for}}\;{\rm{all}}\;\sigma } \cr } \quad ,} \right.$$
where σ is the flow stress (MPa) at a constant strain, and A, α, n 1, n, β are material constants. In this article, peak stress σp is used to regress Eqs. (2) and (3).
The stress–strain curves (Fig. 4) indicate that the flow behaviors are almost the same when the temperature was increased to 1150 °C, which may be related to the dissolution of the γ′ phase. So, the curves of 1000, 1050, 1100 °C were chosen to regress constitutive equations.
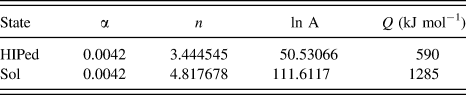
The values of A, α, n 1, n, and Q can be obtained by fitting the experimental data through regression analysis. The variations of peak stress with strain rate and deformation temperature are shown in Figs. 5 and 6. The relationships of lnZ − ln[sinh(ασp)] were plotted and found that the correlation coefficients R were 0.964 and 0.974 for the HIPed and Sol samples, respectively, demonstrating the accuracy of the regressed constitutive models. Table II summarizes all calculated constants in the above equations. The regressed constant α for the two states had the same value. The calculated activation energy Q in the Sol sample was 1285 kJ mol−1, which was much higher than the 590 kJ mol−1 in the HIPed sample.
The linear relationships of (a) ln[sinh(ασp)] versus
 $\ln \dot \varepsilon$
and (b) ln[sinh(ασp)] versus 1000/T by regressing for HIPed sample.

The linear relationships of (a) ln[sinh(ασp)] versus
 $\ln \dot \varepsilon$
and (b) ln[sinh(ασp)] versus 1000/T by regressing for Sol sample.

Values of the parameters calculated by fitting.

Processing map on the basis of DMM is widely used for optimizing hot working processing parameters and studying constitutive behavior of materials, especially for materials that are difficult to deform, which is made by overprinting with a power dissipation map and an instability map. Processing maps were established in this work to study the difference of hot deformation behavior for FGH96 in the two kinds of states.
The power dissipation through microstructural evolution during hot deformation can be represented by the efficiency of power dissipation (η), which is given by Reference Ning, Yao, Zheng, Guo and Fu4,Reference Wen, Lin, Li, Chen, Deng and Li11 :
 $$\eta = {{2m} \mathord{\left/ {\vphantom {{2m} {\left( {m + 1} \right)}}} \right. \kern-\nulldelimiterspace} {\left( {m + 1} \right)}}\quad ,$$
where m is strain rate sensitivity of flow stress, calculated by
 $$m = {{\partial \ln \sigma } \mathord{\left/ {\vphantom {{\partial \ln \sigma } {\partial \ln \dot \varepsilon }}} \right. \kern-\nulldelimiterspace} {\partial \ln \dot \varepsilon }}\quad .$$
The variation of η with deformation temperature and strain rate constitutes a power dissipation map. Different domains in the contour plot reveal the specific microstructural mechanisms.
To identify the regime of flow instability, the instabilities criterion is used as follows Reference Wen, Lin, Li, Chen, Deng and Li11,Reference Wang, Pan, Song, Li and Li16 :
 $$\xi (\dot \varepsilon ) = {{\partial \ln \left[ {{m \mathord{\left/ {\vphantom {m {(m + 1)}}} \right. \kern-\nulldelimiterspace} {(m + 1)}}} \right]} \mathord{\left/ {\vphantom {{\partial \ln \left[ {{m \mathord{\left/ {\vphantom {m {(m + 1)}}} \right. \kern-\nulldelimiterspace} {(m + 1)}}} \right]} {\partial \ln \dot \varepsilon }}} \right. \kern-\nulldelimiterspace} {\partial \ln \dot \varepsilon }} + m \;\lt \;0\quad ,$$
where
 $\xi (\dot \varepsilon )$
is a dimensionless instability parameter. The variation of
 $\xi (\dot \varepsilon )$
with temperature and strain rate constitutes an instability map, and the flow instability is predicted where
 $\xi (\dot \varepsilon )$
becomes negative.
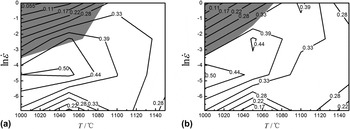
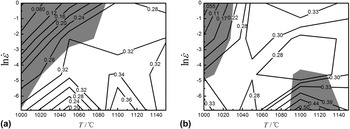
The processing maps of FGH96 in the HIPed and Sol states at strains of 0.3 and 0.6 are shown in Figs. 7 and 8. Figure 7(a) exhibits a domain in the temperature range of 1000–1100 °C and the strain rate range of 0.001–0.1 s−1 with a peak efficiency of 0.5, which are supposed to be the optimum hot working parameters for the HIPed sample at a strain of 0.3. The workability domain shrinks a little when the strain increases to 0.6 [Fig. 7(b)]. Besides, there is a flow instability area below 1080 °C with a strain rate above 0.1 s−1 for the HIPed sample. By comparison, the power dissipation efficiencies η for the Sol sample are much lower (Fig. 8). And the optimum working area moves in the higher temperature direction for Sol samples, which is in the range of 1040–1140 °C. The instability regime occurs at low temperatures with high strain rates for the Sol sample at a strain of 0.3, and the regime shifts to two areas when the strain increases to 0.6 [Fig. 8(b)].
Processing maps for HIPed sample at strains of (a) 0.3 and (b) 0.6. (The contour number represents the percentage efficiency of power dissipation. The shaded regime corresponds to flow instability.)

Processing maps for Sol sample at strains of (a) 0.3 and (b) 0.6.

It should be pointed out that the developed processing maps were based on the experimental data in the temperature range of 1000–1150 °C and strain rate range of 0.001 1 s−1. The constitutive analysis and processing maps show good agreement with the data. However, the strain rate during the actual process may be over a wider ranger, i.e., higher than 1 s−1, which needs to be investigated further. Also, using a Gleeble machine would bring some variations in the temperature control and inaccuracies in stress–strain condition resulting from the friction between the anvil and specimen.
D. Microstructural observation
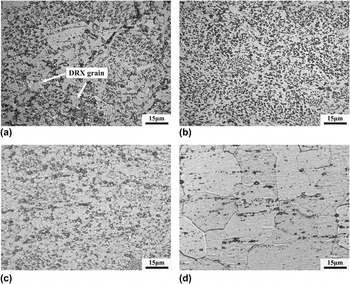
Microstructural evolution of the HIPed specimen compressed at different temperatures with a fixed strain rate of 0.1 s−1 is shown in Fig. 9. When deformed at 1000, 1050 and 1100 °C with a strain rate of 0.1 s−1, DRX occurs in the samples, refining the microstructures. With the deformed temperature increase to 1150 °C, the microstructure is mainly composed of austenite grains that are bigger than those in the low temperature deformed samples. It also can be seen that the DRX grains nucleates at the γ′ phase and the PPBs in the HIPed sample when deformed at 1000 °C [Fig. 9(a)].
Optical micrographs for the microstructure of HIPed sample deformed at (a) 1000 °C, (b) 1050 °C, (c) 1100 °C, (d) 1150 °C with a fixed strain rate of 0.1 s−1.

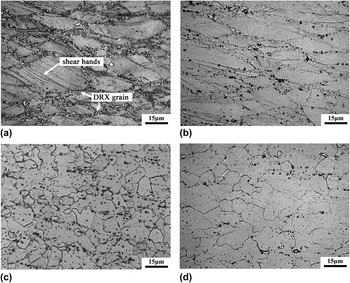
Figure 10 shows the microstructural evolution in the Sol specimen compressed at evaluated temperatures. Deformed at 1000 and 1050 °C, partial recrystallization occurs in the sample, in which the DRX grains are mainly nucleated at the austenite grain boundaries [as shown in Fig. 10(a)]. With the deformed temperature increase to 1100 and 1150 °C, the Sol samples show similar microstructural characterization with the HIPed ones. It is noteworthy that the adiabatic shear bands were observed in the deformed austenite grains at the Sol sample when deformed at 1000 °C with a strain rate of 0.1 s−1.
Optical micrographs for the microstructure of Sol sample deformed at (a) 1000 °C, (b) 1050 °C, (c) 1100 °C, (d) 1150 °C with a fixed strain rate of 0.1 s−1.

IV. DISCUSSION
PPB is a typical defect in P/M HIPed superalloys, which is attributed to the element segregation and oxygen-induced surface contamination of prealloyed powders. Reference Thamburaj, Wallace, Chari and Prakash17,Reference Marquez, L'Esperance and Koul18 Some elements such as Al, Ti, and Zr tend to form stable oxides at the powder particle surface, acting as the nuclei for the precipitation of MC-type carbides along particle boundaries during solidification and HIP process. The PPB is supposed to be composed of γ′ particles, carbides and oxides. Reference Menzies, Bricknell and Craven19 The formation of PPB reduces the element diffusion and interface combine, which will influence the plasticity and fatigue resistance. Reference Rao, Srinivas and Sarma20 After solution treatment at 1150 °C for 2 h, it contained more highly homogeneous microstructure with fine austenite grains, annealing twins, and little PPBs in this study (Fig. 1). The microstructure of the Sol sample indicates that solution treatment at 1150 °C can significantly eliminates PPBs for FGH96.
FGH96 is a kind of precipitation strengthening superalloy. The γ′ phase is the main strengthening phase, the volume of which is about 35% in the final product. The morphology of γ′ phase distribution in the HIPed specimen can be seen in Fig. 2. Similar results of the γ′ phase observation can be found in the works of Qiu et al. and Chen et al. Reference Qiu, Attallah, Wu and Andrews13,Reference Chen, Slater, Lewis, Francis, Burke, Preuss and Haigh14 After solution treatment at 1150 °C for 2 h and water quenching, the bigger γ′ phase almost disappeared in the Sol sample, which was attributed to the dissolution of elements at high temperatures. It is found that dense distribution of fine γ′ precipitates were formed in the Sol sample (Fig. 3). Recently, Whitmore et al. have confirmed that 718Plus superalloy contained a dense distribution of sub-nanometer γ′ precipitates after solution treatment and water quenching using bright and dark field observation in transmission electron microscope (TEM). Reference Whitmore, Ahmadi, Stockinger, Povoden-Karadeniz, Kozeschnik and Leitner21 The size of the sub-nanometer γ′ precipitate is about 0.3 nm. The previous works about the γ′ phase distribution conducted by Qiu et al. and Wu et al. also confirm the existence of fine γ′ precipitates within several nanometers or sub-nanometers. Reference Qiu and Andrews22,Reference Wu, Liu, Hu, Zhang, Tao and Liu23
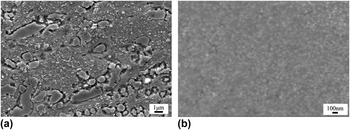
Figure 11 shows the morphology of γ′ phase distributions in the HIPed and Sol samples when deformed at 1000 °C with a strain rate of 0.1 s−1. It can be seen that there are primary, secondary, and tertiary γ′ phases in the HIPed sample, in which the amount of tertiary γ′ phase reduces due to dissolution. And it is very smooth in grain of the Sol sample with fine γ′ phase, which is a little difficult to be identified in SEM.
Morphology of γ′ phases in the (a) HIPed and (b) Sol samples deformed at 1000 °C with a strain rate of 0.1 s−1.

The flow stress curves of the HIPed and Sol samples show there was the obviously work hardening in the beginning stage of deformation. After reaching the peak stress, the stress decreased with increasing of strain. The stacking fault energy is low in FGH96, Reference Ning, Kun, Fu and Guo24 making the occurrence of cross slip and DRV difficult. Then, DRX becomes the main softening mechanism for the hot deformation of FGH96.
Although they had the same chemical compositions, the two kinds of samples showed great different deformation resistance when deformed below 1150 °C. It was believed that the hot deformation behavior of FGH96 has a closed relationship with the initial microstructures. There are certain amounts of γ′ phases in FGH96 that have pinning effects on the movement of dislocations. The effects of γ′ phase on strength are attributed to the coherency strain in precipitation strengthening and antiphase boundary, Reference Whitmore, Ahmadi, Stockinger, Povoden-Karadeniz, Kozeschnik and Leitner21 which are determined by the volume and mean radius of the γ′ phase. After solution treatment, big γ′ phase are dissolved and dense fine γ′ precipitates are formed in the Sol sample. The fine γ′ particles are of great importance for the deformation resistance, making the Sol sample show higher values than the HIP sample. Moreover, the amount of defects in the HIPed sample is supposed to be more than that in the Sol sample, which also reduces the deformation resistance in the HIPed sample. The above two reasons make the Sol sample show higher deformation resistance than the HIPed sample. With the increase of deformation temperatures, the difference between the HIPed and Sol flow stresses reduced. The reason for this is that γ′ phase is thought to be dissolved at the temperature of 1120–1130 °C. Reference Singh, Nag, Chattopadhyay, Ren, Tiley, Viswanathan, Fraser and Banerjee25 With the temperature increasing, γ′ phases are dissolved, weakening the influence of the second phase on deformation behavior. So, the flow behaviors of the two kinds of specimens became similar when deformed at 1150 °C [Fig. 4(d)].
The activation energy Q for DRX is defined as the energy that must be overcome for the formation of DRX nuclei. In this work, the activation energy for HIPed and Sol FGH96 were calculated at 1000–1100 °C. At 1150 °C, the similar flow curves indicated that they possessed the same activation energy. The calculated Q value of the HIPed sample in this article is consistent with results of Ning et al, in which the calculated Q value for the same alloy (HIPed FGH96) is 595 kJ mol−1. Reference Ning, Kun, Fu and Guo24 This value is a little higher than the previous calculated values for some other superalloys. For example, the Q for superalloy 718 obtained by Wang et al. is 467 kJ mol−1, Reference Wang, Shao, Zhen and Zhang26 and the Q for GH4169 calculated by Ning et al. is 523 kJ mol−1. Reference Ning, Fu and Chen27 Obviously, the increase of Q for FGH96 indicates that it is more difficult for this superalloy to the occurrence of DRX. By comparing the values of Q of the two kinds of specimens, it can be found that Sol sample needs much more energy for DRX. Hu et al. recommended that the Q for DRX of P/M superalloys in the Arrhenius equation should be composed of two parts. Reference Hu, Chen, Jin and Li28 One is the activation energy for Ni-based matrix Q Ni, and the other is the energy for overcoming pinning effects of γ′ particles Q γ′. The increase of activation energy for FGH96 after solution treatment is attributed to the formation of dense distribution of fine γ′ precipitates, which increases the value of Q γ′. Furthermore, the microstructural observation in the HIPed sample indicates that the DRX nuclei can be formed at the big preliminary γ′ particles and PPBs [Fig. 9(a)], which also reduces the resistance of DRX and lowers the Q value for the HIPed sample.
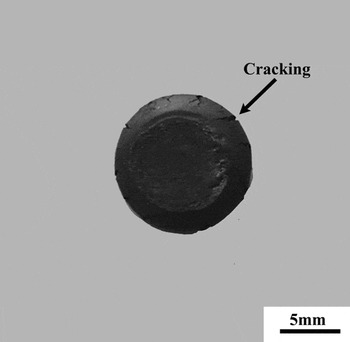
In the processing maps, the power dissipation parameters and instability regimes were presented. The domains with higher efficiency of power dissipation are supposed to be the optimum processing condition, which is related to the occurrence of DRX or DRV. It concluded that the DRX occurs at low temperatures and high strain rates for HIPed FGH96 from the flow stress curves and microstructural observation, which is consistent to the optimum workability region in the processing maps. For the Sol samples, the deformation resistances increases significantly, reducing the power dissipation parameter in which more energy is used to deform the material. The optimum workability temperatures for the Sol sample are a little higher than those for the HIPed sample. This is attributed to the easier occurrence of DRX in the HIPed sample than in the Sol sample. The processing maps also indicate that there exist instability regions during hot working (Figs. 7 and 8). Figure 10(a) shows that adiabatic shear bands form in the deformed grains at 1000 °C with strain rate of 0.1 s−1. This is a main form of flow localization in grains. Reference Zhang, Liu and Wang29 Macro shear bands are observed in previous works, Reference Ning, Yao, Lei, Guo and Fu6,Reference Wu, Liu, Hu, Wang, Zhang, Tao and Liu7 but the formation of in-grain shear bands in flow instability regions of superalloys has nearly not been reported before. Besides, edge cracking occurs in the specimen when deformed at the instability region as shown in Fig. 12 for an example.
Macrophotograph of the Sol specimen deformed at the instability region (deformed at 1000 °C in strain rate of 1.0 s−1).

V. CONCLUSIONS
In this work, the hot deformation behaviors for P/M superalloy FGH96 in the HIPed and solution states have been studied via physical experiment and microstructural characterization. The main conclusions are summarized as follows:
-
(1) The strain–stress flow curves of FGH96 in the HIPed and solution states show typical characteristics of DRX. It is found that the flow behavior is dependent on the initial states, in which the deformation resistances of specimens in the solution state are higher than those in the HIPed state at evaluated temperatures. When the temperature increases higher than the γ′ phase dissolution temperature, the differences between the two kinds of samples decrease.
-
(2) Constitutive analysis revealed that the activation energy Q for the tested FGH96 in the HIPed and solution states was 590 kJ mol−1 and 1285 kJ mol−1, respectively. It is supposed that the dense fine γ′ precipitates formed after solution treatment and the decreasing of defects increased the flow stress and the Q value of the solution-treated FGH96.
-
(3) The processing maps for FGH96 in the HIPed and solution states indicated that the power dissipation parameter η decreased after solution treatment. And the optimum hot workability regime moved to higher temperatures after solution treatment for FGH96 superalloy.
-
(4) The processing maps indicated that the instability region occurred at temperature range of 1000–1060 °C and strain rate range of 0.1–1.0 s−1 for HIPed FGH96. After solution treatment, the instability regions occurred at 1000–1070 °C/0.01–1.0 s−1 and 1100–1140 °C/0.001–0.1 s−1. Edge crackings and in-grain shear bands were observed in the specimens when deformed at instability areas. And it is recommended that the parameters in the instability regions must be avoided during the forming process for this superalloy.
ACKNOWLEDGMENTS
This work was supported by the Fundamental Research Funds for the Central Universities of China and the open fund of the Key Laboratory for Metallurgical Equipment and Control of Ministry of Education in WUHAN University of Science and Technology, China.