

Introduction
The 987P-positive bacterium is one of the enterotoxigenic Escherichia coli (ETEC) strains that cause diarrhoea in neonatal piglets (Deannystrom and Samuel, Reference Deannystrom and Samuel1994; Wang et al., Reference Wang, Jiang, Cheng, Liu and Peng2006). It was reported to cause diarrhoea through direct delivery of toxins to host enterocytes after binding to brush borders by means of adhesive proteins in fimbriae (Nataro and Kaper, Reference Nataro and Kaper1998). The adhesive effect of 987P fimbriae is the necessary prerequisite for ETEC 987P to cause diseases. Therefore, it is possible to prevent diarrhoea in piglets by effectively inhibiting that adhesion. The fimbrial protein of ETEC 987P can play a key role as a good antigen: It could effectively prevent ETEC 987P from adhering to host enterocytes by either immunizing sows with the fimbrial antigen to provide passive protection of piglets or by injecting piglets directly with high immunity antibody agents (Fang, Reference Fang1997).
Genes required for 987P fimbrial expression and attachment are clustered at one DNA locus on a plasmid (Schifferli et al., Reference Schifferli, Beachey and Taylor1990), and the gene cluster consists of eight genes (fasA to fasH) which encode eight proteins, with different molecular weights, required for fimbriation (Edwards et al., Reference Edwards, Cao and Schifferli1996; Cheng, Reference Cheng2005). FasG, located at the tip of fimbriae, directly exerts its function as an adhesin (Khan et al., Reference Khan, Johnston, Goldfine and Schifferli1996; Choi and Schifferli, Reference Choi and Schifferli2001; Zhu et al., Reference Zhu, Chen, Choi, Del Piero and Schifferli2005). A large amount of antigens are needed, either for preparing FasG protein vaccines or yielding therapeutic antibodies against FasG. However, several studies have shown that FasG couldn't be detected in purified 987P fimbriae by SDS-PAGE (Schifferli et al., Reference Schifferli, Beachey and Taylor1991; Khan and Schifferli, Reference Khan and Schifferli1994), suggesting that the ratio of FasG protein in whole fimbriae is very low, so it is difficult to isolate FasG protein from native 987P fimbriae.
The current experiment aimed at cloning and expressing the adhesion gene fasG of 987P fimbriae, and to achieve a high expression level of this gene in E. coli. According to a fasG gene sequence analysis previously reported, it was found that there were quite a lot of rare codons of E. coli in the coding region of the fasG gene (GenBank accession number: L29412). This could possibly affect the expression of the target gene. Therefore, two host strains with different tRNA profiles were used to examine the influence of rare codons on the expression of target genes, trying to improve the expression level of the target protein by optimizing the rare codons in order to provide sufficient amounts of protein antigens for producing FasG protein vaccines or therapeutic antibodies against FasG.
Materials and methods
Strains, vectors and antibodies
Escherichia coli standard strain C83916 (O20:K101, 987P:NM), which was used for fasG gene cloning, was purchased from the China Institute of Veterinary Drug Control. E. coli strain Rosseta (DE3) [F−ompT hsdS B(r B−m B−) gal dcm (DE3) pRARE (CamR)] was purchased from EMD Chemicals, Inc. (Gibbstown, New Jersey, USA). E. coli strains DH5α and BL21 (DE3) [F−ompT hsdS B(r B−m B−) gal dcm (DE3)] as well as plasmid vectors pET28a(+) and pGEX-KG were from the collection of Animal Nutrition Lab (Huazhong Agricultural University). The plasmid pMD18-T vector was purchased from TaKaRa Biotechnology Co. Ltd. (Dalian, China). Rabbit anti-FasG antiserum was produced in our laboratory and goat anti-rabbit IgG conjugated with horseradish peroxidase (HRP) was purchased from Southern Biotechnology Associates, Inc. (Birmingham, Alabama, USA).
Cloning of fasG gene
Primers were designed according to the fasG gene sequence (L29412) previously reported in GenBank:
fasG-F (forward primer): 5′-CCATGGCAATTAATAGTGGCGCGATG-3′ (26 nucleotides);
fasG-R (reverse primer): 5′-GAGCTCAAGATAGCCGAAAGAGGTGTTC-3′ (28 nucleotides).
A start codon was introduced into the forward primer (bold and italic), and the primers were used to amplify fasG gene fragment from 987P standard strain template. The underlined regions indicate the recognition sequences for NcoI (forward primer) and SacI (reverse primer). The amplified gene contained a stop codon.
The polymerase chain reaction (PCR) profile used included a denaturing step at 94°C for 4 min, followed by 35 cycles (94°C 40 s; 63.4°C 45 s; 72°C 1 min), and an extension at 72°C for 10 min. The PCR products were stored at 4°C and electrophoresed on a 2% agarose gel. The correct fragment was recovered from the gel and cloned into plasmid vector pMD18-T to construct the cloning plasmid pMD-fasG for transformation of competent DH5α cells. The colonies on the agar plates were randomly selected for plasmid preparation, and the isolated plasmid was used for restriction analysis by NcoI and SacI.
Construction of expression plasmids pET-fasG and pKG-fasG
Recombinant plasmid pMD-fasG and vector pET28a(+) were double digested by NcoI and SacI, respectively, and the fasG fragment with sticky end was ligated with pET28a(+) fragment containing the same sticky end to construct the expression plasmid pET-fasG, which was used to transform competent DH5α cells. Plasmid preparation and restriction analysis were conducted as above. The recombinant expression plasmid pKG-fasG was constructed and identified using vector pGEX-KG.
Target gene sequencing
The positive plasmid after restriction analysis was sequenced on both strands using T7 and T7-terminator primer at Beijing AuGCT Biotechnology Co. Ltd (Beijing, China).
Analysis of rare codons of the target gene
Rare codons in the target gene's coding sequence were analysed according to a codon usage database (http://www.kazusa.or.jp/codon/) (Nakamura et al., Reference Nakamura, Gojobori and Ikemura2000).
Construction of recombinant expression strains
The plasmids pET-fasG and pKG-fasG with correct open reading frames were transformed into BL21 (DE3) and Rosseta (DE3), respectively. The colonies on the plates were indentified by PCR.
Induction of target proteins and Western blot analysis
The recombinant expression strains with correct expression plasmids were incubated under shaking at 37°C until the OD600nm reached 0.6, then induced by 1 mmol/l isopropyl β-d-thiogalactopyranoside (IPTG) to yield proteins. The induced proteins were detected using SDS-PAGE. Induced strains were fragmented by ultrasonic waves, and supernatant and precipitate separated.
The induced strains were also analysed using Western blots. The primary antibody rabbit anti-FasG antiserum (dilution 1:300) and secondary antibody goat anti-rabbit IgG conjugated with HRP (dilution: 1:5000) were used.
The experimental operations above were all according to Sambrook et al. (Reference Sambrook, Fritsch and Maniatis2002).
Results
Cloning of fasG gene
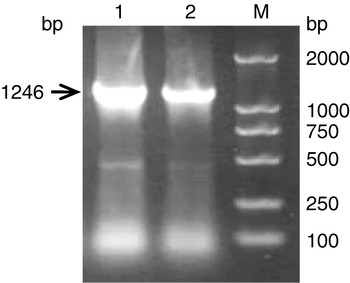
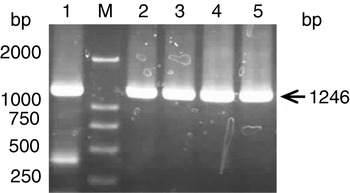
The fasG gene fragment was amplified from 987P standard strain template using a primer pair containing restriction sites. The PCR product corresponded to a 1246 bp band (Fig. 1).
PCR product of fasG. Lanes: 1 and 2, PCR product of fasG; M, DL2000 marker.

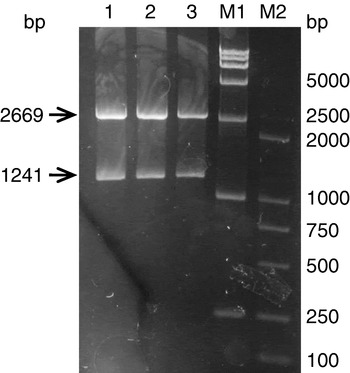
Two fragments were obtained from double digestion of pMD-fasG, with the expected size of 2669 and 1241 bp (Fig. 2).
Identification of pMD-fasG by restriction enzyme digestion. Lanes: 1–3, products of digestion of pMD-fasG; M1, DL15000 marker; M2, DL2000 marker.

Construction of expression plasmids pET-fasG and pKG-fasG
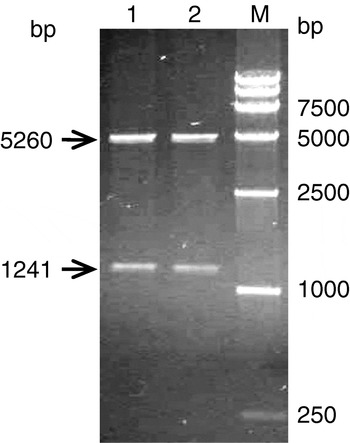
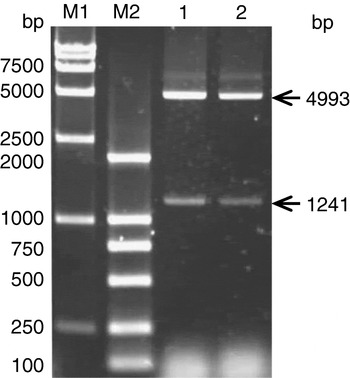
The recombinant plasmids pET-fasG and pKG-fasG were identified by double digestion. The results of the double digestion of pET-fasG showed that the vector fragment was 5260 bp, and the target gene fragment was 1241 bp (Fig. 3); The double digestion of pKG-fasG resulted in 4993 bp and 1241 bp bands, respectively, for vector and target gene fragments (Fig. 4). Results from both double digestions were as expected.
Identification of pET-fasG by restriction enzyme digestion. Lanes: 1 and 2, products of pET-fasG digested by enzyme; M, DL15000 marker.

Identification of pKG-fasG by restriction enzyme digestion. Lanes: 1 and 2, products of pKG-fasG digested by enzyme; M1, DL15000 marker; M2, DL2000 marker.

Target gene sequencing
The sequencing was performed on both strands, and the results were compared with the gene sequence from NCBI using the BLAST program. Results showed that the homology of the fasG sequences in pET-fasG and pKG-fasG with fasG from GenBank reached 100%.
Analysis of rare codons of the target gene
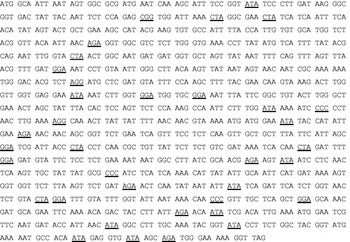
Rare codons used in target gene's coding sequence from the sequencing result were analysed according to a codon usage database and the results are presented in Fig. 5.
FasG coding sequence showing rare codons (DNA) (underlined).

The rare codons were counted, as presented in Table 1. A total of 36 rare codons were found out of the 375 codons (up to 9.6%) in the coding region of the target gene.
Analysis of rare codons

Construction of recombinant expression strains
The plasmids pET-fasG and pKG-fasG with correct open reading frames were transformed into BL21 (DE3) and Rosseta (DE3), respectively. The colonies on the plates were indentified using colony PCR (Fig. 6).
Identification of clones by PCR. Lanes: 1, PCR product of reference strain; 2, PCR product of pET-fasG BL21 (DE3); 3, PCR product of pET-fasG Rossetta (DE3); 4, PCR product of pKG-fasG BL21 (DE3); 5, PCR product of pKG-fasG Rossetta (DE3); M, DL2000 marker.

Induction of target proteins and Western blot analysis
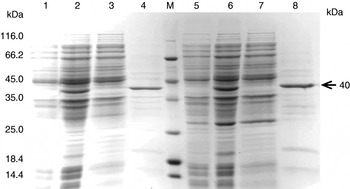
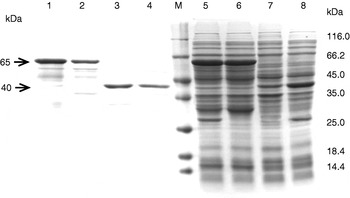
The recombinant expression strains with correct expression plasmids were induced to yield proteins. A clear protein band of 40 kDa appeared both in pET-fasG BL21 (DE3) and pET-fasG Rossetta (DE3), which were induced by IPTG using SDS-PAGE, and the protein molecular weight was as expected (Fig. 7). The expression level of protein induction of pET-fasG BL21 (DE3) was about 8% of the whole cell protein, and that of pET-fasG Rossetta (DE3) was 14%, higher than pET-fasG BL21 (DE3).
SDS-PAGE analysis of recombinant clones and solubility analysis of expression product. Lanes: 1, pET-fasG BL21 (DE3) control before induction; 2, pET-fasG BL21 (DE3) product after induction; 3, soluble protein of pET-fasG BL21 (DE3) after treatment; 4, insoluble protein of pET-fasG BL21 (DE3) after treatment; 5, pET-fasG Rossetta (DE3) control before induction; 6, pET-fasG Rossetta (DE3) product after induction; 7, soluble protein of pET-fasG Rossetta (DE3) after treatment; 8, insoluble protein of pET-fasG Rossetta (DE3) after treatment; M, protein molecular weight marker.

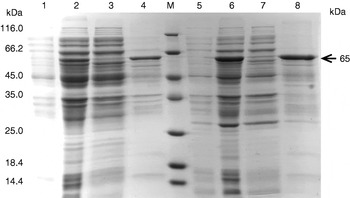
A protein band of 65 kDa appeared both in pKG-fasG BL21 (DE3) and pKG-fasG Rossetta (DE3) using SDS-PAGE, and the molecular weight of the protein was as expected (Fig. 8). The expression level of pKG-fasG BL21 (DE3) protein was about 12% and that of pKG-fasG Rossetta (DE3) was 14%, higher than pKG-fasG BL21 (DE3).
SDS-PAGE analysis of recombinant clones and solubility analysis of expression product. Lanes: 1, pKG-fasG BL21 (DE3) control before induction; 2, pKG-fasG BL21 (DE3) product after induction; 3, soluble protein of pKG-fasG BL21 (DE3) after treatment; 4, insoluble protein of pKG-fasG BL21 (DE3) after treatment; 5, pKG-fasG Rossetta (DE3) control before induction; 6, pKG-fasG Rossetta (DE3) product after induction; 7, soluble protein of pKG-fasG Rossetta (DE3) after treatment; 8, insoluble protein of pKG-fasG Rossetta (DE3) after treatment; M, protein molecular weight marker.

The samples in Fig. 9 were adjusted to same quantity of bacterial cells before loading. The induced strains were fragmented by ultrasonic waves to separate soluble and insoluble protein. After fragmention, soluble protein was dissolved in the buffer, and insoluble protein precipitated. All proteins induced from the four expression strains mainly existed in insoluble inclusion bodies, and their ratios in these bodies were estimated to be 75% (Fig. 9).
SDS-PAGE analysis of recombinant clones and solubility analysis of insoluble protein of expression product. Lanes: 1, pKG-fasG Rossetta (DE3) after treatment; 2, insoluble protein of pKG-fasG BL21 (DE3) after treatment; 3, insoluble protein of pET-fasG Rossetta (DE3) after treatment; 4, insoluble protein of pET-fasG BL21 (DE3) after treatment; 5, pKG-fasG Rossetta (DE3) product after induction; 6, pKG-fasG BL21 (DE3) product after induction; 7, pET-fasG BL21 (DE3) product after induction; 8, pET-fasG Rossetta (DE3) product after induction; M, protein molecular weight marker.

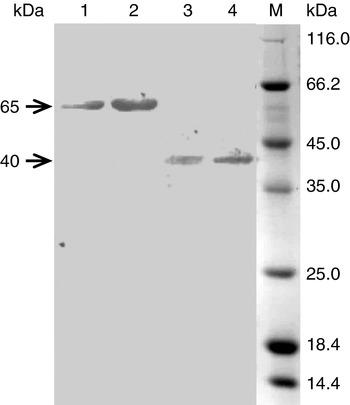
Western blot analysis was performed to identify the induced proteins, and a clear hybrid band of 40 kDa appeared in both pET-fasG BL21 (DE3) and pET-fasG Rossetta (DE3) lanes (Fig. 10), showing that the 40 kDa protein was the target protein. Also, a hybrid band of 65 kDa was observed in both pKG-fasG BL21 (DE3) and pKG-fasG Rossetta (DE3) lanes (Fig. 10), which indicated that the 65 kDa protein was the target protein.
Western blot analysis of induced pKG-fasG BL21 (DE3) (1), pKG-fasG Rossetta (DE3) (2), pET-fasG BL21 (DE3) (3), and pET-fasG Rossetta (DE3) (4). Lane M, protein molecular weight marker.

Discussion
The expression of heterologous genes in E. coli is mainly controlled from the transcription level and translation level. In the current experiment, expression vectors with T7 strong promoters were used to obtain a high transcription level. The experiment mainly focused on the optimization of rare codons to enhance the efficiency of translation initiation and elongation.
Most amino acids are encoded by more than one codon, and analysis of E. coli codon usage reveals that several codons are underrepresented. In particular, Arg codons AGA, AGG, CGG, CGA, Ile codon AUA, Leu codon CUA, Gly codon GGA and Pro codon CCC are rarely used, according to the codon usage database http://www.kazusa.or.jp/codon/ (Nakamura et al., Reference Nakamura, Gojobori and Ikemura2000). Although the presence of a small number of rare codons often does not severely depress target protein synthesis, heterologus protein expression can be very low when a gene encodes clusters of, and/or numerous, rare E. coli codons (Zhang et al., Reference Zhang, Zubay and Goldman1991; Gustafsson et al., Reference Gustafsson, Govindarajan and Minshull2004).
Our target gene contained numerous rare E. coli codons, which attained 9.6% of the whole codons in the coding sequence (Table 1). Therefore, two different host strains were chosen to express target protein, trying to reduce the influence of rare codons on the expression of target protein. The Rosetta (DE3) strains, which are commercial expression strains from EMD Chemicals Inc., introduce a chloramphenicol resistant plasmid (pACYC backbone) into the strains based on BL21 (DE3), and tRNAs for the rare codons AUA, AGG, AGA, CUA, CCC and GGA from their native promoters can be expressed. The result of this experiment showed that the expression levels of target proteins in Rossetta (DE3) were higher than those in BL21 (DE3), either using pET-fasG or pKG-fasG, which indicated that the expression level of a target protein containing a large amount of rare codons could be enhanced by supplying extra tRNAs for the rare codons.
Several laboratories have shown that the yield of protein, whose genes contain rare codons, can be dramatically improved when the cognate tRNA is increased within the host (Seidel et al., Reference Seidel, Pompliano and Knowles1992; Rosenberg et al., Reference Rosenberg, Goldman, Dunn, Studier and Zubay1993). Novy et al. (Reference Novy, Drott, Yaeger and Mierendorf2001) used Rosetta (DE3) to express a target gene with rare codons, and found that the expression level was strongly improved compared to BL21 (DE3). During the translation process, a tRNA charging its amino acid attaches to the A binding site in the ribosome. If the tRNA attaching to the A site corresponds to the codon, the synthesis and elongation of the peptide chain will be continued. The tRNA population closely reflects the codon bias in E. coli. The correct amino acid will be quickly incorporated into the peptide chain when the codon has abundant tRNA pools. However, a codon with insufficient tRNA pools will take longer to find the correct tRNA (Grosjean and Fiers, Reference Grosjean and Fiers1982), which will lead to translational stalling (Sung et al., Reference Sung, Zahab and Barbier1991). Supplying extra tRNAs for the rare codons can increase the tRNA population, which would ease the translational stalling and be very beneficial to protein expression.
Acknowledgements
This work was supported by Program for New Century Excellent Talents in University (No. NCEP-04-0732), the Provincial ‘11th Five-Year-Plan’ Key Science and Technology Program of Hubei (No. 2006AA201B03) and the Shenzhen Science and Technology Foundation of China.