
Introduction
Materials that either absorb or reflect near-infrared (NIR) radiation have numerous applications. This type of material, often used as an additive in polymers, can be found in a variety of products and places that are part of our daily lives: in cars, mobile phones, plastic bottles, buildings, passports….[Reference Franke1–4] It is an important market for many businesses due to the large number of applications, such as in heat retention films, laser marking and laser welding, IR security inks, 3D-Moulded Interconnect Devices (3D-MID) and glazing, amongst others.
For the particular case of laser-marking, where a laser interacts with a surface that by itself would insufficiently absorb NIR radiation, these additives are appropriately dispersed (e.g. in a polymer or coated film) and function as absorbers for the laser light.[Reference Wissemborski and Klein5] Dispersed in security inks, these types of additives can be found in banknotes, which include numerous security features such as IR marks, easily detected by commercial banknote detectors. The color of these additives is an important property to be considered before their use. For some applications, the color of the additive is not determinant but for others, it is necessary to have flexibility in the coloring. Regarding the elemental composition of these additives, in the last few years, there has been a trend in the industry towards the use of compounds that are free of toxic metals (such as Cd, Ni or Sb) and also a need to keep production costs low. All these requirements demand new materials that should be easy to manufacture.
Copper hydroxyphosphates have attracted attention due to their applications mainly in catalysis, but also in material and intercalation chemistry. A number of copper hydroxyphosphates can be found in nature. In particular, Cu2PO4OH (libethenite), which shows a strong absorption in the NIR region, has been reported as an effective photocatalyst[Reference Wang, Huang, Ma, Wang, Qin, Zhang, Dai and Whangbo6, Reference Zhao, Teng, Xu, Liu, Yang, Zhang and Yao7] as a laser additive in the patent literature[8] and as an additive for laser direct structuring.[Reference Zhang, Zhou, Weng and Zhang9] Cu2PO4OH belongs to the orthorhombic crystal system, with space group Pnnm and cell parameters a = 8.062, b = 8.384, and c = 5.881 Å (JCPDS 83-2264). It is possible to synthesize libethenite at pHs ranging between 2.5 and 7 using hydrothermal or solvothermal conditions.[Reference Cho, Kim, Lee, Kwak, Bae, Noh, Yoon, Jung, Kim and Hong10, Reference Hu, Zheng, Li, Zhang and Ma11] However, from an industrial point of view, the avoidance of pressurized containers such as autoclaves, or flammable solvents such as alcohols and/or other types of organic reagents and of heating steps during the synthesis procedures is desired to simplify chemical processes and reduce energy costs. Therefore, in this present work, we report on the synthesis of several libethenites with different aging conditions. One of the samples was synthesized without heating or pressurized containers and was later upscaled. As an additive, Cu2PO4OH was also incorporated in an IR ink used as a feature to test its application in security printing. In another experiment, the additive was dispersed in two types of polymer and tested for the laser-marking of plastics.
Experimental
Synthesis of Cu2PO4OH
Details about chemicals and materials can be found in the Supplementary Material (SM). Appropriate amounts of Cu(NO3)2·2.5 H2O and NH4H2PO4 (ratio 2:1) were dissolved separately in deionized H2O and stirred for 30 min. The phosphate solution was slowly added to the copper solution and left to stir vigorously. NH3 solution was added dropwise until pH was 6.9. Afterward, samples were aged under different conditions. Sample Lib01 was transferred into a Teflon-lined stainless-steel autoclave of 125 mL capacity and heated at 150°C for 6 h. Sample Lib02 was also aged using the same autoclave and was heated at 180°C for 6 h. Sample Lib03 was aged in a 250 mL round-bottom flask attached to a condenser and heated at 60°C for 24 h with vigorous stirring. Sample Lib04 was left to stir in a beaker at room temperature for 16 h. Afterward, the precipitates were recovered and washed several times by centrifugation at 4750 rpm multiple times before being dried in an oven at 80°C overnight.
Sample Lib04 was additionally calcined in a furnace at 400°C for 2 h at 2°/min in the air. This sample is labeled Lib05. Sample Lib04 was easily scaled-up in the laboratory facilities, adapting the experimental procedure mentioned above with larger equipment and glassware. The upscaled sample was chosen for the application trials after calcination at 400°C.
IR security ink tests
Appropriate amounts of the IR-transparent ink and libethenite pigment were introduced in a disposable cup together with three high-density alumina 12 mm beads. The contents were mixed at 1200 rpm for 5 min in a Speedmixer (DAC 150 FVZ, Hauschild). This operation was repeated several times to ensure proper milling, dispersion grade, and good ink consistency. The resulting inks were coated on cardboard using an Orange Proofer (IGT Testing Systems Pte. Ltd.) and samples were left to dry overnight at room temperature. The optical properties of the coated inks were checked with a ultraviolet-visible- NIR (UV-VIS-NIR) spectrophotometer.
Laser-marking tests
Low-density polyethylene plates were produced by injection molding (Hampton Colours Ltd., UK) by dispersing 1% of the additive in the polymer composition. Soft polyvinyl chloride (PVC) plates were produced in-house starting from the precursor soft PVC formulation. An appropriate amount of the formulation was mixed with the additive at 1200 rpm for 10 min in the Speedmixer. Afterward, the mixture was coated on a metallic surface to form a film. The film was cured at 115°C for 25 min in an oven. Finally, the film was left to cool down before being removed from the metallic surface by using a palette knife. All tests plates were laser marked (Nd:YVO4 laser) using a lab-size laser-marking instrument (Zeichenlasermaschine Photonenwerke, Trumpf). Testing plates were evaluated visually and by the use of a microscope (GX microscope, CAM H5).
Characterization
The crystal structure of the powder samples was analyzed by x-ray diffraction using Cu Kα radiation (Bruker D8 Advance diffractometer). Infrared (IR) spectra were recorded on a Nicolet iS10 from ThermoScientific with Smart iTX (ATR). Raman analysis was performed on a DXR 2 Raman Microscope (Thermofisher). BET surface areas were calculated by using the Brunnauer, Emmet and Teller method on the adsorption data recorded on a Micromeritics TriStar II Surface area and Porosity analyzer. Particle morphology was analyzed with a scanning electron microscope (SEM) Hitachi S4500. SEM-energy dispersive x-ray (EDX) analysis was done with a TM3000 microscope (Hitachi). The optic properties of the samples were checked by a UV/VIS/NIR Spectrometer Lambda 750S from Perkin Elmer with a 100 mm Int. Sphere.
Results and discussion
Characterization of Cu2PO4OH
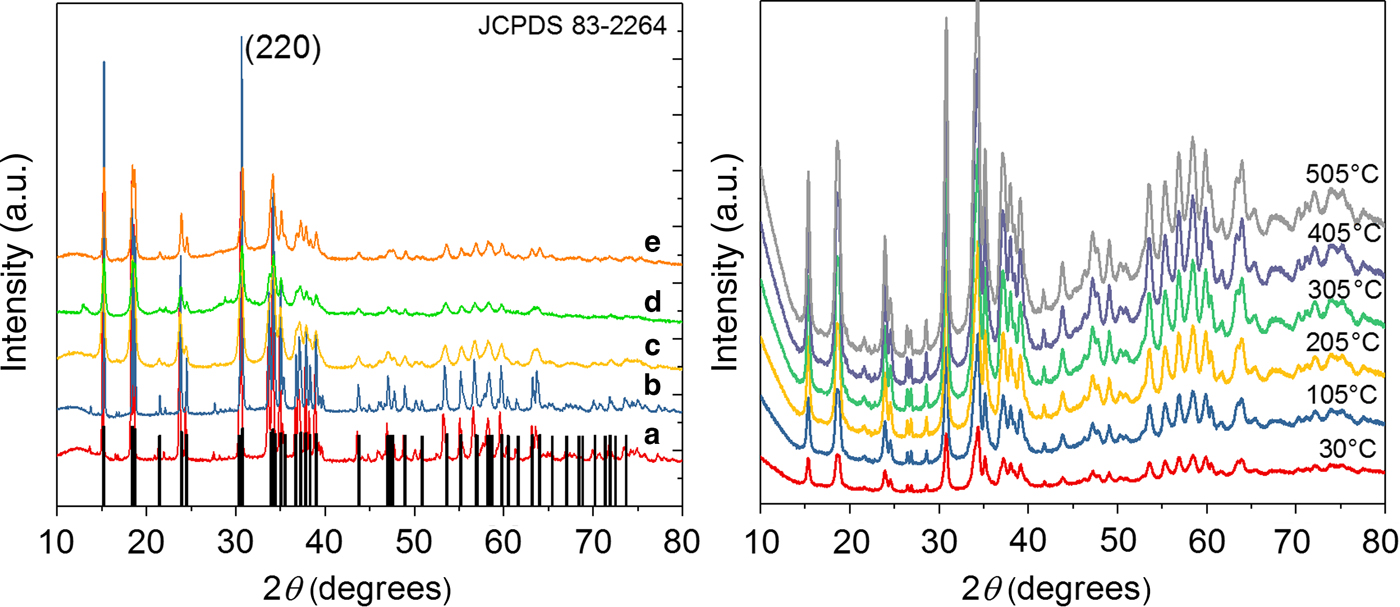
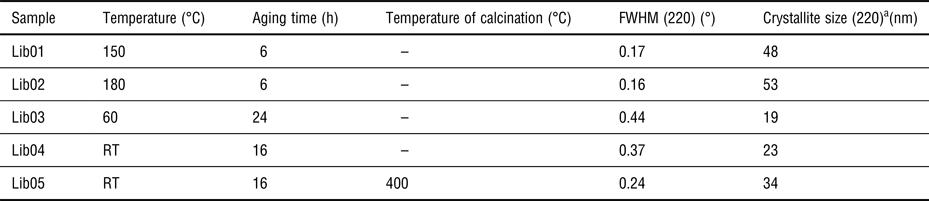
All Cu2PO4OH samples are summarized in Table I. Figure (1a) shows the x-ray powder diffractograms of libethenite samples synthesized at pH 6.9 with variations in their aging treatments. It was possible to identify the orthorhombic Cu2PO4OH phase in all samples (JCPDS 83-2264). Samples Lib01 and Lib02 that were aged using an autoclave at 150 and 180°C, respectively, showed better-defined peaks with lower values of full width at half maximum (FWHM) compared with the rest of the samples (Table I). The effect of autogenous pressure on the crystallinity of the samples and crystal growth is well known, which was observed for samples Lib01 and Lib02. It was also possible to observe the appearance of an extra minor phase believed to be a copper phosphate precipitate (JCPDS 22-1038), but the low intensity of the peaks hindered phase assignation. The reason for the appearance of this extra copper phosphate phase could be related to different precipitation rates of the copper species. The values for crystallite sizes were calculated for all samples (Table I) using Scherrer's equation and the (220) peak.[Reference Klug and Alexander12] In general, larger values of crystallite size belong to samples aged with the autogenous pressure that favors crystal growth. Information regarding cell parameters can be found in the SM. When additives are added into polymers for Laser sensitive applications, they need to be stable in terms of chemical structure and composition above the temperatures where the plastic is being processed. Although temperatures may vary depending on the nature of the plastic,[13] in general, additives should have good thermal stability up to 300°C.[14, Reference Vasile15] The thermal stability of Cu2PO4OH was checked by high-temperature x-ray powder diffraction (XRD) by heating a Lib03 sample from room temperature (RT) to 505°C and measuring the diffractograms in-situ every 30°C [Fig. (1b)]. In general, no significant changes were observed in the diffractograms as the temperature was raised. The shape and position of the peaks remained unchanged and no extra phases were detected during the heating process. The thermal stability of Cu2PO4OH observed in the high-temperature diffractogram confirms that copper hydroxyphosphate can be dispersed in a wide range of polymers for laser-marking purposes without suffering degradation.
(a) Diffractogram of (a) Lib01, (b) Lib02, (c) Lib03, (d) Lib04, (e) Lib05 samples. (b) High-temperature diffractogram of Lib03 sample, recorded from RT until 505°C.

Summary of Cu2PO4OH samples and XRD crystallographic data

a Calculated by Scherrer's equation.
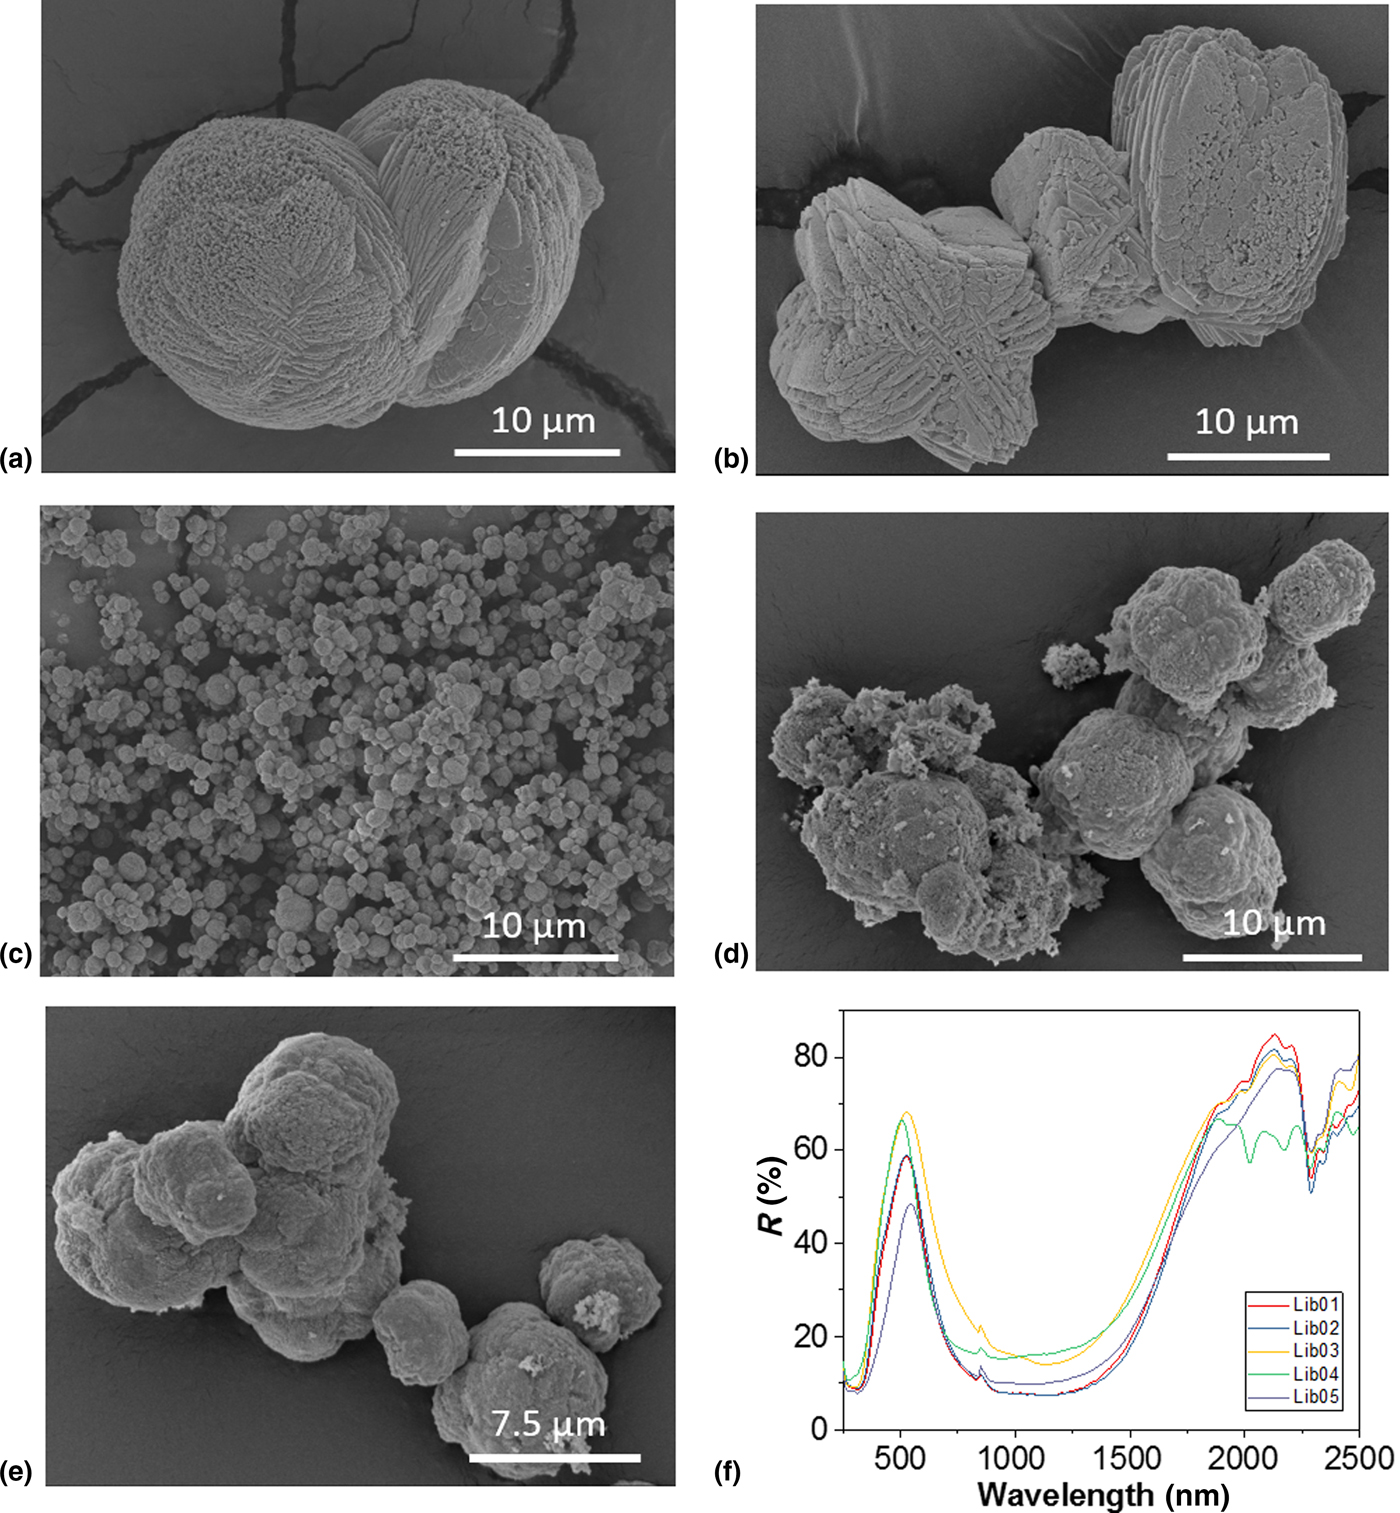
The morphology of the samples was checked by SEM [Fig. (2)] and particle sizes determined.[Reference Schneider, Rasband and Eliceiri16] In general, the morphology of Cu2PO4OH samples exhibited agglomerated particles forming spheres, which is expected when using a pH close to 7 during the synthesis. The size of these aggregated spheres differed greatly from the aging conditions of each sample.[Reference Cho, Kim, Lee, Kwak, Bae, Noh, Yoon, Jung, Kim and Hong10, Reference Xu, Jiao and Chen17] Samples Lib01 and Lib02 [Figs. 2(a) and 2(b), respectively], presented walnut-shaped spheres with some differences. While sample Lib01 displayed an agglomeration where sheets could be observed in the walnut-shape spheres, sample Lib02 exhibited edges forming a cross and angular shapes within the spheres. Sizes for these spheres ranged from 13 to 21 µm for sample Lib01 and from 7 to 20 µm for sample Lib02. Cotton-like sphere morphology was obtained for samples Lib03, Lib04, and Lib05 [Figs. 2(c), 2(d) and 2(e), respectively]. The size of these spheres decreased dramatically for sample Lib03 compared with samples aged using an autoclave. It was observed that these spheres were formed by an agglomeration of small rounded particles with sizes ranging from 0.6 to 1.6 µm. Samples Lib04 and Lib05 showed spheres of different sizes that ranged between 4 and 11 µm and 4 and 10 µm, respectively. It is possible to observe a slight decrease in the size of these spheres for sample Lib05 compared with Lib04 sample, after calcination at 400°C. During the synthesis, the pH and [Cu2+]/[PO43−] ratio was kept constant for all samples. Differences during crystallization and crystal growth are therefore attributed to temperature, pressure, and time applied during the synthesis. By changing these conditions, differences in the architecture of copper hydroxyphosphates can be observed.[Reference Rudolph18] While the mechanism of Cu2PO4OH has been established and it is clear that the morphology is strongly dependent on the concentration of NH4+ ions as well as on the Cu2+ concentration and on the type of solvents, the role of temperature is much less studied. We believe that heating is normally used to avoid the formation of the well-known copper complex [Cu(NH3)42+],[Reference Cho, Kim, Lee, Kwak, Bae, Noh, Yoon, Jung, Kim and Hong10] but interestingly this complex was not observed in sample Lib04, synthesized at RT. When this sample was upscaled and the concentration of the starting reagents increased to reduce the use of water, we could then observe the formation of a small dark blue supernatant liquid, which was discharged when washing the solid. When the crystal structure of the upscaled sample was checked no other phase was detected. An increase in the concentration led to spheres with a smaller size compared with sample Lib05, with sizes that ranged from 0.8 to 2 µm. Additional characterization for this upscaled sample can be found in the SM.
SEM micrographs of (a) Lib01 (×3k), (b) Lib02 (×3k), (c) Lib03 (×3k), (d) Lib04 (×3k) and (e) Lib05 (×4k) samples, (f) reflectance spectra of libethenite samples.
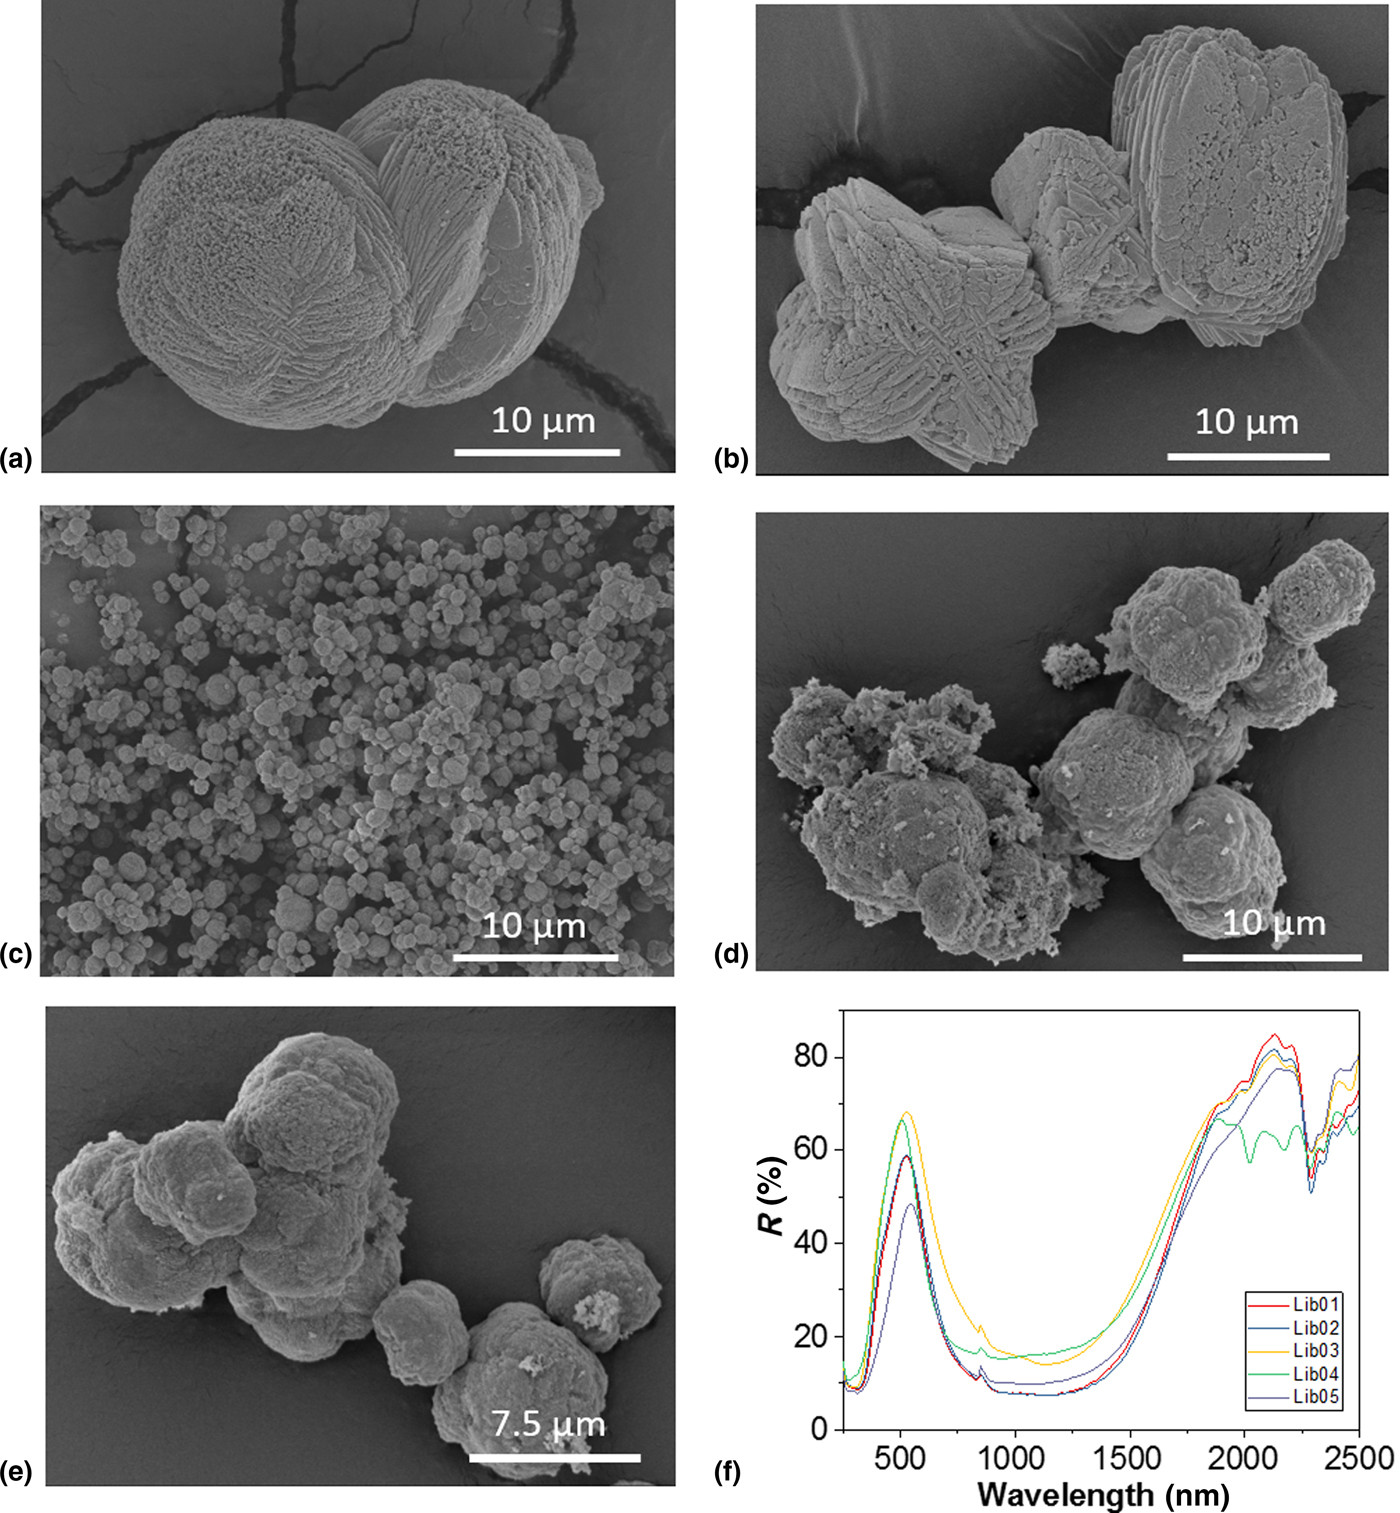
The optical properties were checked by the measurement of the UV-Vis-NIR diffuse reflectance spectrum of the powdered samples [Fig. (2f)]. A very wide reflection curve centered at around 1125 nm appears in all samples, which is derived from the crystal structure of Cu2PO4OH and the Cu coordination. Differences in the reflectance spectra intensities can be explained by differences in the morphology of the samples and cell parameters, whose values can be correlated with the energy band gap.[Reference Cho, Kim, Lee, Kwak, Bae, Noh, Yoon, Jung, Kim and Hong10] Photoabsorption was higher for samples (Lib01 and Lib02) with walnut-shaped sphere morphology. Information regarding the origin of the NIR absorption based on density functional calculations for this compound has been previously reported.[Reference Li, Dai, Ma, Zhu and Huang19] The wide band that appears between 500 and 2000 nm in all samples is a superposition of different minor bands. Complete band analysis of this deconvoluted wide band can be found elsewhere according to the particular Cu(II) symmetry in Cu2PO4OH.[Reference Gangi Reddy, Ramasubba Reddy, Siva Reddy, Lakshmi Reddy and Jagannatha Reddy20] Details about FTIR, Raman, N2 physisorption, and SEM-EDX characterization can be found in the SM.
The synthesis conditions of sample Lib04, which did not use any type of heating and successfully yielded the Cu2PO4OH phase, are very interesting from an industrial point of view. Unlike other reported syntheses that use autoclaves,[Reference Rudolph18, Reference Xiao, Sun, Meng, Yu, Yuan, Xu, Song, Jiang and Xu21, Reference Zhan, Li and Chen22] organic reagents[Reference Xu, Zhang and Liu23, Reference Fu, Wang, Wu, Wang, Wang, Wang, Zhang and Qiu24] and/or surfactants,[Reference Han, Li, Xu, Yuan, Wang and Yu25] this simplified synthesis is much more energy efficient and it also avoids the cost of pressurized equipment. For these reasons, we successfully upscaled sample Lib04 to 300 g using standard laboratory equipment. To the best of our knowledge, the synthesis of libethenite at RT has never been reported before.
IR security ink trials
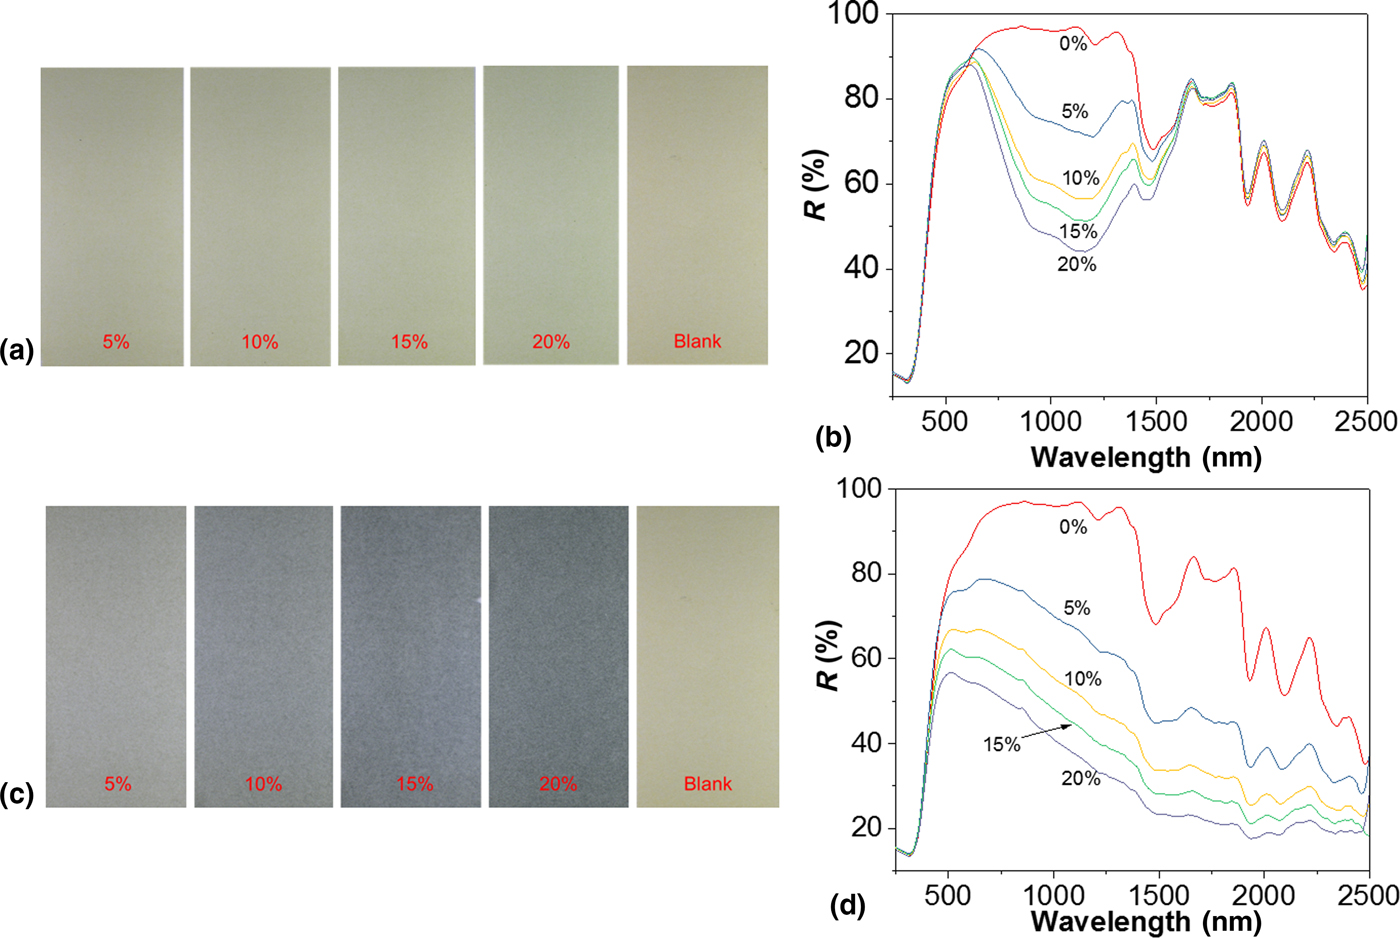
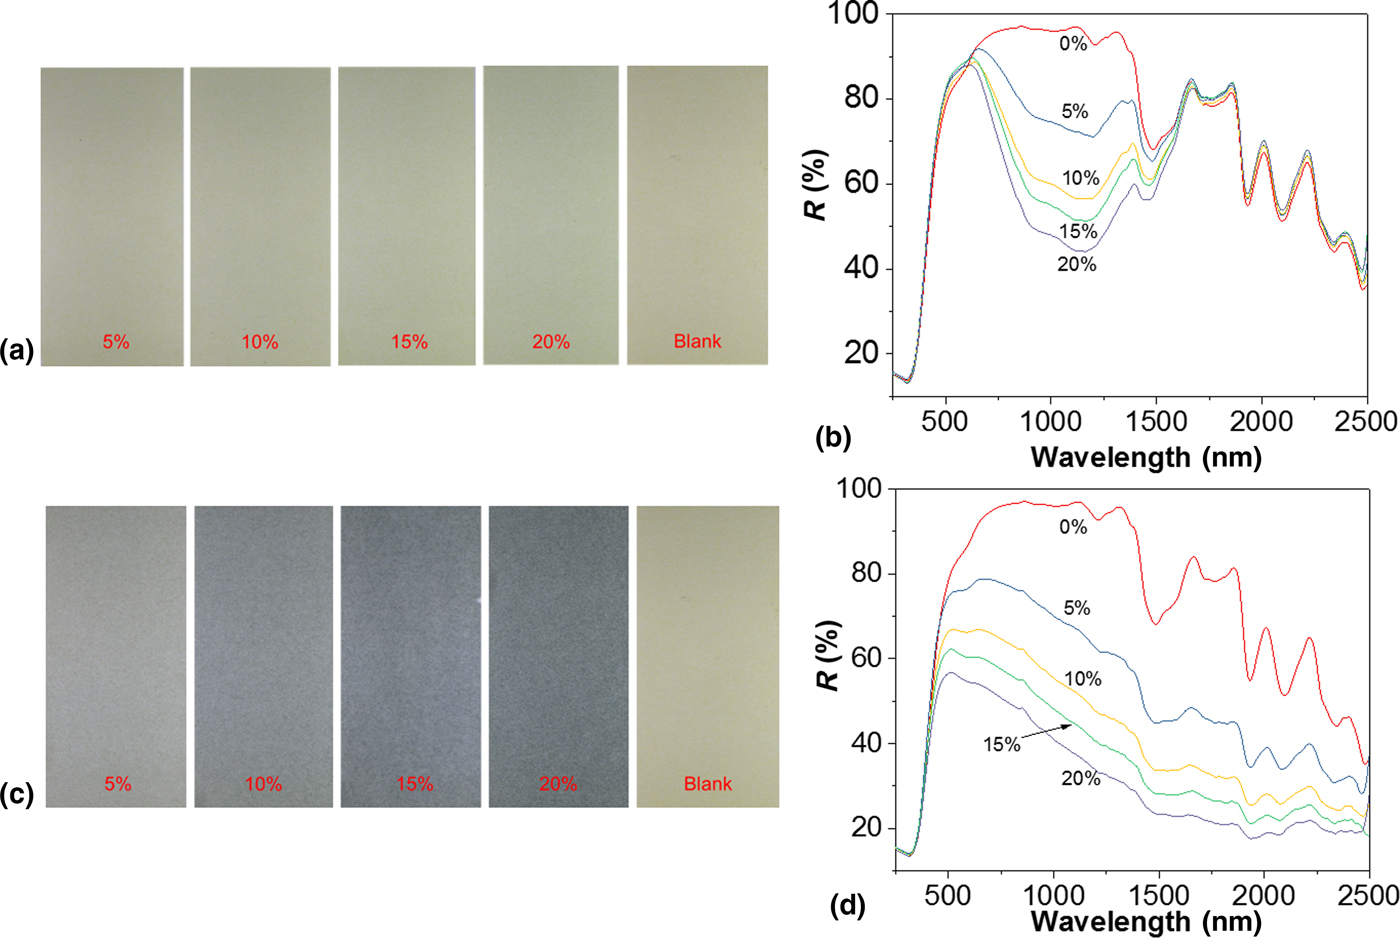
Banknotes incorporate numerous security features such as 3D images, intaglio printing, holograms, several types of inks, UV, and magnetic features, and logos with rolling color effects, in order to prevent counterfeiting. Banknotes incorporate IR inks which either absorb or reflect IR radiation and are identifiable by standard banknote detectors. In order to test the performance of libethenite as security additive, we blended copper hydroxyphosphate in an additive-free standard ink used in banknotes. The ink is transparent in the region between 700 and 1130 nm. Printing tests were performed by varying the percentage of additive incorporated in the range 0–20% [Fig. (3a)]. A blank was printed and the spectrum showed, in effect, no bands in the region between 700 and 1130 nm [Fig. (3b)]. It is difficult to assign ink bands, probably overlapped, in the region between 1200 and 2500 nm due to the fact that the exact composition of the ink is unknown to us. All tests with the additive in the formulation resulted in prints which showed a strong absorption in the region 630–1400 nm [Fig. (3b)], in agreement with the additive-only spectrum [Fig. S5(d)]. It is possible to correlate the increase of the additive in the composition with the increase in the band signal centered at 1140 nm. Ideally, a good additive for IR security inks should have a good performance when being used in low concentration in the ink formulation, in quantities of 10% or less. In addition to this, the CIE coordinates are also significant for the application, as additives with light colors are preferred over dark ones. We have calculated the L* a* b* coordinates with the spectrophotometer (Table II and SM) and compared the performance of this additive with a commercial product, StanoStat CPM10C [Figs. 3(c) and 3(d)]. While the spectra show that the NIR absorption of CPM10C is slightly better at the same percentages compared with the Cu2PO4OH additive, there are significant differences in the coloration of the test prints, as observed by the L* a* b* values for this material. Notorious differences in L* and b* parameters indicate that the color is dark blue, in comparison with a light green color for printing tests of copper hydroxyphosphate. The broad band between 700 and 1130 nm for this compound can function as a fingerprint band which can be easily detected by available commercial detectors. In addition, the L* a* b* coordinates exhibit desirable values for IR security inks, therefore suggesting the potential of this additive as a security feature in banknotes.
(a) Print tests of the security IR ink with Cu2PO4OH (0%, 5%, 10%, 15%, and 20%), (b) reflectance spectra of print tests of the security IR ink with Cu2PO4OH, (c) print tests of the security IR ink with StanoStat CPM10C (0%, 5%, 10%, 15%, and 20%), (d) reflectance spectra of print tests of the security IR ink with StanoStat CPM10C.
CIE L* a* b* coordinates

Recent findings about antibacterial properties of libethenite and other copper compounds[Reference Zhao, Pang, Li, Li, Yan, Ma, Li, Chen, Zhang and Zheng26–Reference Zhang, Tang, Li and Tang28] could open the way towards the incorporation of Cu2PO4OH as an additive in antibacterial inks for packaging purposes.[Reference Mahalik and Nambiar29, Reference Cloutier, Mantovani and Rosei30]
Laser-marking tests
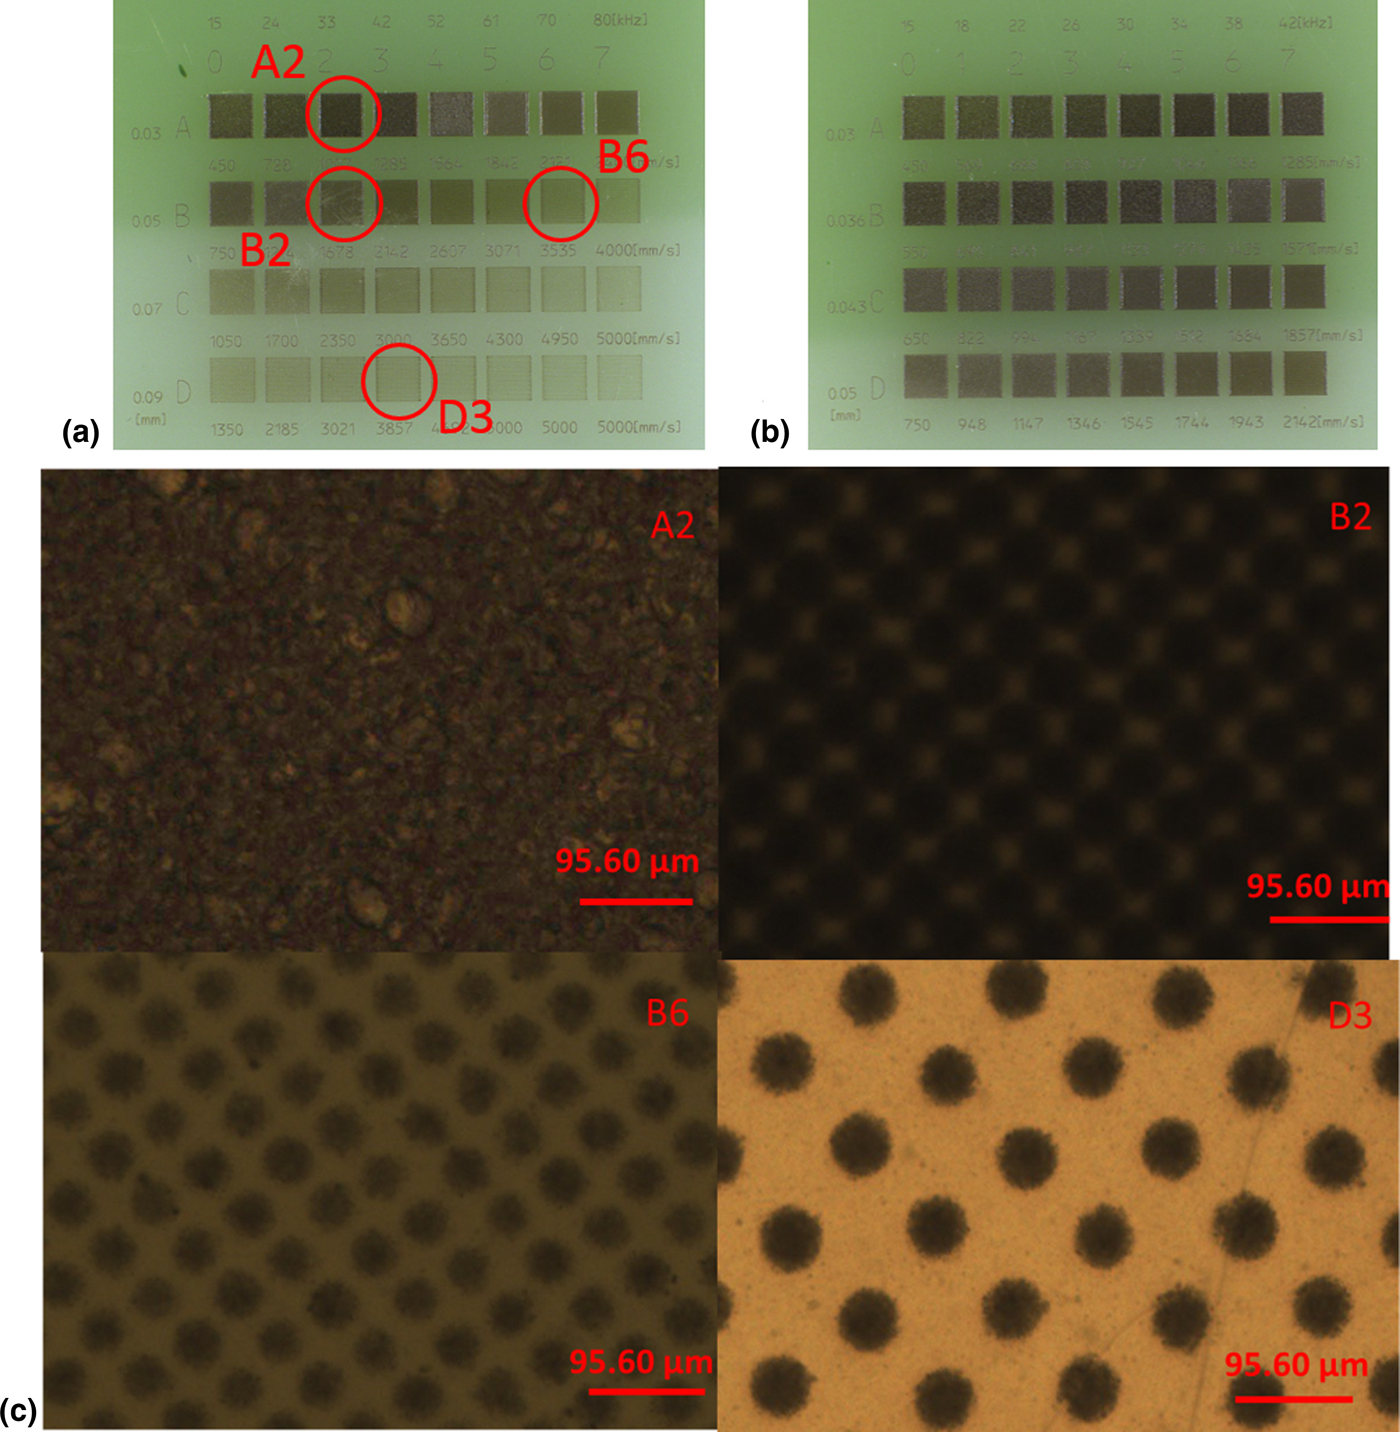
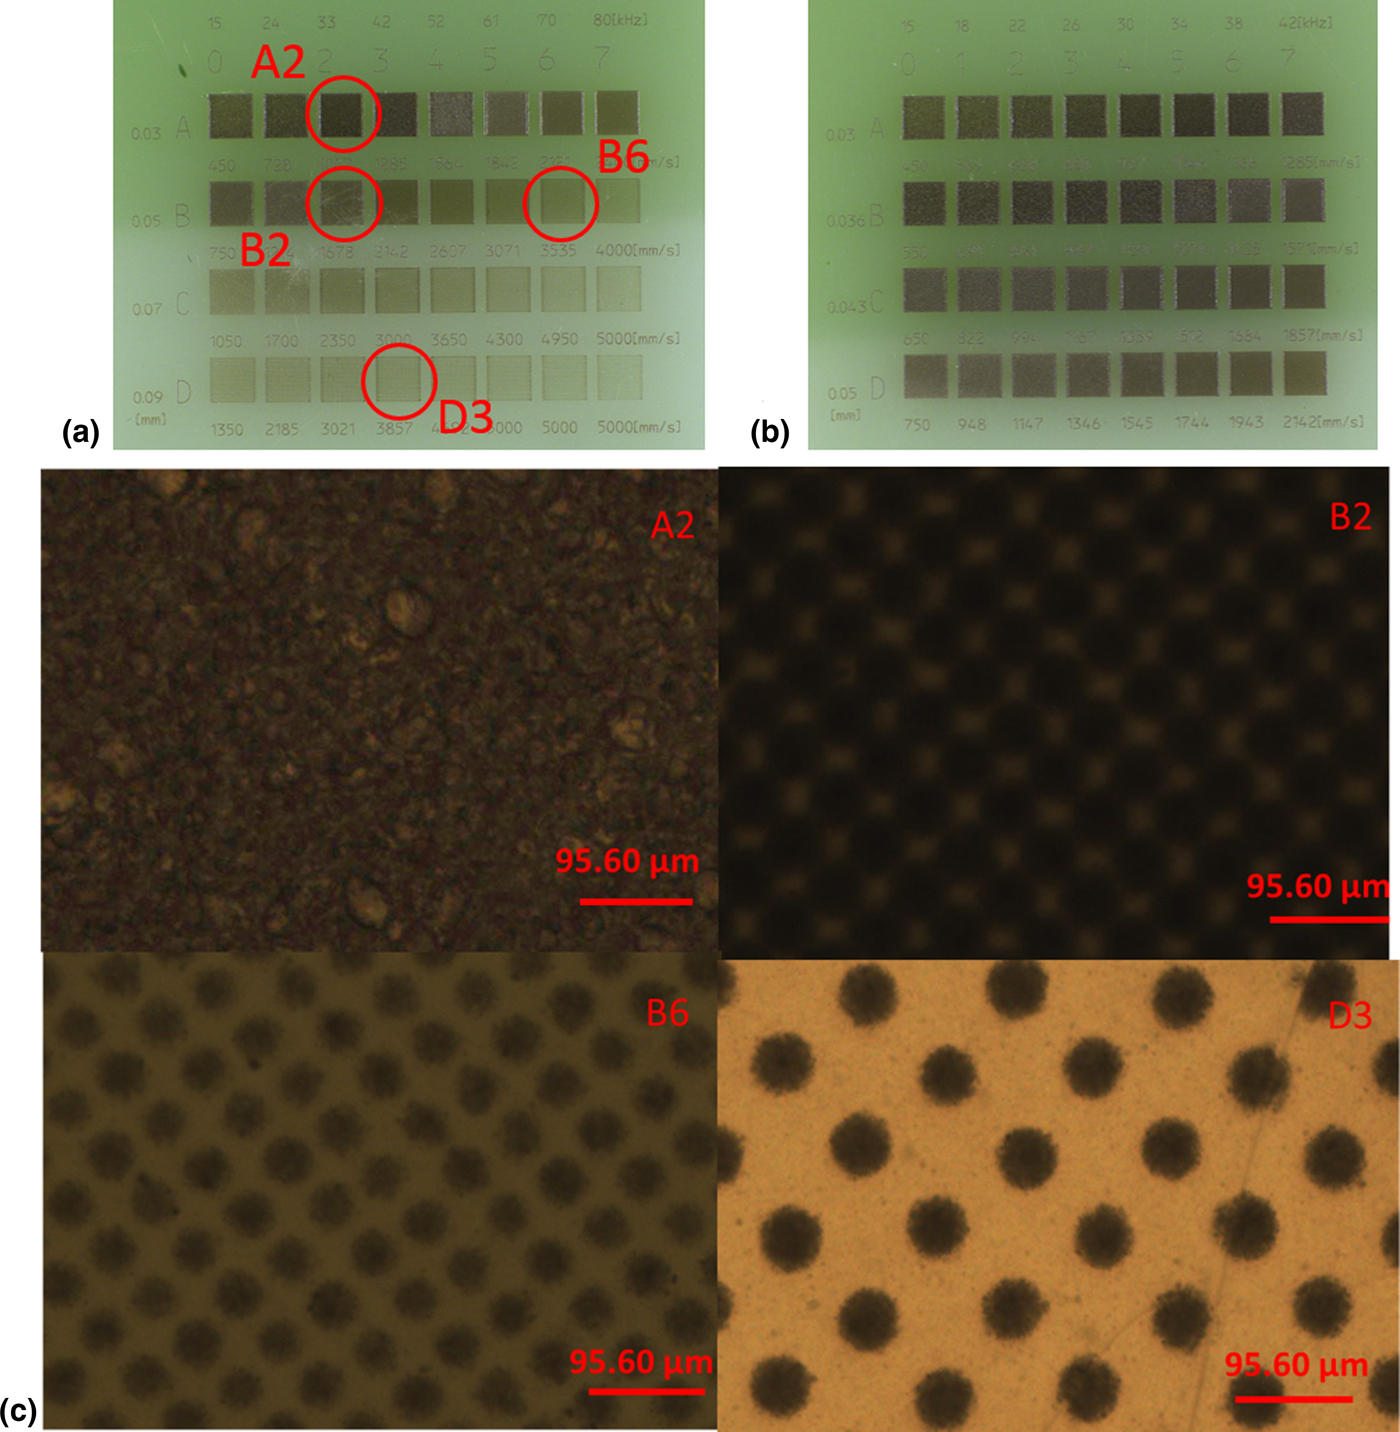
The first set of test plates were manufactured by injection molding with low-density polyethylene (LDPE) as a polymer, while a second set were made with polyvinyl-chloride (PVC) as a polymer. In both sets, the additive concentration was kept at 1%. Commonly, the evaluation of an additive for laser-marking is assessed by marking a matrix of squares with varying line pitch (mm), marking speed (mm/s) and pulse frequency (kHz). These laser-marked squares are first visually evaluated to check the contrast, quality of mark and legibility (for laser-marked text), mark depth and surface defects. Afterward, microscopy characterization complements ocular evaluation. However, mark quality is ultimately assessed in compliance with the application requirements. In a typical test, a first matrix was laser-marked with the following value intervals: line pitch (0.03–0.09 mm), frequency (15–80 kHz) and marking speed (450–5000 mm/s). A second matrix was laser-marked choosing the appropriate range for each parameter that led to a good mark after an ocular evaluation and these were characterized using microscopy. In general, squares with good contrast were visually observed in all marked testing plates. Matrix LDPE1 [Fig. (4a)] shows squares with good contrast with line pitch values ranging from 0.03 to 0.05 mm and marking speed values ranging from 450 to 2142 mm/s. A second and optimized matrix [Fig. (4b)], LDPE2, was laser-marked using these intervals to produce a set of squares with good contrast. In order to understand the surface of the marked squares the quality of the spots was checked by microscopy [Fig. 4(c)]. Squares A2 and B2 exhibited a uniform color, however, it was possible to distinguish dots in square B2, which was marked with the same frequency (33 kHz) but with a larger value of line pitching (0.05 in contrast to 0.03 mm, for squares B2 and A2). In contrast, square B6 which was marked with the same line pitching value of 0.05 mm as square B2, but with a frequency of 70 kHz shows a less homogenous surface where the LDPE polymer appears partially marked. An increase in line pitching led to a less homogeneous mark, which can be observed in square D3, which was marked with a line pitching of 0.09 mm and 42 kHz of frequency. Using any combination of the conditions that were used for marking the squares in matrix LDPE2 it was possible to mark proper figures that exhibited a uniform and homogenous mark with sharp edges (SM).
(a) Testing plate LDPE1, (b) testing plate LDPE2, (c) micrographs of four marked squares in testing plate LDPE1 (×100).
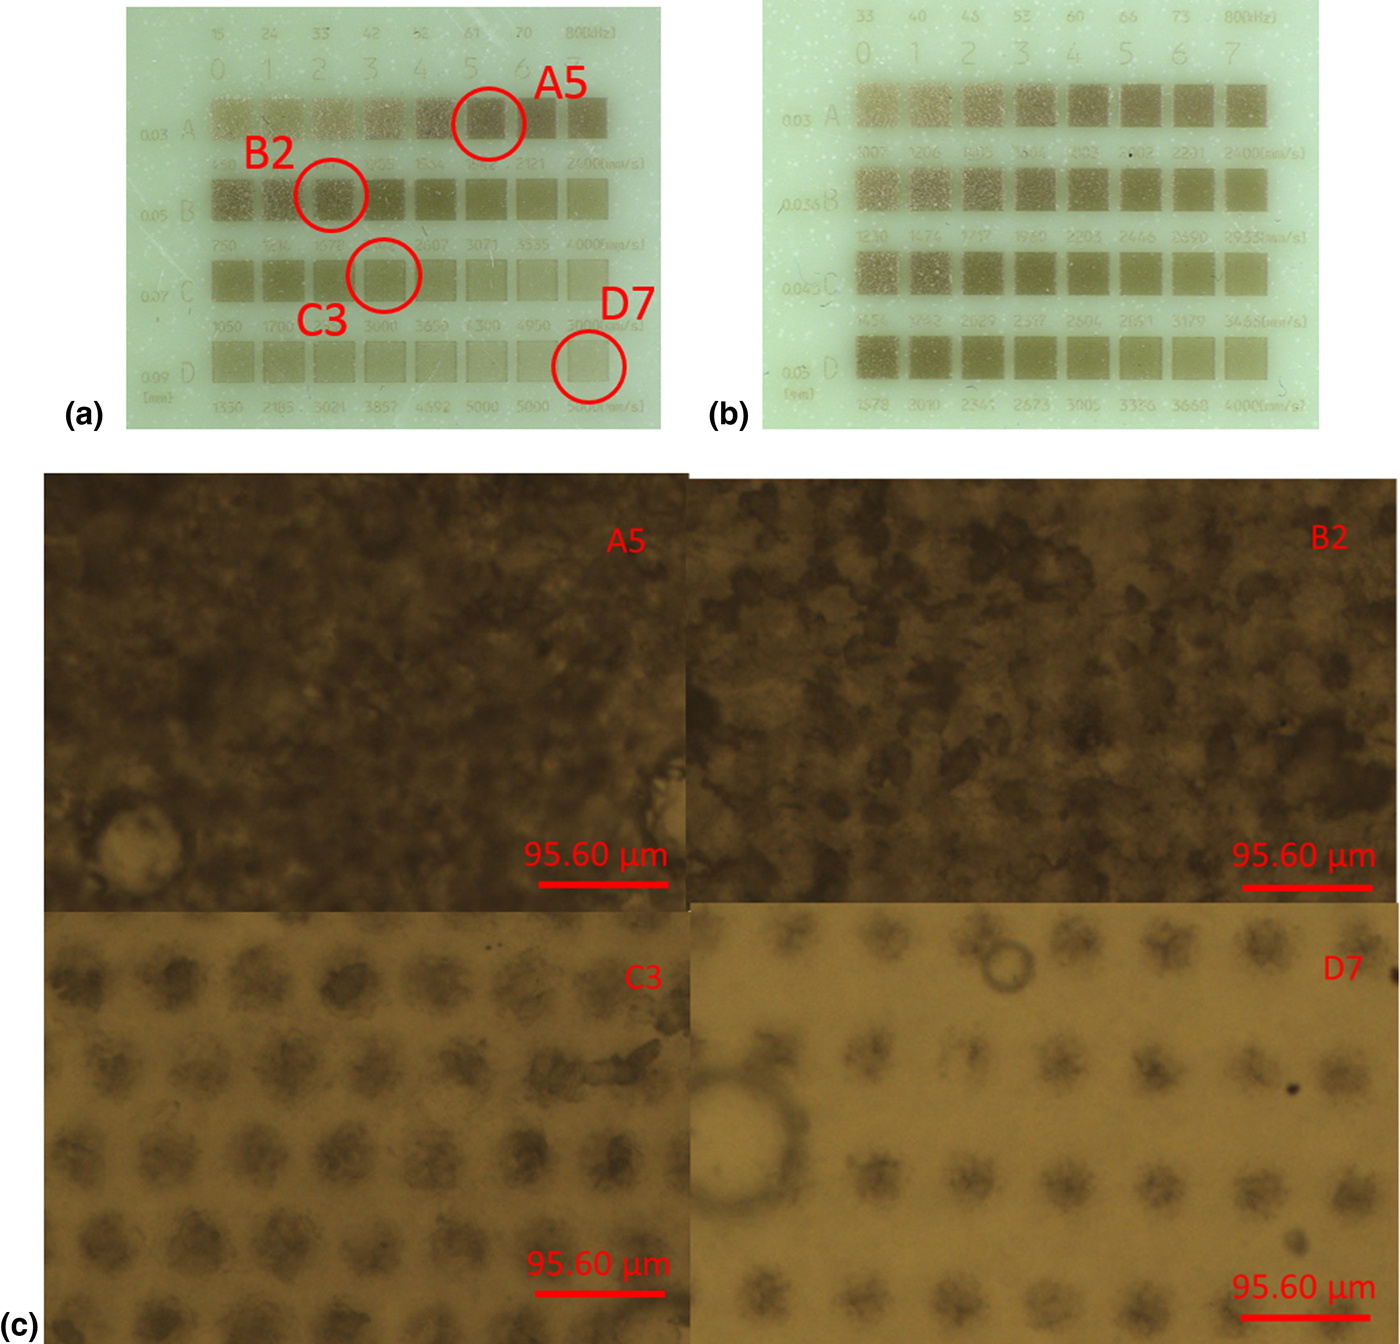
Markability depends as well on the type of polymer. Not all polymers may be marked by using the same conditions and type of laser. This feature can be clearly observed with PVC testing plates [Fig. (5)]. The first laser-marked matrix on PVC [Fig. (5a)], PVC1, shows different marking results using the same marking conditions as in matrix LDPE1. For this plate, best marking resolution was observed using line pitching of 0.03 mm and frequencies between 60–80 kHz and using line pitching of 0.05 mm and frequencies between 15 and 52 kHz. A second optimized matrix was laser-marked [Fig. (5b)], PVC2, by using a line pitching ranging between 0.03 and 0.05 mm and frequency between 33 and 80 kHz. Most of the squares exhibited visible and uniform marks [Fig. (5c)] with squares A5 and B2 exhibiting a uniform marked surface. By slightly altering the line pitching and frequency values important differences arose on the marked surface, as can be observed in square C3, which was marked with a line pitching of 0.05 mm and a frequency of 42 kHz compared with square B2 which was marked with a line pitching of 0.03 mm and a frequency of 33 kHz. Dots were not overlapped in square C3 and as a result, it exhibited a non-homogeneous mark. Similarly to matrix LDPE1, when using 0.09 mm of line pitching and a frequency of 80 kHz the resulting square was poorly marked (square D7). Thus, when the marking speed is too high a non-continuous marked line is produced and the mark appears as a series of spots. Based on our experiments, for both types of testing plates, a line pitching lower than 0.05 mm is recommended to ensure a proper mark. Pulse frequency is one of the most important parameters to be set up and depends on the type of polymer. For copper hydroxyphosphate as an additive, a frequency between 15 and 42 kHz for LDPE and between 33 and 80 kHz for PVC should be sufficient.
(a) Testing plate PVC1, (b) testing plate PVC2, (c) micrographs of four marked squares in testing plate PVC1 (×100).

Ideal marks will show no scattering and good resolution on the edges in the figures and scattering was not observed in any of the test plates.[Reference Han and Gubencu31] Several figures and barcodes were additionally laser-marked, whose edges were sharp and uniform and this feature is recommended especially for bar- and QR codes which need to be easy to read by code scanners/readers. The mechanism that we propose for laser-marking for these two types of testing plates starts by directing the laser beam (1064 nm) onto the polymer's surface where copper hydroxyphosphate is dispersed. The additive readily absorbs the energy and a surface reaction starts, which could be a combination of melting through a thermochemical reaction and carbonization of the polymer.[32, Reference Zhong, Cao, Qiu, Wu, Liu, Li and Zhu33] During this reaction, the temperature of the irradiated area and its surroundings increases and polymer degradation leads to gas formation. Vapor residues were detected, which were extracted by the fume extraction unit inside the marking chamber and a minor quantity of polymer dust appeared on the surface, which was easily removed.
Conclusions
In summary, we have synthesized copper hydroxyphosphate (Cu2PO4OH) that shows a strong NIR radiation absorbance in the region between 700 and 1600 nm and can be incorporated as an additive in plastic and ink formulation. Several Cu2PO4OH samples were synthesized including one that was produced using a low-cost synthesis procedure, favorable for industrial production, which was easily upscaled using standard laboratory equipment. This sample was tested in a number of trials to test its industrial applicability and when incorporated in a NIR transparent ink, revealed a fingerprint in the region between 700 and 1130 nm easily recordable by banknote detectors when being used in low concentrations (<10%). The light color of the print tests is very suitable for such applications. Additionally, it exhibited a very good performance for laser-marking in LDPE and PVC testing plates, where it showed a good and uniform marked surface. Additional plates were marked and all exhibited a good mark quality. These results show the NIR-absorbing properties of this additive and the feasibility of its manufacture for the aforementioned applications.
Acknowledgments
The authors would like to acknowledge Innovate UK, Knowledge Transfer Partnerships Programme (KTP010154) for financial support and the assistance of research staff at the School of Chemical and Physical Sciences (Keele University) and R&D department of Keeling & Walker Ltd.
Supplementary material
The supplementary material for this article can be found at https://doi.org/10.1557/mrc.2018.144