
Introduction
Protective coatings are widely used and studied across science, technology, and engineering. For example, coatings enhance the chemical stability of organic materials and semiconducting photoelectrodes[ Reference Garcia Parejo, Zayat and Levy 1 , Reference Hu, Lewis, Ager, Yang, McKone and Strandwitz 2 ], protect metals from corrosion[ Reference Wang and Bierwagen 3 ], and inhibit mechanical damage in glasses[ Reference Ritter, Gu and Lardner 4 ]. Organic polymeric coatings are commonly employed due to their high processability and photo-curability. For many years, these polymeric materials have been further enhanced by the addition of a second material phase. In particular, many recent studies focus on small, rigid inorganic additives, such as glass or ceramic nanoparticles. Such nanoparticle additives are useful because they increase the coating toughness without substantially decreasing the modulus, increasing the viscosity, or changing the glass transition temperature[ Reference Kinloch, Mohammed, Taylor, Eger, Sprenger and Egan 5 – Reference Hsieh, Kinloch, Masania, Lee, Taylor and Sprenger 8 ].
Indentation testing is a common and versatile technique for understanding material behavior, including in coated systems. For example, indentation tests are used to measure coating hardness[ Reference Ritter, Sioui and Lardner 9 ], coating–substrate adhesion[ Reference Ritter, Lardner, Rosenfeld and Lin 10 ], fracture properties of the coating and substrate[ Reference Ritter, Gu and Lardner 4 , Reference Chai, Lawn and Wuttiphan 11 ], and coating and substrate moduli[ Reference Bull 12 – Reference King 14 ]. Such data are also utilized to compare various models of the substrate and coating material behavior[ Reference Hakiri, Matsuda and Sakai 15 – Reference Gao, Jing and Subhash 19 ]. Traditional methods include extracting bulk force-displacement data during indentation with Vickers or ball-type tips[ Reference King 14 ], with the possible addition of video recording during indentation[ Reference Ritter, Lardner, Rosenfeld and Lin 10 , Reference Ritter and Rosenfeld 20 ] and surface analysis after tip retraction[ Reference Bull 12 ]. Instrumented nanoindentation, with the possible addition of concurrent two-dimensional microscopy, is used to study thin-film coatings[ Reference Hakiri, Matsuda and Sakai 15 , Reference Bull 21 , Reference Li, Palacio, Barry Carter and Gerberich 22 ]. On a larger length scale, one study used 3D confocal microscopy to extract the displacement of a ball indenting a hydrogel, thus measuring the hydrogel bulk modulus[ Reference Lee, Rahman, Zhou and Ryu 13 ].
Despite the real-world utility of coatings and the large variety of research on the indentation behavior of coated systems, few techniques enable researchers to directly observe the microscale material behavior under indentation, especially in a fully 3D context. This structural information is of great interest to a variety of fields and, if available, would enable researchers to address a diverse array of questions about the microscale response of polymeric coatings, the effect of nanoparticle fillers, and how such coating–substrate systems ultimately fail.
To address this knowledge gap and better understand coating–substrate systems, we developed an indentation scope that interfaces with fast confocal microscopy to directly measure both bulk and 3D microscale responses of a coated glass system during the entire indentation process. In particular, we applied this technique to study the behavior of a microns-thick UV curable epoxy-based coating on glass and compared plain coatings (unfilled) to those with silica nanoparticle filler. We observed coating pile-up around the tip in all samples and our results confirm a slightly higher force response in filled coatings, reflecting their ~50% larger modulus. We also observed slip at the coating–glass interface in all samples. Interestingly, the area of slip was not only larger in filled coatings, but developed at a faster rate with respect to indenter displacement, potentially implying a different mechanism of slip growth.
Methods
Instrument
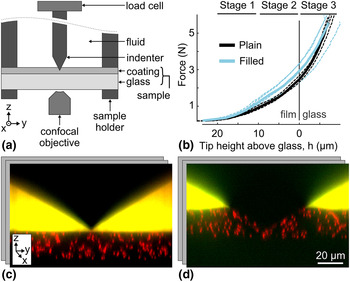
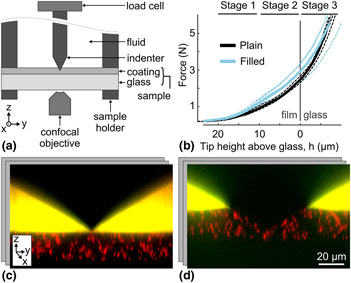
To observe the structural response of coatings during indentation, we designed a custom indentation scope that interfaces with a confocal microscope. The schematic of our setup geometry is shown in Fig. 1(a). The sample (coating on glass coverslip) was clamped between two annular sample holders and attached to a three-axis piezoelectric motor with a travel range of 300 µm and accuracy of ±2 nm in the z-direction (not depicted; P-563.3CD, Physik Instrumente, Karlsruhe, Germany). The diamond tip (four-sided pyramid indenter, 120° between faces; Gilmore Diamond, Attleboro, MA, USA) was fixed to a load cell, which was mounted on the indentation apparatus. The load cell had a force measurement range of 44.5 N (10 lb), was connected to a strain gauge amplifier (LSB200 and CSG110, Futek, Irvine, CA), and was digitized at 100 points per second using a USB DAQ (12 bits analog input resolution; USB-6000, National Instruments, Austin, TX, USA). With 2 mV/V gain and 10 V excitation, this setup can resolve forces to ±2 mN. During indentation tests, the load cell and diamond tip remained stationary, while the piezo motor moved the sample upward toward the tip. Because the load cell was stationary, the force measurement was not subject to inertial effects. The sample was moved toward the tip at 0.15 µm/s, producing quasi-static measurements. Example force output is shown in Fig. 1(b). This indentation apparatus was based on a previously developed multiaxial confocal rheoscope[ Reference Lin, McCoy, Cheng, Leahy, Israelachvili and Cohen 23 ].
Schematic of experimental setup and results. (a) Diagram of confocal indentation scope where the sample holder is connected to a piezoelectric motor (not shown) and drives the coated glass sample up into the diamond indenter. During the experiment bulk force data were collected from the load cell and local sample deformation was observed from below using an inverted confocal microscope. (b) Force plotted against tip height (tip-to-glass distance, h) for each experiment (dashed lines) and the group average (solid lines) for plain and filled coatings. The tip hits the glass–coating interface at height h = 0 µm. Above 20 µm, the tip is above the coating and below 0 µm the tip is in the glass. Brackets above the plot area indicate the three stages of indentation used for comparing the coatings’ flows. (c, d) Representative yz projections of the 3D confocal data showing the system (c) before and (d) during indentation.

To image the 3D microstructure of the coating, the indentation apparatus interfaced with a high speed, line-scanning confocal microscope (LSM 5 Live, Carl Zeiss Microscopy LLC, Jena, Germany), with a 100× objective (Zeiss Plan-aprochromat 100× 1.4 NA oil DIC objective, 340 µm total working distance) that was mounted on a high-speed piezo focusing motor for rapid z-actuation (P-725.2CD PIFOC, Physik Instrumente, Karlsruhe, Germany). The entire field of view (128 µm × 128 µm × 90 µm; 512 pixels × 512 pixels × 400 pixels) was collected in ≈6.7 s. Full, 3D image stacks were collected throughout the experimental time at a rate of one stack per 11.84 s, for a total experimental time of about 950 s. Example yz confocal slices are shown in Fig. 1(c) and 1(d). The microscope imaged through the glass substrate to capture the coating and diamond tip above it. Thus, a thin, coverslip-thickness glass was used as the substrate (200 µm-thick Corning® Willow® glass, Corning Incorporated, Corning, NY, USA). We used finite element analysis to estimate the deformation of the glass substrate during indentation and found the maximum strain to be ≈1%, significantly less than the strain within the coating.
Materials
In this experiment, we tested two different coating formulations obtained from Corning Incorporated: a plain UV-curable epoxy coating, and a UV-curable epoxy coating with ≈20 nm diameter silica particles uniformly dispersed at ≈30% volume fraction and bonded to the epoxy coating. The plain (unfilled) coating was comprised of 48 wt.% of 3,4 epoxycyclohexylmethyl-3,4 epoxy-cyclohexane carboxylate (Syna Epoxy 06, Synasia Inc., Metuchen, NJ, USA), 48 wt.% 3-ethyl-3-oxetanemethanol (S-101, Synasia Inc.) as a cross-linker. The filled coating was comprised of 48 wt.% cycloaliphatic epoxy resin (Nanopox C620 Evonik Industries, Essen, Germany, which contains 40 wt.% epoxy functionalized nanosilica) and 48 wt.% oxetane cross-linker (Nanopox C680 Evonik Industries, which contains 50 wt.% epoxy-functionalized nanosilica). Both formulations contained 1 wt.% cationic photoinitiator (UVI-6976, Dow Chemical Co., Midland, MI, USA) and 3 wt.% adhesion promoter (A-186, Momentive Performance Materials Inc., Waterford, NY, USA). These two epoxy bases have different tradenames but are equivalent other than the addition of nanosilica filler. The plain and filled coatings had a storage modulus of 2464 and 4222 MPa, respectively, as measured using dynamic mechanical analysis at 25 °C (DMA Q800, TA Instruments, New Castle, DE, USA).
To track the deformation field of the epoxy coating, poly(methyl methacrylate) (PMMA) particles of diameter 1.8 µm and volume fraction ≈8% were included in both coating formulations. These tracer particles were fluorescently labeled with DiIC18 (1,1′-dioctadecyl-3,3,3′,3′-tetramethylindotricarbocyanine iodide; excitation wavelength 565 nm) and thus visible on the fluorescence confocal microscope. All three materials (epoxy, nanosilica particles, and tracer particles) have refractive indices close to that of the coverslip substrate (i.e., 1.51). Therefore, the final coating composite had high optical transparency and minimal aberrations. After adding tracer particles, the coating moduli for plain and filled coatings at 25 °C were 2470 and 3682 MPa, respectively.
To prepare plain and filled epoxy samples for imaging, PMMA tracer particles were added. The PMMA particles were initially dispersed in decahydronaphthalene. The tracer-particle suspension was added into the epoxy after any nanosilica filling, and the mixture was vortexed thoroughly and left under vacuum until the decahydronaphthalene evaporated entirely. Unlike the silica nanoparticles, tracer particles were not functionalized and therefore not covalently bound to the epoxy matrix. We found that the small amount of added tracer particles did not significantly alter the epoxy viscosity. Importantly, since the tracer particles were mixed with epoxy prior to sample curing, they were firmly entrapped in the coating matrix and flowed with the coating during indentation.
The epoxy formulations were then coated onto glass substrates, creating a total of eight samples (four of each coating). To prepare the substrate for coating, the glass was first sonicated in a liquid detergent bath (7x cleaning solution, MP Biomedicals, Santa Ana, CA, USA) at 3% concentration for 5 min, and then rinsed with deionized water. After this cleaning process, the epoxy was spin-coated on the glass at 1000 rpm and 1500 rpm for plain and filled epoxies, respectively, in order to achieve a final coating thickness of ≈20 µm. After the coating procedure, the samples were immediately cured using a table-top UV oven (2000 Flood, Dymax, Torrington, CT, USA) for 3 min, corresponding to ≈10 J/cm2. We then used the confocal microscope to inspect the cured coating and only kept samples with a uniform coating thickness of 20 µm ± 2 µm. The selected samples were then protected from light and stored at room temperature for at least 1 week to finish curing. Fully cured samples were clamped in the annular sample holder and mounted to the indentation apparatus on the confocal microscope. To visualize the position of the diamond tip and the coating's upper surface during the experiment, we placed a fluorescent fluid (fluorescein-water solution, excitation wavelength 494 nm) on the coating after mounting.
Data analysis
Force response
Raw force data from the load cell were first smoothed using a moving-average filter, with a window size of 99 points (0.99 s ≪ 11.84 s image time ≪ 950 s full experiment time), to reduce noise. Smoothed curves were then re-sampled using nearest-neighbor interpolation to extract the force during each imaging time point.
Coating–glass interface location
Imaging data sets were first analyzed to extract the z position of the glass–coating interface over time. At each time point, each slice of the z stack was summed in the xy plane to obtain an overall intensity, I, versus z position. This intensity was low in the glass because the glass is not fluorescent, and high in the coating, due to the fluorescent tracer particles. Images also showed gradual intensity decay with z due to slight refractive index mismatches. This overall intensity dependence was fit with a sigmoid plus a linear term,
 $$I(z) = \beta _0 + \beta _1(1 + e^{(\beta _2 - z)/\beta _3})^{ - 1} + \beta _4(z - \beta _2),$$
where z is the height of the slice above the bottom of the stack and β i are fittings constants. Using this model, we extracted β2 as the interface position.
Tip location
After finding the interface, images were analyzed to extract the z position of the diamond tip over time. In the first time point, the tip's z position was determined manually using the central xz projection. This projection was also used to measure the coating thickness. The tip was mounted to the stationary force sensor and thus moved proportionally to any applied force. This dependence was calibrated and exploited to determine the relative z displacement of the tip from the relative change in force. This method was particularly useful when the tip was in the sample and no longer clearly visible. However, in the first 5–10 time points (tip height h > 17 µm), the diamond tip slipped vertically slightly due to slack in the system, violating this linearity. During these time points, the tip height was instead determined by tracking the vertical displacement of the tip itself in the confocal images. This second method was validated by confirming linearity with the force when the tip was not slipping and by manual comparison to the imaging data. Finally, the coating's initial thickness, glass–coating interface z position over time, and tip z position over time were combined to determine the tip height (tip-to-glass distance, h) as a function of time for each experiment. Results are plotted with respect to tip height.
Tracer particle paths
At each imaging time point, the 3D image data were analyzed to locate tracer particles embedded in the coating. Images were analyzed using the 3D, IDL-implementation of the Crocker–Grier particle-finding algorithm to locate the [x(t), y(t), z(t)] positions of the tracer particles[ Reference Crocker and Grier 24 ]. Particle positions were linked over time using trackpy, the python implementation of the related Crocker–Grier particle-tracking algorithm (search range: 1.0 µm, memory: 0 time points, minimum duration 90% of full experiment time).
For each experiment, the coating's flow was divided into three stages of indentation and then analyzed. The three stages of indentation were chosen based on the tip's height above the glass, where stages 1 through 3 include imaging time points when the tip is 20 to 10 µm, 10 to 0 µm, and 0 to −4 µm, respectively. Here, negative tip height indicates the tip penetrating into the glass. To understand the coating's flow within each stage, we characterized each particle's trajectory by calculating: the total path length,
 $$L = \mathop \sum \nolimits [(\delta x)^2 + (\delta y)^2 + (\delta z)^2]^{1/2},$$
where δx = x(t) − x(t − 1); the end-to-end displacements in the three Cartesian coordinates,
 $${\rm \Delta} x = x(t_{{\rm end}}) - x(t_{{\rm start}}),$$
where t start and t end are the first and last time points in the stage (similarly for y and z); and the radial end-to-end displacement,
 $${\rm \Delta} R = [{\rm \Delta} x^2 + {\rm \Delta} y^2]^{1/2}.$$
Initial data indicated slip at the coating–glass interface. To characterize any slip, particles within 3 µm of the coating–glass interface were isolated and those with a radial displacement over a threshold of 0.05 µm/time-step were plotted. The area of slip was characterized by manually fitting an ellipse around these tracks. Due to the intrinsic spacing of tracer particles dispersed in the coating, this method was able to resolve slip areas larger than roughly 1500 µm2.
Tracer particle paths were also used to compute 3D strain fields. These scattered displacement tracks were interpolated and smoothed on a 5 µm grid using a 3D variation of Barnes interpolation[ Reference Bartell 25 ]. Lagrange strain fields were calculated from numeric spatial gradients of the displacement fields, via the central difference method. This analysis returned a full 3D strain tensor at each point on the 3D grid, valid for both small and large strains[ Reference Liu and Long 26 ].
Results
Force
Smoothed force data for each experiment are plotted with respect to tip height above the glass in Fig. 1(b), along with the averages for each sample group. On average, the force response in the coating was about 30% stronger in the samples with filled epoxy, reflecting the 50% higher modulus of the coating. However, once the tip penetrated the glass (i.e., h < 0 µm), the plain and filled force responses were more similar, as expected because the glass begins to dominate the response.
Particle paths
The flow of the coating was reflected in the paths of the tracer particles, as shown in Fig. 2 for the entire indentation experiment and the three individual stages of one experiment. See online Supplementary Material for movies of tracer particle paths for every experiment (Supplementary Movies S1). These traces, especially during the first stage, illustrate how the coating flows to produce a pile-up around the tip. In general, particles closer to the tip moved down and out, perpendicular to the tip's face, while the hard boundary at the bottom of the coating redirected the force such that particles farther away from the tip moved up and out. Separately, tracer particles near the tip–coating–fluid interface immediately moved up and out, parallel to the tip face, creating a small, localized pile-up that was later pushed out laterally. In the later stages of indentation, the tip and glass formed a wedge-like boundary that constrained the coating flow near the tip such that it was dominated by the lateral components.
Paths of tracer particles in one experiment. For stages 1 through 3, xz views of the paths within the range y = 0 µm ± 10 µm are shown. Additionally, the paths throughout the entire experiment are shown in xy and 3D projections. Each line indicates the path of a different tracer particle. In all plots, paths are shown relative to the glass–coating interface, which is at the bottom (z = 0 µm) plane.

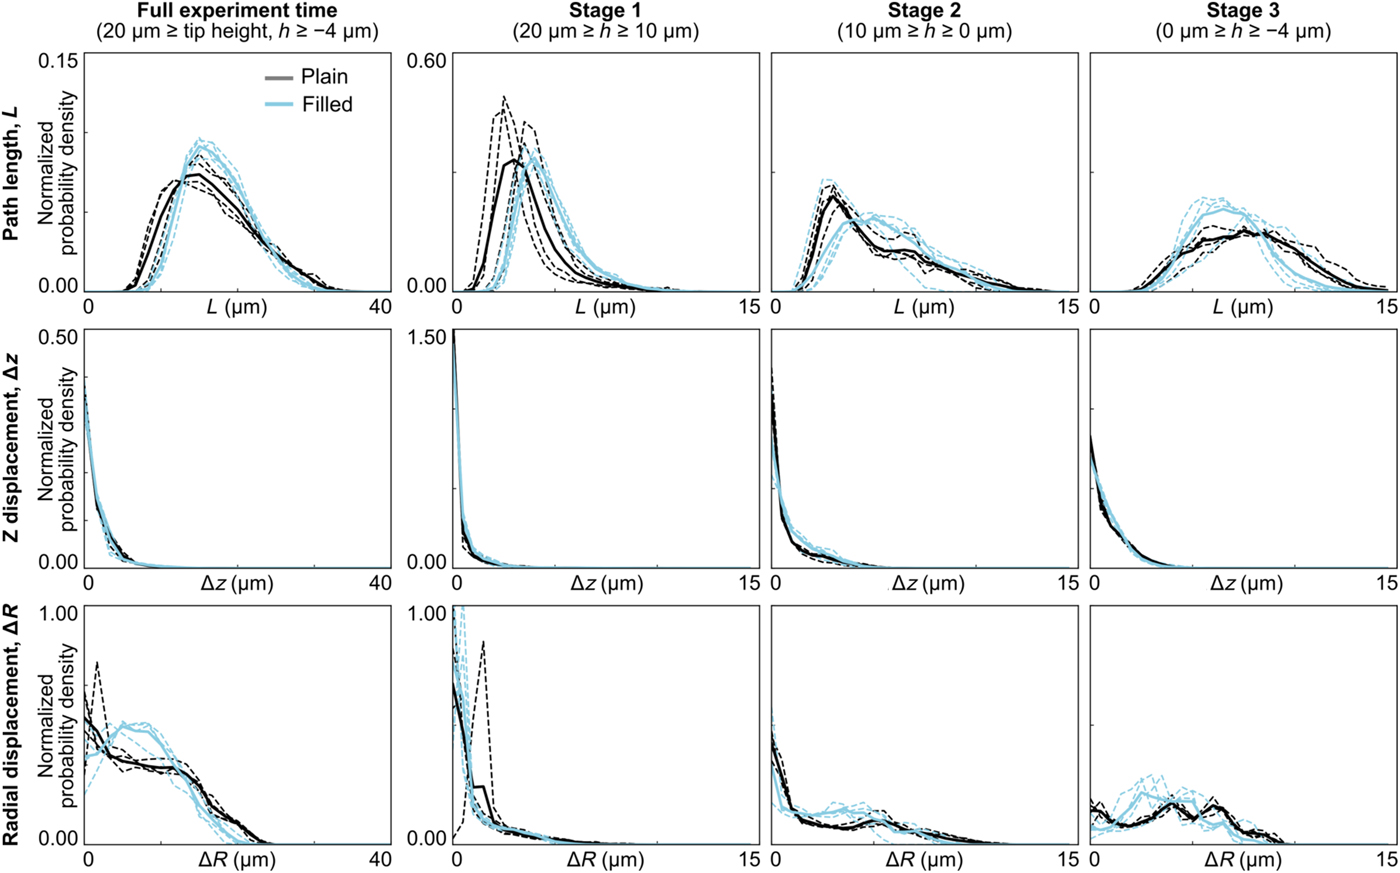
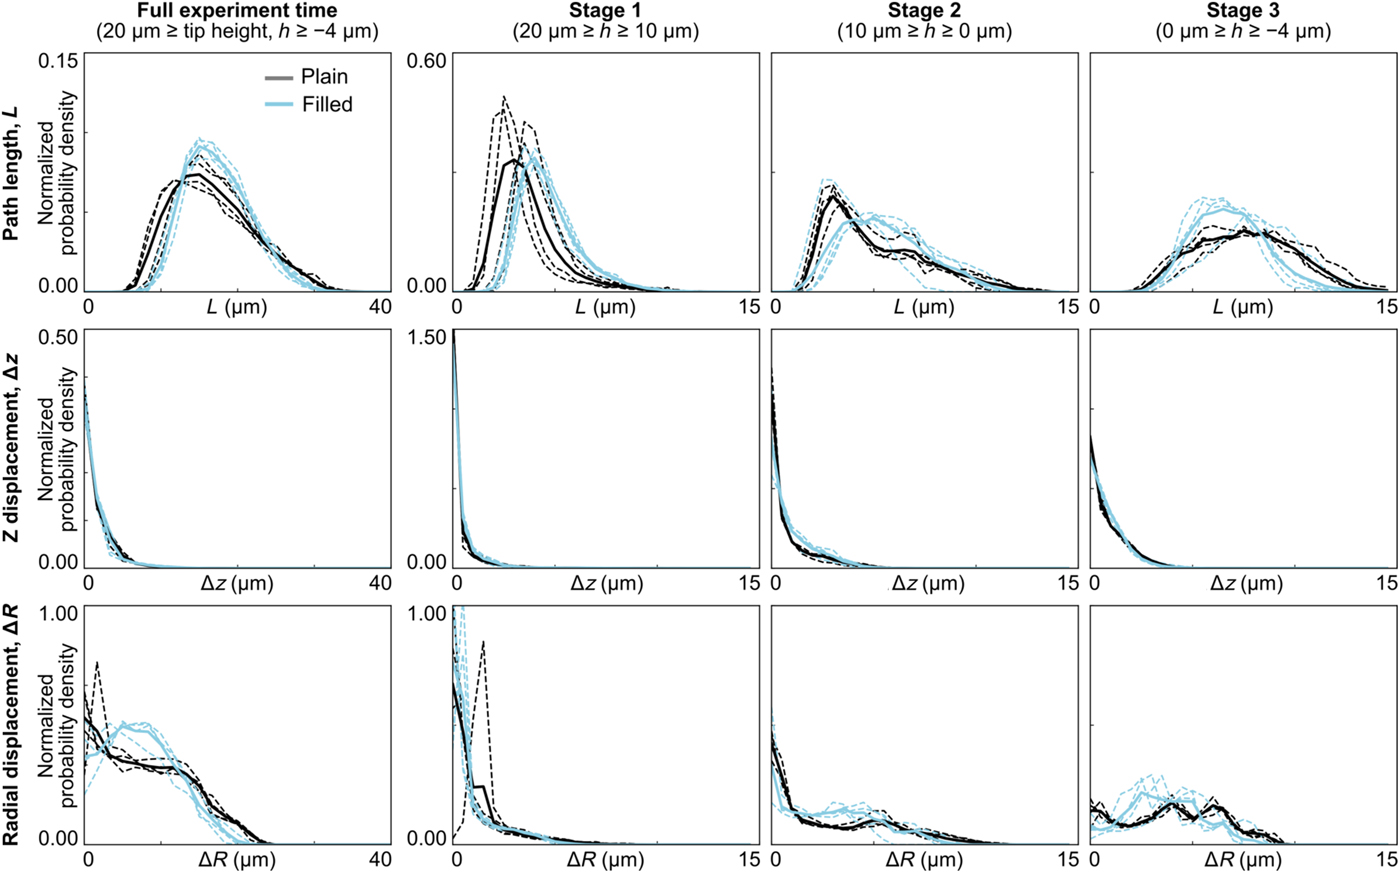
To quantify the coating's flow, we calculated various characteristics of the tracer-particle paths during the three stages of indentation. In particular, Fig. 3 shows the histograms for total path length, z displacement, and radial end-to-end displacement. Each plot shows the normalized probability density of a particular path characteristic for each individual experiment, and all experiments combined, for plain and filled coatings. As the tip approached and penetrated the glass (stages 2–3), the histograms for the two sample types became increasingly distinct. This was true for all path characteristics except the z displacement, where the two coating formulations both showed relatively small displacements at all stages of indentation.
Histograms of path characteristics for tracer particles during each stage of indentation. Histograms are shown for each experiment individually (dashed lines), as well as for the population average (solid lines) for plain and filled coatings. In general, the plain and filled coatings become increasingly distinct during the later stages.
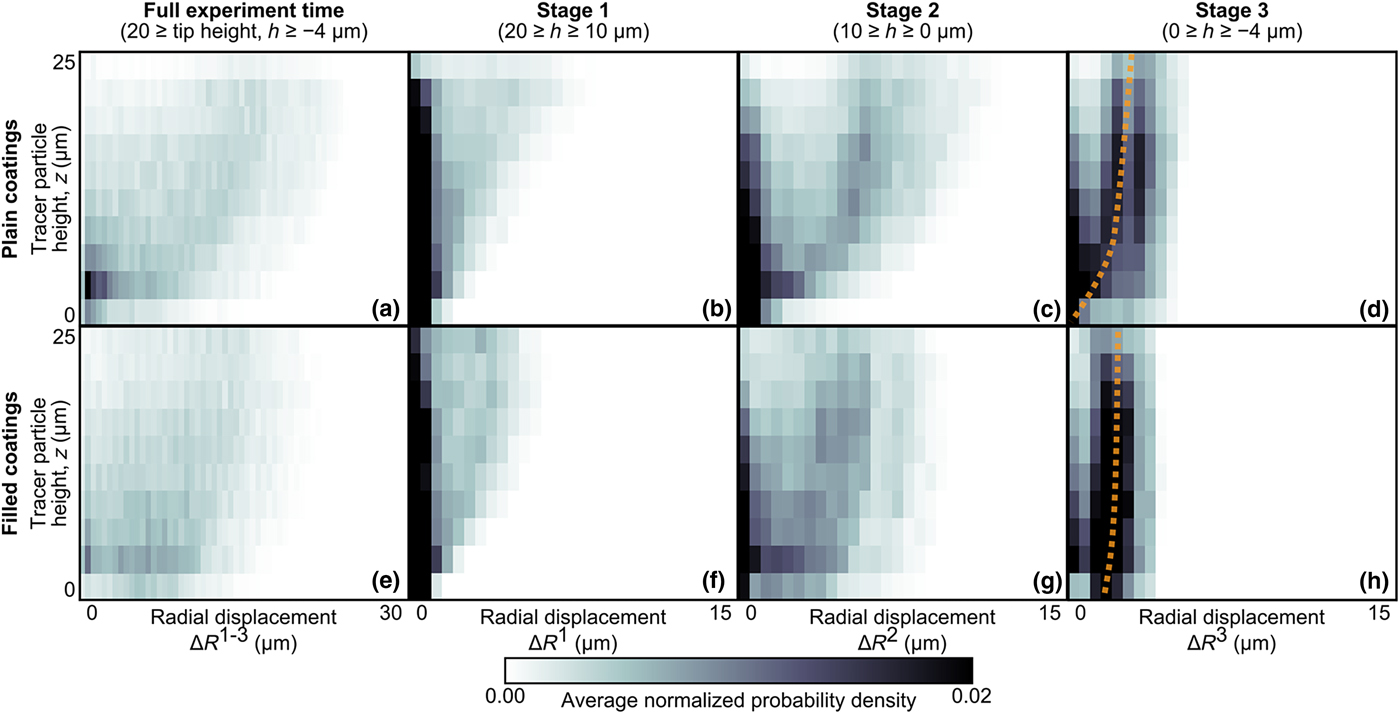
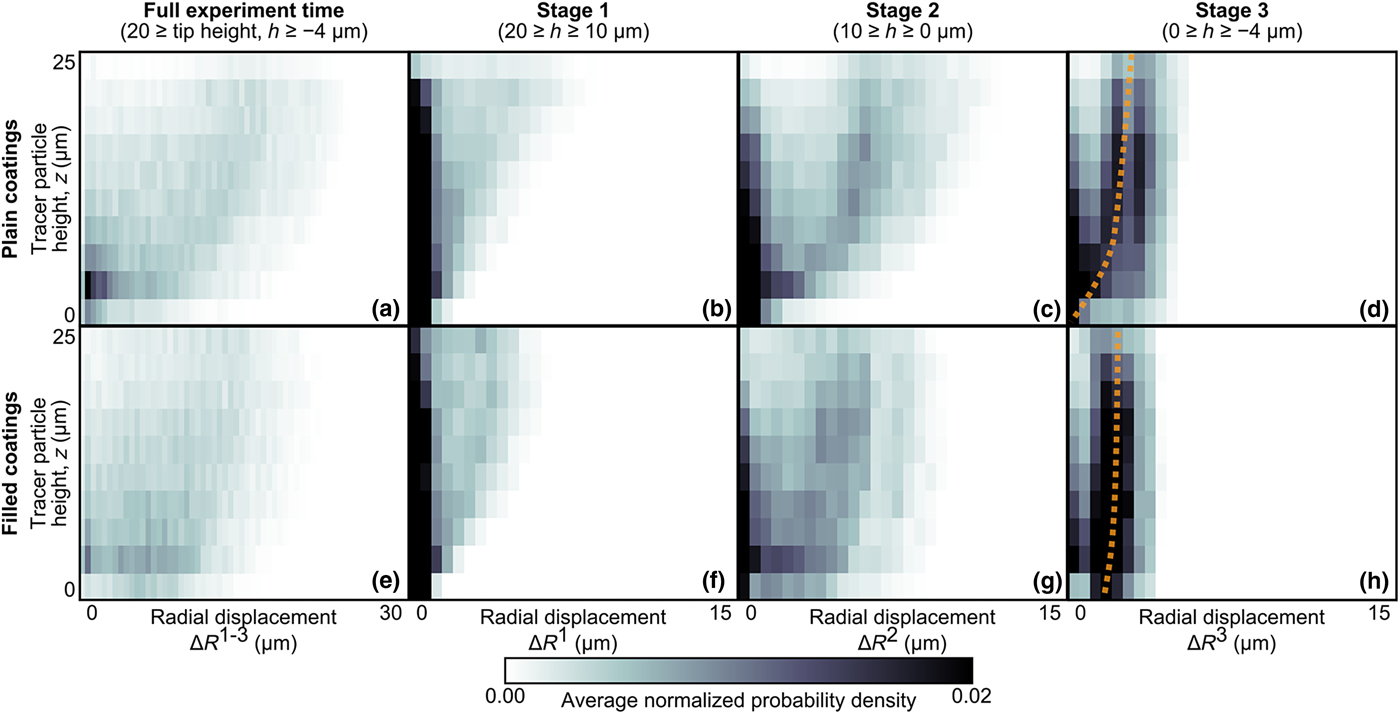
As exhibited in Fig. 3, plain and filled coatings had distinctly different behaviors when comparing their radial flow component. This flow behavior also varied across the coating's depth (i.e., along z). Therefore, we further quantified the depth dependence of the coatings’ radial flow. Figure 4 shows the normalized probability density of the radial displacement (averaged over all samples of each sample type) plotted as a function of the tracer particles’ z-position at the start of each stage. Consistent with Fig. 3, these plots again show that, as indentation progressed, the plain and filled coatings became increasingly distinct. Particles higher above the glass (z ≳ 10 µm) had similar radial displacements, regardless of filling. However, in the third stage of indentation when the tip approached and penetrated the glass, the tracer particles closest to the glass interface (z ≲ 5 µm) moved farther radially in the filled coatings as compared with the plain coatings. For filled samples, as z approaches the glass interface [z → 0 in Fig. 4(h)], the radial displacement approached a finite value (approximately 2 µm), suggesting slip between the filled coating and the glass substrate. Thus, data in this lowest z bin were extracted and analyzed further to characterize interfacial slip.
Normalized probability density of tracer-particles’ radial displacement as a function of height above the glass interface. Results are shown averaged over all experiments for (a–d) plain and (e–h) filled coatings during the entire experiment and the three stages of indentation. The plain and filled coatings have similar behavior in the early stages. However, in stage 3, the trends are distinct for particles near the glass interface. In particular, particles in the filled coatings have a non-zero radial displacement, even at z = 0 µm. This trend is illustrated by the dashed lines, which are shown as visual guides.
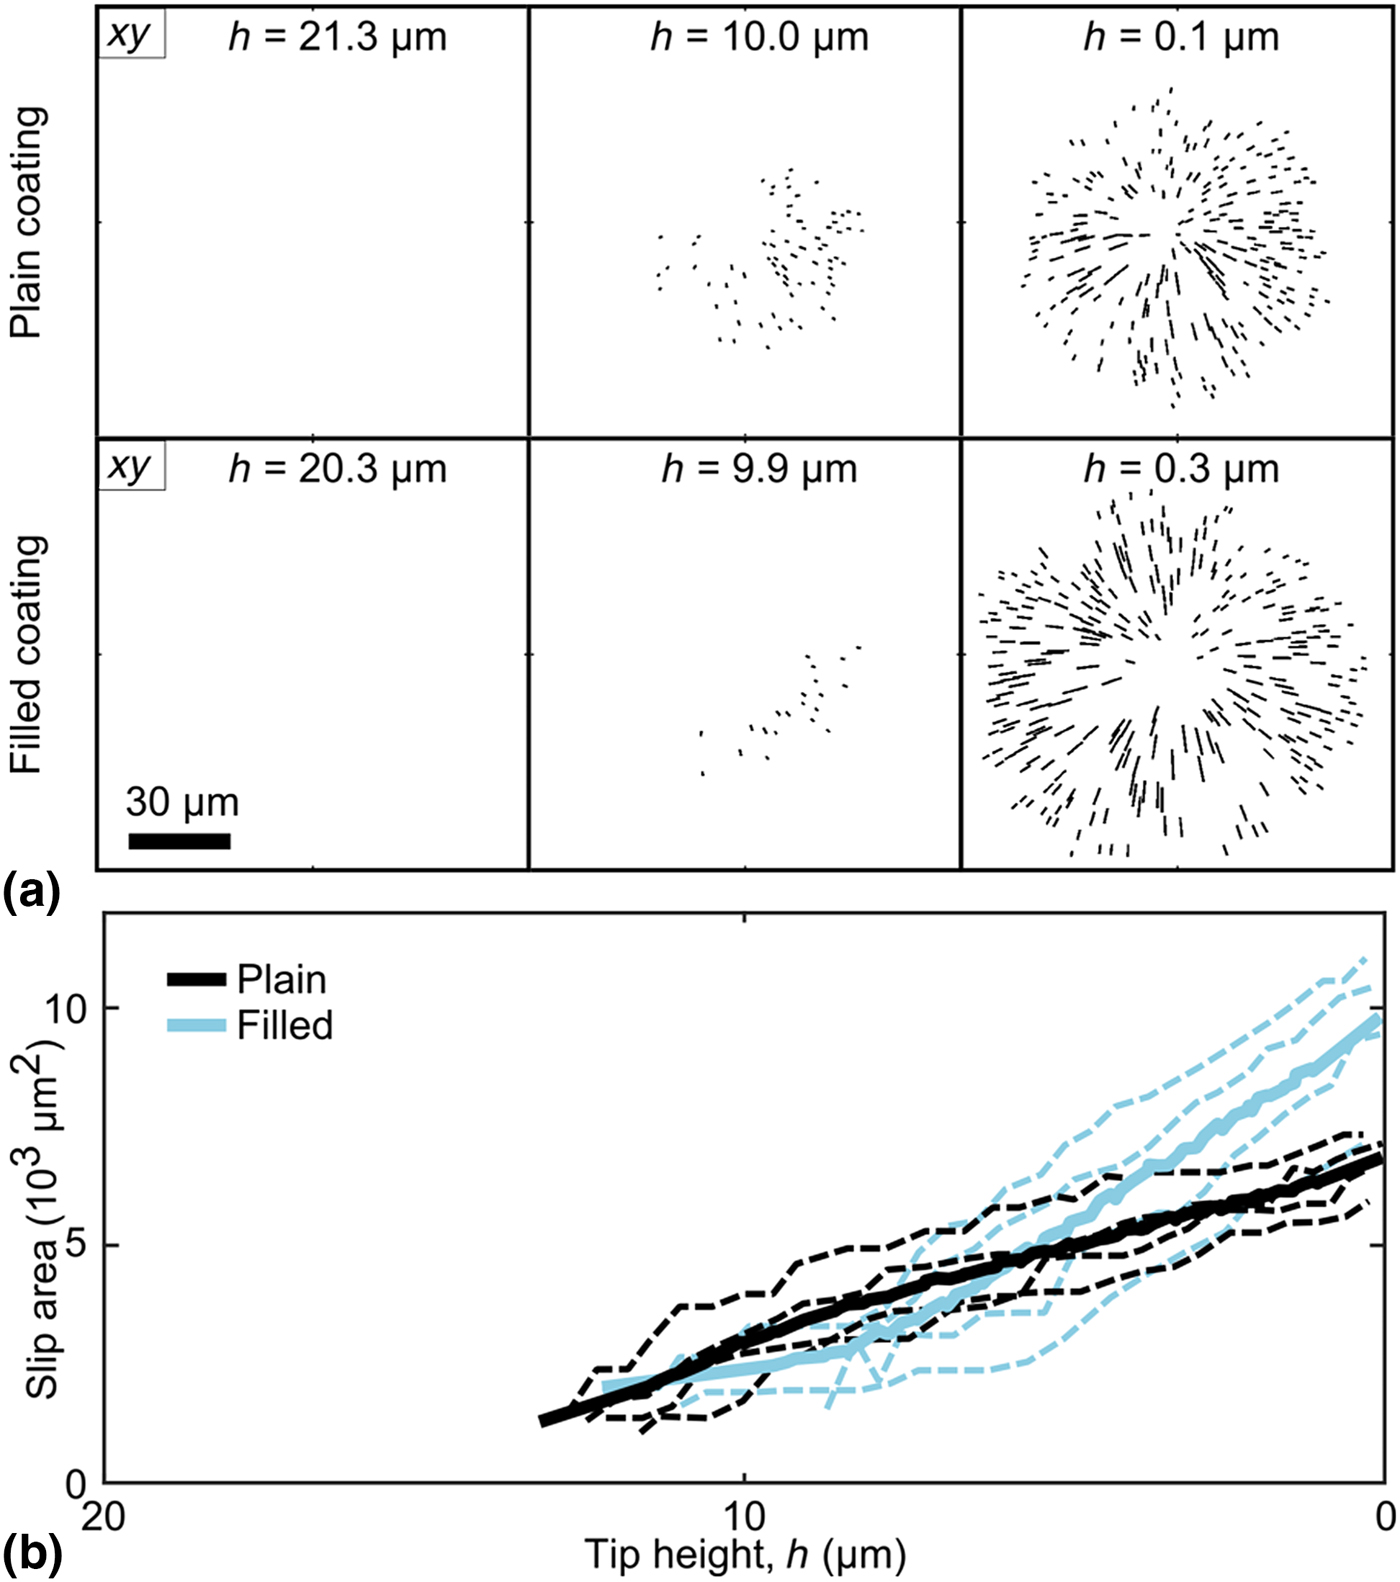
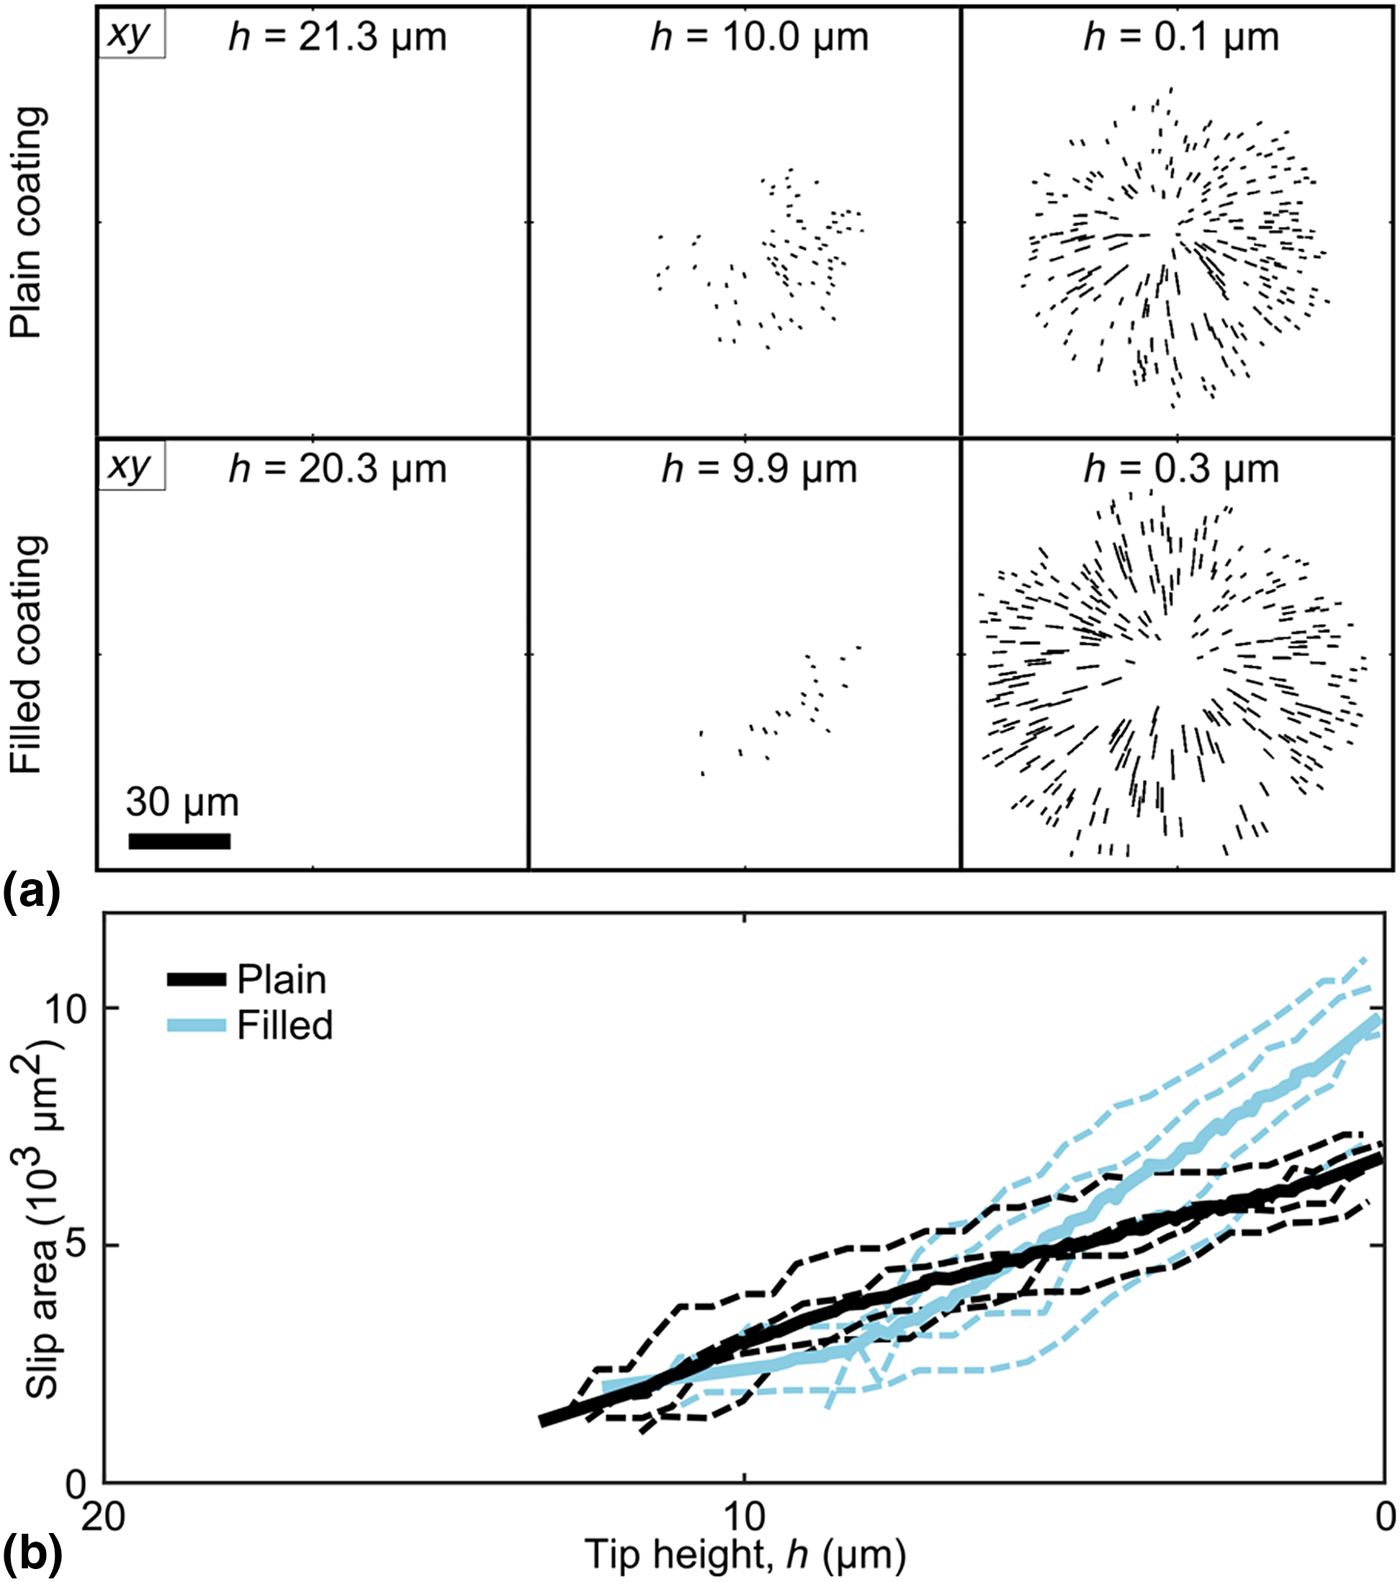
Slip at the coating–glass interface was investigated further by observing large-displacement paths near the coating–glass interface [Fig. 5(a)] and calculating the area of slip (if any) at each time point. Using this method, all samples showed some amount of slip during indentation. As the tip neared the glass (h = 0), however, filled coatings generally had a larger slip area [Fig. 5(b)]. Moreover, the slip area grew at a faster rate in filled samples, as compared to plain coatings.
(a) XY-views of tracer-particles paths within 3 µm of the coating–glass interface (i.e., 0 µm ≤ z ≤ 3 µm) that displaced radially above a minimum threshold and thus were indicative of interfacial slip. These paths are shown for characteristic samples with plain (first row) and filled (second row) coatings. (b) The slip area calculated from the paths shown in (a), shown as a function of tip height above the glass interface, h. Slip areas are shown for plain and filled coatings, including individual experiments (dashed lines) and group averages (solid lines).
3D strain fields
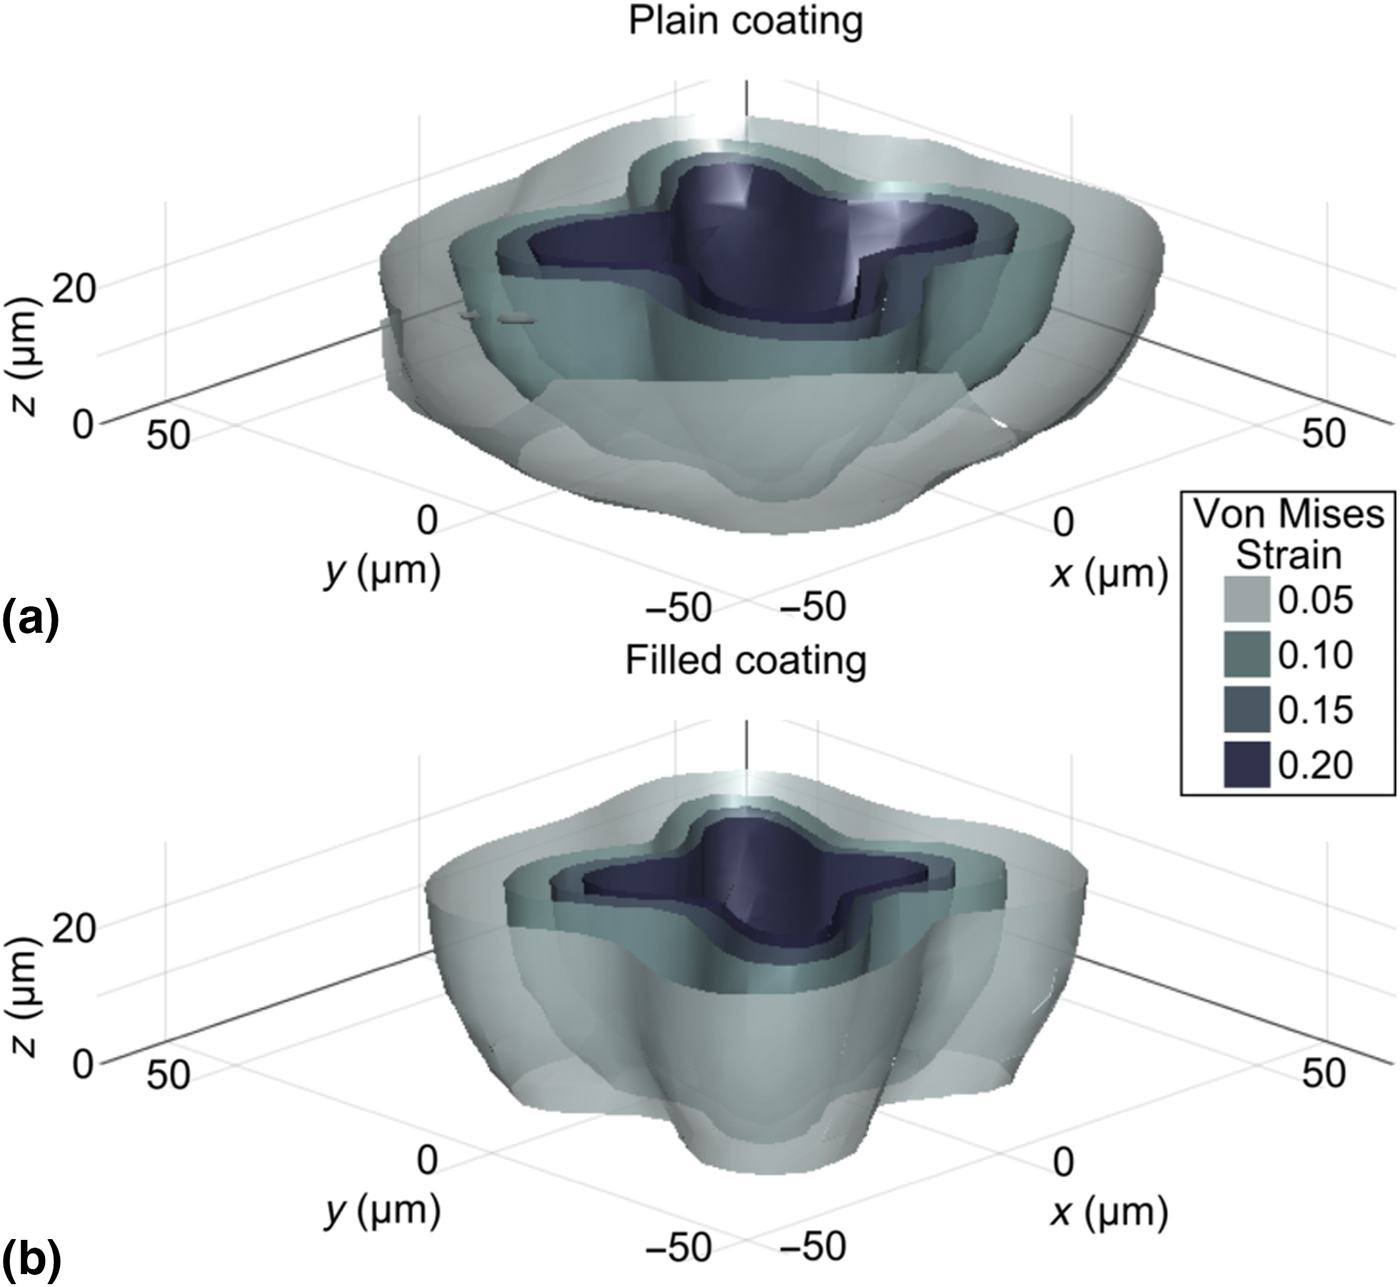
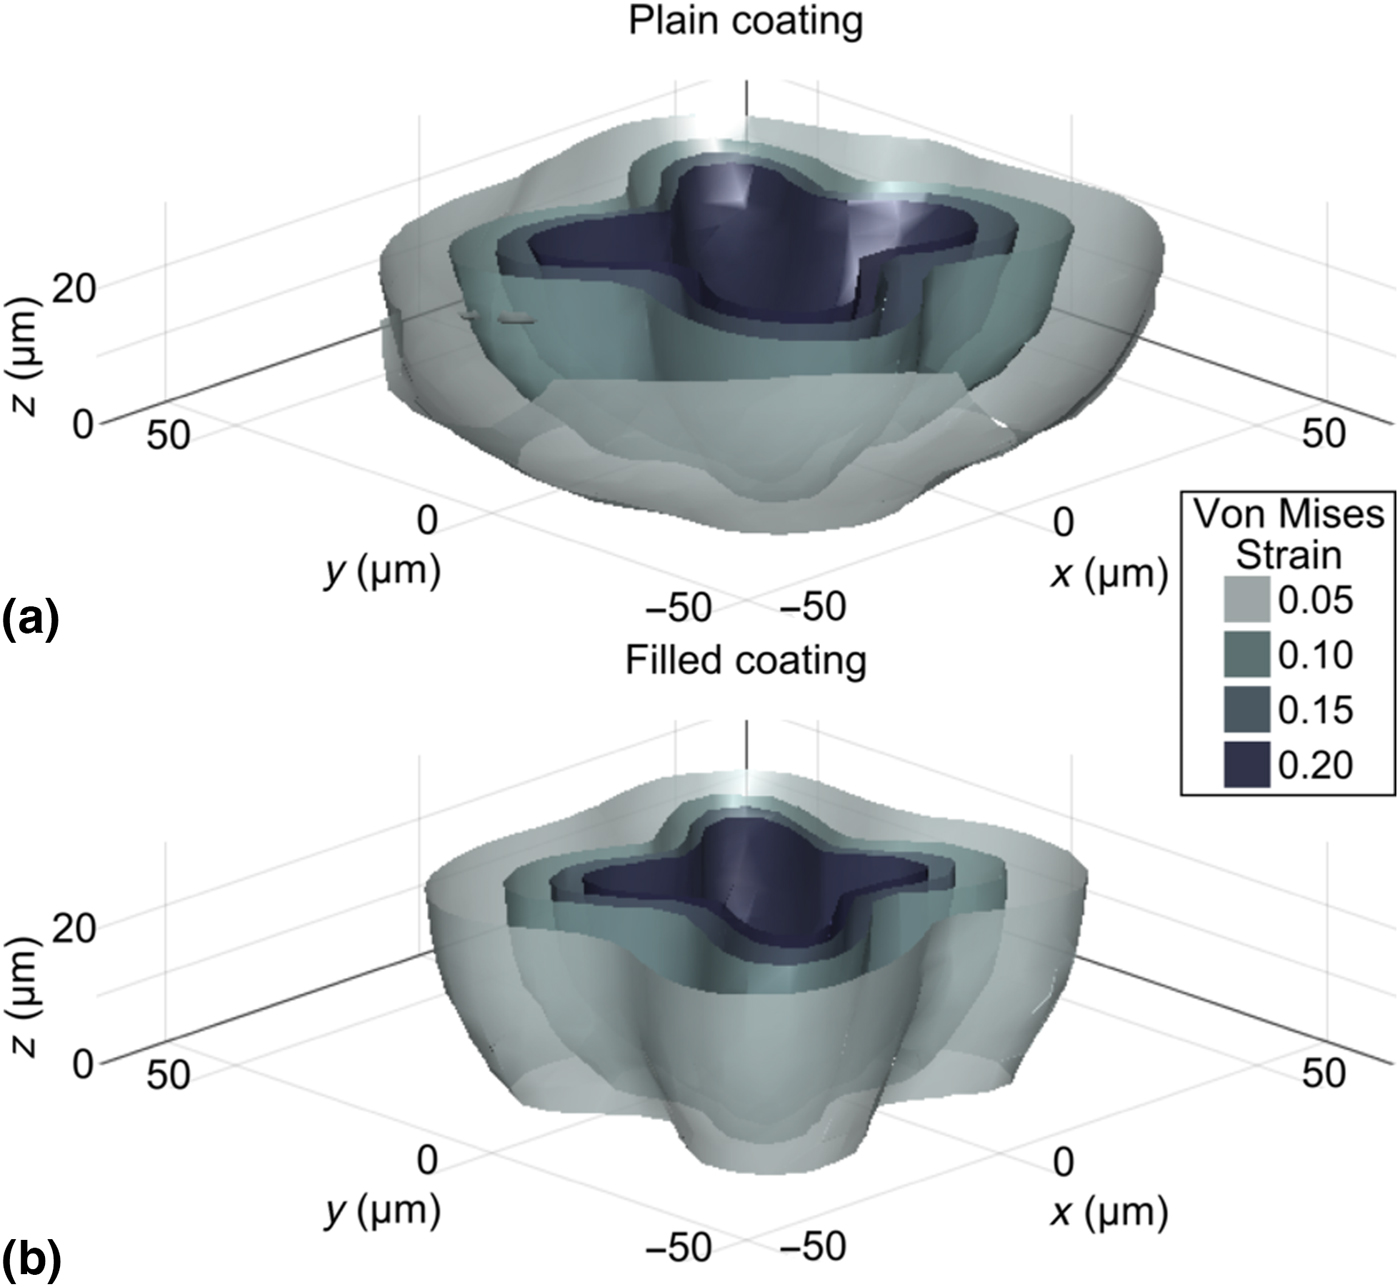
Tracer particles’ paths were analyzed to calculate the local 3D displacement and strain fields in the samples during indentation. To highlight the distribution and magnitude of the strain field and to provide insight regarding non-linear behavior in the coating, Fig. 6 shows characteristic surfaces of constant von Mises strain from 5% to 20% for plain and filled samples. These plots show the strain field during indentation when the tip height is zero, i.e., when the diamond tip contacts the coating–glass interface, but can be similarly calculated throughout the indentation process. See Supplementary Material for movies of von Mises strain surfaces for all experiments (Supplementary Movies S2). The threshold yield strain of the plain and filled coatings is unknown and the two may be different. Nonetheless, these constant-strain surfaces highlight the shape and magnitude of the deformation field during indentation, including lobes that correspond to the sharp edges of the pyramid-shaped diamond tip. Interestingly, we observed that the strain field in the filled coatings had a similar shape to the strain field in plain coatings, but with a slightly lower volume enclosed within a given contour level. There may also be slight differences in the shape between plain and filled coatings. In particular, we noted that samples with filled coatings tended to have more defined lobes than plain coatings.
Characteristic surfaces of constant von Mises strain highlighted at various levels from 5% to 20%, shown for (a) plain and (b) filled coatings. Both plots show the strain field in undeformed coordinates at the point when the tip is closest to the coating–glass interface (i.e., h ≅ 0 µm). The four lobes correspond to the four sharp edges of the pyramid-shaped diamond indenter.
Discussion
This experiment used a custom confocal method to visualize the 3D behavior of thin epoxy coatings on glass substrates during indentation with a pyramid-shaped diamond tip (Fig. 1). In addition to recording the bulk force and tip-displacement response, tracer particles embedded in the coatings were tracked in 3D during indentation in order to measure the microscale flow behavior within the coating, including displacement and strain fields. Coatings with and without nanosilica bead filler were compared to elucidate the effects of nanosilica doping.
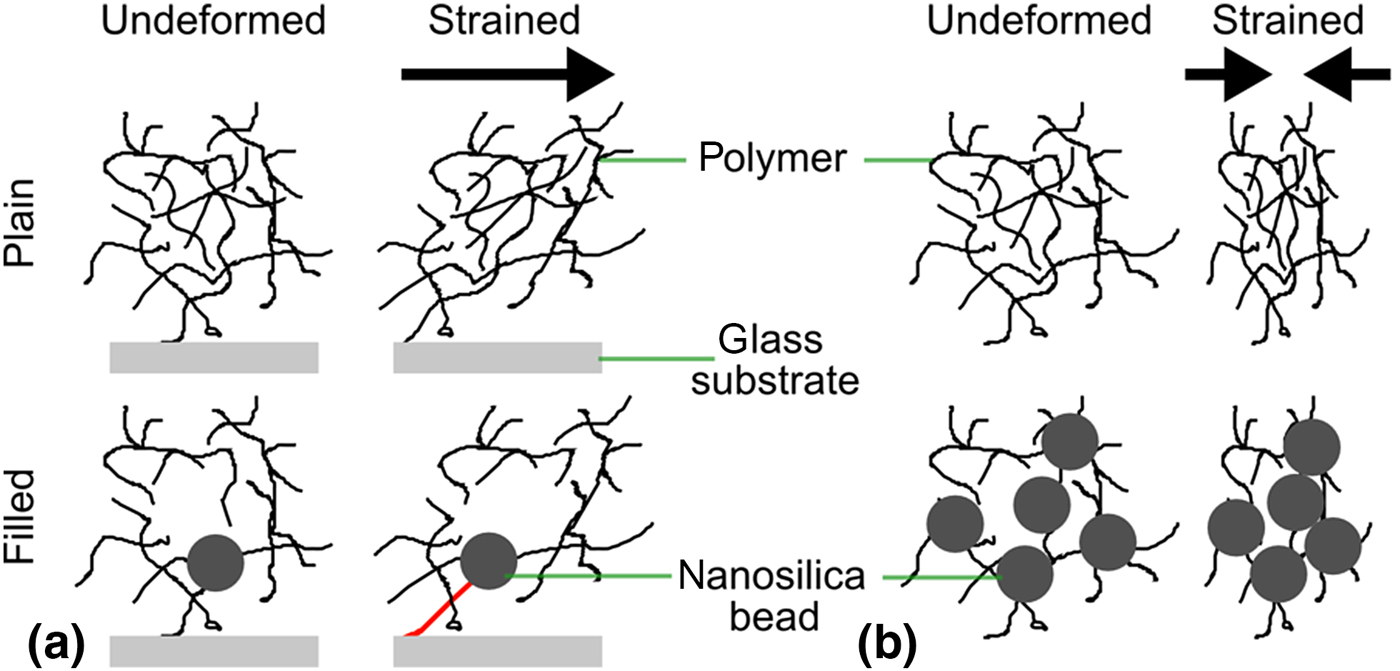
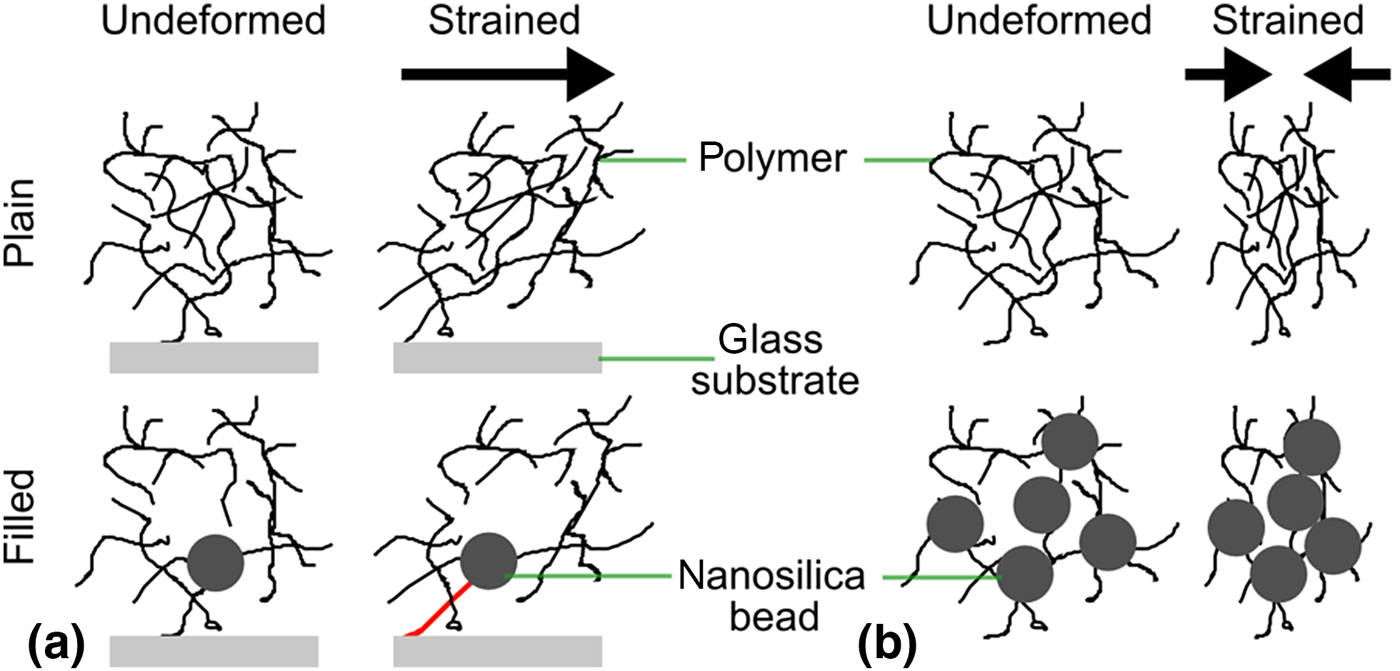
In bulk measurements [Fig. 1(b)], filled coatings exhibited ≈30% higher force than plain coatings. This is consistent with, though slightly lower than the ≈50% modulus enhancement due to filling, as measured by traditional mechanical testing of the bulk material. On the microscale, the flow fields of plain and filled coatings became increasingly distinct in stages 2 and 3, as the tip approached and penetrated the glass. In particular, in the filled samples, tracer particles flowed farther laterally (Figs. 2 and 3). In filled coatings, the radial displacement as a function of particle height approached a non-zero value as height tended toward zero (Fig. 4). These differences implied slip at the coating–glass interface, which was more pronounced in filled coatings. Thus, the slip was characterized by observing the tracer particle paths near the interface with large radial displacements [Fig. 5(a)]. Using this method, slip at the interface was observed in all samples. However, as the tip neared the glass interface, filled samples showed a larger slip area which developed at a faster rate with respect to tip height, h [Fig. 5(b)]. This higher magnitude and rate of slip could be explained by the presence of the nanosilica beads. For example, consider the mechanisms illustrated in Fig. 7. Initially, the nanosilica beads, if present, would be chemically bonded to the glass substrate[ Reference Ragosta, Abbate, Musto, Scarinzi and Mascia 6 , Reference Lee and Yee 27 ]. Because of this structure, as the coating deforms laterally, the polymer connection between the bead and glass would be increasingly tensed to the point of rupture [Fig. 7(a)]. However, without beads, this strain could dissipate throughout a larger network structure, thus avoiding rupture. Similarly, the nanosilica beads are very stiff relative to the surrounding polymer network. Thus, once slip has started, it could proceed more rapidly in filled coatings because the beads would absorb comparatively little deformation, and instead transfer forces further laterally, enhancing slip growth [Fig. 7(b)].
Illustration of the proposed mechanisms of slip in plain and filled coatings. (a) In plain coatings, the entire polymer network can absorb shear strain. In filled coatings, however, the silica nanoparticles bond directly to the glass interface, leading to strain concentration and failure of this bond. (b) Because nanosilica particles are very stiff compared with the surrounding polymer network, the compressive strain may cause relatively more densification in the filled coating, and this may subsequently explain the different rates of slip observed in plain versus filled coatings.
Tracer particle tracks were also used to compute local 3D strain fields throughout the indentation process. In particular, the local von Mises strain had a consistent shape across all experiments, including four lobes of high strain around the corners of the pyramid indenter (Fig. 6). While the shape was similar, the overall volume contained in a given strain contour was consistently lower in the filled coatings as compared with plain, despite comparing them at equal tip height (h = 0; i.e., equal strain boundary conditions). The filled-coating samples also retained more distinct lobes. This observation may again be explained by the differences in the interfacial slip between the two samples. Importantly, the strain measured here represents strain in the coating material only (i.e., material strain) and does not incorporate any effective strain from relative coating–glass displacement. As a result, a slip would serve to reduce the strain measured in the coating. Similarly, an increased slip would reduce any effective “pinning” of the strain field at the glass interface, thus freeing the strain field to retain the lobe shape resulting from the diamond tip's geometry.
Slip is common in these coated-glass systems and previous studies have used indentation testing and the onset of slip to study adhesion and failure. For example, Ritter et al. developed microindentation to measure the adhesive shear strength of polymer coatings on glass, using both ball and Vickers-type indenters[ Reference Ritter, Lardner, Rosenfeld and Lin 10 , Reference Ritter and Rosenfeld 20 ]. This slip may also be important for load transfer between coating and substrate and thus have important implications for the ability of such coatings to protect the underlying glass. In future work, it would be interesting to examine the relationship between nanoparticle filler concentration, coating–glass adhesion, and coating properties after plastic deformation. Recent literature has lauded the benefits of nanosilica beads in polymer coatings for increasing toughness without compromising other mechanical benefits[ Reference Kinloch, Mohammed, Taylor, Eger, Sprenger and Egan 5 – Reference Hsieh, Kinloch, Masania, Lee, Taylor and Sprenger 8 ]. The results of this study reveal that nanosilica-filled coatings may be more susceptible to interfacial slip at a glass surface than plain coatings. This effectively reduces the material strain in filled coatings and likely alters the stress field in the underlying glass while increasing the energy absorbed at the interface.
Understanding local coating behavior is essential for studying coated glass systems as a whole. Ritter et al. also observed pile-up around the indenter in polymer-coated glass systems and applied a load-sharing model to understand the bulk force response[ Reference Ritter, Gu and Lardner 4 , Reference Ritter, Sioui and Lardner 9 ]. Others have similarly developed theoretical models and used simulation and finite element modeling to understand the local distribution of stresses in coated or layered systems[ Reference Hakiri, Matsuda and Sakai 15 , Reference Gao, Jing and Subhash 19 , Reference Bull 21 ]. In contrast, the method developed here enables direct experimental visualization of the local coating deformation, complementing existing theoretical and modeling approaches. The method used in this study could also be repeated with the addition of stress-sensitive dyes to enable direct, 3D visualization of the stress field[ Reference Gossweiler, Hewage, Soriano, Wang, Welshofer, Zhao and Craig 28 , Reference Celestine, Beiermann, May, Moore, Sottos and White 29 ].
This method provided detailed information about indentation but was not without limitations. In particular, confocal imaging requirements limit sample geometry and introduce trade-offs between resolution and field-of-view. In order to achieve high spatial resolution, a high magnification objective with a correspondingly low working distance of about 100 µm was used. Similarly, high magnification corresponds to small field-of-view and important sample behaviors may occur on larger length scales, outside the imaging field. Despite high-speed imaging, it takes multiple seconds to image the entire field-of-view, thus limiting the temporal resolution. Despite these limitations, the imaging parameters may be adjusted to capture the physical time and length scales of interest. This technique is also limited by the tracer particles. Not only must they be incorporated, but the imaging resolution must also be appropriate to track these tracer particles, though their size is somewhat adjustable. The amount and distribution of tracer particles similarly sets the spatial resolution of resulting 3D displacement and strain fields. Nonetheless, the tracer particles enable the local 3D microscale deformation and strain to be tracked in situ.
Overall, the method presented here provides unprecedented access to information about microscale processes in 3D throughout indentation. In particular, we directly observed and quantitatively characterized indentation flow in situ on the micrometer scale in order to better understand glass–coating interactions, adhesive failure, and the role of silica nanoparticle fillers. This experimental method directly complements existing theoretical and modeling approaches to understanding these phenomena and is applicable to a wide array of mechanical phenomena.
Supplementary material
The supplementary material for this article can be found at https://doi.org/10.1557/mrc.2017.114.
Acknowledgments
L.R.B. was supported by an award from Corning Research and Development Corporation to Cornell University. N.Y.C.L. and I.C. were supported by NSF DMR-CMP 1507607. J.L.L., M.L.S., D.A.C., M.J.L., J.R.M., G.S.G., and M.E.D. are employees of Corning Research and Development Corporation.