INTRODUCTION
Canola (Brassica napus L.) is one of the major oilseed crops. In Australia, it is mainly produced in the medium-to-high rainfall wheat belt as it is thought to be less drought-tolerant compared to other winter crops, such as wheat. On the other hand, Indian mustard (Brassica juncea L.) is often suggested as a potentially profitable crop for low rainfall cropping regions because it may have greater drought tolerance than canola (Gunasekera et al., Reference Gunasekera, Martin, Siddique and Walton2006a, Reference Gunasekera, Martin, Siddique and Walton2006b; Parker, Reference Parker and Shea1999; Potter et al., Reference Potter, Ludwig, Kay and Walton1997). In osmotically adjusting leaves, mustard stomata remain partially open to a lower water potential than canola, allowing photosynthetic activity to continue during soil water deficit (Ludlow, Reference Ludlow and Biggins1987). Osmotic adjustment can also delay senescence and death (Flower and Ludlow, Reference Flower and Ludlow1987) and improve root growth and water extraction from the soil (Turner, Reference Turner1996; Turner et al., Reference Turner, Wright and Siddique2001). The longer the leaves and other plant parts survive during grain filling, the more they can contribute to yield by supplying carbon to developing seeds by maintaining photosynthetic activity of remaining leaves (Ludlow and Muchow, Reference Ludlow and Muchow1990). In theory, this tactic should allow maintenance of higher harvest index under water deficit. However, easily improved water extraction and sustained transpiration runs the risk of exhausting the soil water supply leading to insufficient moisture for effective pod photosynthesis and grain filling. Some studies have shown that mustard yielded more than canola when grown in a water-limited condition;12.5% more seed and 36% more dry matter (Angus and Herwaarden, Reference Angus and van Herwaarden1989) and 12% to 67% more seed yield (Oram, Reference Oram1987). However, overall mustard yields less than canola in Australia and, consequently, the commercial area of mustard crop is very small.
Water stress during and after flowering has a more adverse effect on seed yield than during other stages of plant development (Singh et al., Reference Singh, Singh, Sharma and Turner1987) probably due to susceptibility of pollen development, anthesis and fertilisation leading to lower seed yield (Champolivier and Merrin, Reference Champolivier and Merrin1996; Faraji et al., Reference Faraji, Lattifi, Soltani and Shirani-rad2009; Masoud Sinaki et al., Reference Masoud Sinaki, Majidi Heravan, Shirani Rad, Noormohammadi and Zarei2007). Gunasekera (Reference Gunasekera2003) concluded that water stress after flowering adversely affects dry matter and seed yield of both mustard and canola confirming that the reproductive period is the most susceptible to stress (Mendham and Salisbury, Reference Mendham, Salisbury, Kimber and McGregor1995). In Australia, the reproductive stage of Brassica crops (early spring) is often exposed to water stress. In south-eastern Australia, during the winter months of June and July, on average, evapotranspiration is less than rainfall; in August, they are almost equal. However, in September, October, and November, average evapotranspiration is about 2, 3, and 5 times the average amount of rainfall respectively. This pattern creates crop moisture stress during the flowering and reproductive period leading to high yield loss.
Broad-acre crops such as canola are planted in autumn. Vegetative growth occurs during winter, reproductive growth occurs in spring as temperature rises and days become longer, maturity occurs in late spring or early summer. As a result, soil moisture is usually the most limiting factor for crop growth especially during late spring (Loss and Siddique, Reference Loss and Siddique1994) and it is usually exhausted by crop maturity. Canola yields are thus limited by the short duration of the growing season and the severity of soil moisture deficits experienced during late reproductive development. If irrigation water is available, it is most effective if applied immediately prior to the commencement of flowering and a late irrigation to improve grain filling.
Mustard is purported to be more suitable to the semiarid Mediterranean environments but few studies have been conducted to test its adaptation in these environments. Although several studies have discussed the physiological and agronomic reasons for high water stress tolerance of mustard, actual crop evapotranspiration (which is essential in determining crop water productivity) has not been reported. The objective of this study was to examine the response to irrigation of two Brassica species: canola (Brassica napus L.) and mustard (Brassica juncea L.). Responses were measured in terms of water use (root zone water dynamics), stomatal conductance, biomass, seed yield, and seed quality (oil content, protein content and glucosinolates).
MATERIALS AND METHODS
Description of the experimental site and experimental design
The experiments were conducted in 2011 and 2012 at the field experimental site of NSW Department of Primary Industries at Wagga Wagga, Riverina region, NSW in Australia (35o03’S; 147o21’E; 235 m asl). The Riverina region has a Mediterranean-type climate with a mixed farming system of winter cereal crops, some summer crops, and pasture grazing lands. It is characterized by a semiarid climate, with hot summers and cool winters (Stern et al., Reference Stern, de Hoedt and Ernst2000). The soil in the study area is sandy clay loam (a red Kandosol) with a marked B horizon and subsoil with high clay content. Soil physical properties description can be found in Zeleke et al. (Reference Zeleke, Luckett and Cowley2011). The experiment was a randomized factorial design with two Brassica species by two water treatments, replicated three times. The two cultivars were canola (cv. Skipton) and canola-quality Indian mustard (cv. Oasis). Oasis is a Clearfield-resistant cultivar.
The watering regimes were ‘only rainfall’, hereafter called ‘stressed’, and irrigated (in addition to rainfall), hereafter called ‘irrigated’. There were 12 experimental plots and 12 buffer plots, each of size 1.8 m × 10 m with 8 tyne rows. Six of the 12 experimental plots were fitted with a drip irrigation system. The border plots on either side of irrigated plots also had drip irrigation installed to create matching buffer conditions. There were two neutron probe access tubes per experimental plot for soil water measurements.
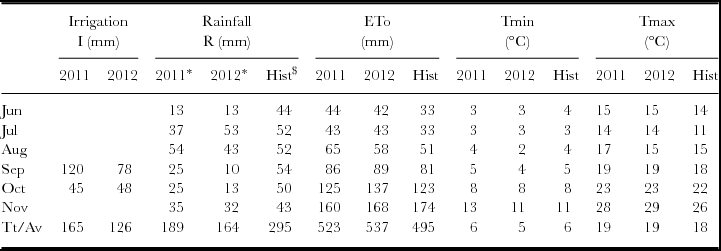
In 2011, the crops were sown on 16 June and harvested on 16 November. In 2012, the sowing date was 4 June and the harvest date was 19 November. All agronomic practices, except for moisture, were maintained at a level of best-practice for the local production region. Fertilizer (22N : 1P : 0K : 15S) was applied at a rate of 130 kg ha−1. Mean monthly historical climatic data, and weather conditions during the two growing seasons, are given in Table 1.
Weather data and irrigation during the experimental seasons (2011 and 2012) and long term averages for the winter cropping months at Wagga Wagga, NSW (Australia). ETo = Evapotranspiration, Tmin = Daily minimum temperature, Tmax = Daily maximum temperature.
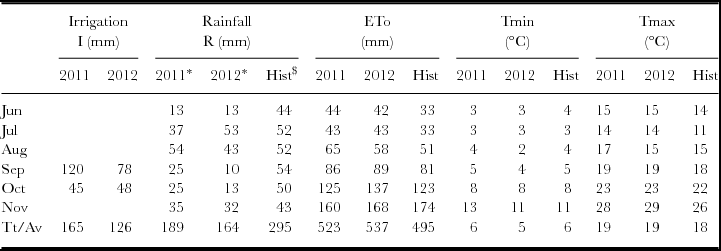
* Rainfall in 2011 and 2012 is only for the actual duration of the crop growth (16 Jun – 16 Nov 2011 and 4 Jun – 19 Nov 2012)
$ Historical average for the years 1941 to 2009 inclusive.
In 2011 there was 189 mm of in-crop rainfall, while in 2012 there was 164 mm. In both years rainfall was below the long-term average, while evapotranspiration was higher than the long-term average. Maximum temperatures were about 1°C higher, while minimum temperatures were almost the same as the long-term average.
Irrigation application
Irrigation was applied using four drip lines per plot, with one line per two crop rows. The drippers were spaced 30 cm apart with a flow rate of 1.6 L/hr. Irrigation was controlled with an automatic meter fitted at the inlet to the irrigation mainline. Irrigation was applied during the flowering stage as it is the most sensitive stage to water stress. In 2011 the first irrigation was applied on 5 September and the last irrigation was applied on 21 October. In 2012 the first irrigation was applied on 6 September and the last irrigation on 6 October. In 2011 and 2012 the total amount of irrigation water applied was 165 mm and 126 mm, respectively.
Stomatal conductance
A leaf porometer (Model SC-1, Decagon Devices, Inc., 2008) was used to measure stomatal conductance approximately every two weeks. Measurements were performed on five leaves per plot from early spring to senescence on clear days around noon. The conductance is reported in mmol.m−2.s−1.
Seed quality
Seed oil and protein content was analysed by near infrared reflectance spectrometry (NIR), using an Infratec 1241 grain analyser (FOSS TECATOR V1.52). Glucosinolates were analysed as glucose by a modified method of Heaney and Fenwick (Reference Heaney and Fenwick1981).
Soil water content
Soil water content was measured using soil moisture neutron probe at 15, 30, 45, 60, 90, and 120 cm depths, every two weeks on average. The probe was calibrated for the soil at the site, with a separate calibration used for the top layer.
Soil water balance
Crop water use over a given time interval was determined using the following water balance equation:
 \begin{equation}
ET_a = P + I - DP - R - \Delta S\end{equation}
Where ETa is actual evapotranspiration; P is precipitation; I is depth of irrigation water; DP is deep percolation; R is runoff; and ∆S is change in soil moisture storage.
Neither the amount nor the intensity of rainfall and drip irrigation during the two seasons was sufficient to cause any runoff or deep drainage below the maximum monitoring depth. This is evident from the soil moisture profile which shows almost constant soil moisture content at 120 cm depth. The moisture content at this depth started decreasing towards the end of the respective seasons. Thus in this study, Dp and R are considered negligible, and ETa was calculated as:
 \begin{equation}
ET_a = P + I - \Delta S\end{equation}
Precipitation data were collected from a weather station located about 1 km away from the experiment. The change in soil moisture content was determined from successive soil moisture measurements.
Dry matter, seed yield and harvest index
At maturity, four 1.2 m2 quadrants per plot were cut above ground and put in bags for biomass and grain yield determination. These were dried in ventilated ovens for 48 hours and weighed to determine dry matter, then hand-threshed and the grain separated from the trash in a Kimseed cleaner that uses moving air to cause the separation. Harvest index (HI) was calculated as the ratio of seed weight to the total above ground dry matter at harvest. This measure underestimates the overall HI because senesced leaves in canola and mustard drop to the ground and are not included in the calculations. The 1000 seed weight was determined using a Contador seed counter. The clean, dried seeds were used to determine oil content, protein content, and glucosinolates.
Water use efficiency
Water use efficiency on a dry matter basis (WUEdm) was determined as
 \begin{equation}
WUE_{dm} = \frac{{DM}}{{ET_a }}\end{equation}
Water use efficiency on a seed yield basis (WUEgr) was determined as
 \begin{equation}
WUE_{gr} = \frac{\rm Y}{{ET_a }}\end{equation}
Where DM = dry matter (biomass) production (kg ha−1); ETa = actual evapotranspiration (mm); and Y = grain yield (kg ha−1).
RESULTS AND DISCUSSION
Stomatal conductance
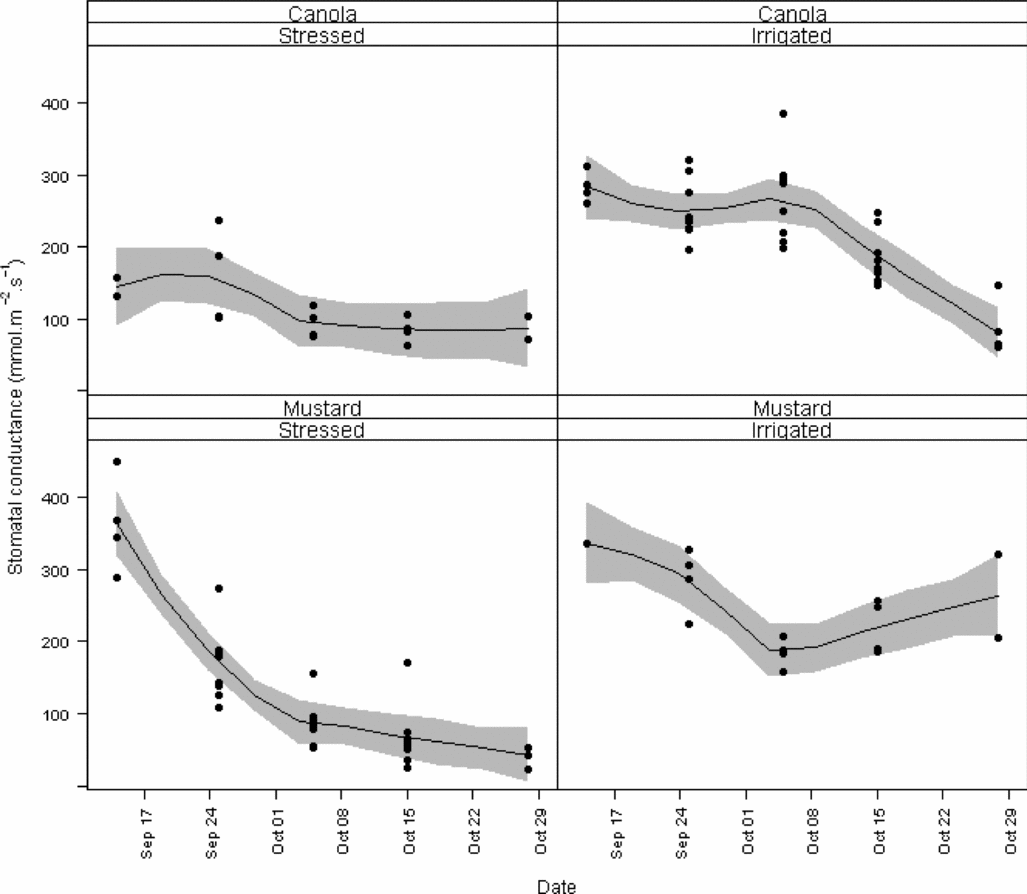
Stomatal conductance was measured on five different occasions during and after the flowering period (Figure 1) of the second year of the experiment (2012). There was significant (p < 0.05) difference in stomatal conductance between the two species and the two water availability treatments. During the flowering and immediate post-flowering period, the stomatal conductance of stressed mustard was higher than that of canola. As this period is critical in determining the crop yield, it might be the reason for better performance of mustard under water-limited conditions. Wright et al. (Reference Wright, Morgan, Jessop and Cass1995, Reference Wright, Morgan and Jessop1996) indicated that the greater leaf turgor of mustard was a key factor in this crop's adaptive advantage over canola, allowing it to maintain a higher leaf area duration, greater crop dry weight, and higher seed yield. As expected, the stressed treatments had lower stomatal conductance compared to the irrigated treatments.
Stomatal conductance of stressed and irrigated canola and mustard during flowering and post flowering period in 2012. The shaded band is +/− standard error at 95% level.

Soil water content dynamics
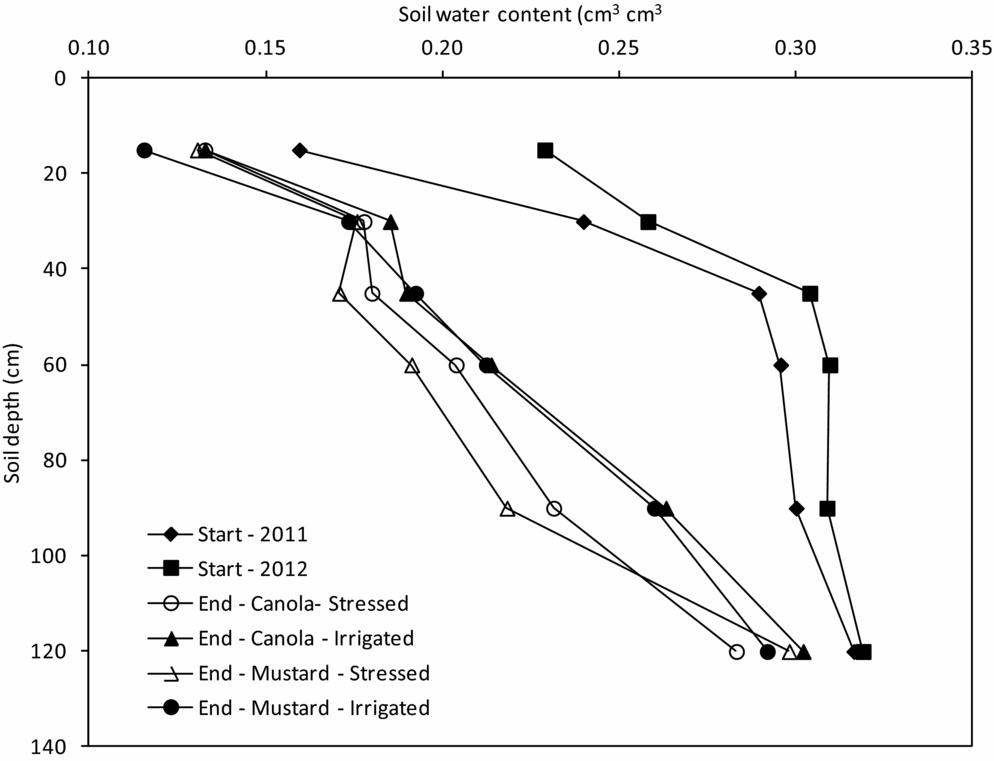
Figure 2 shows the soil water content at different soil depths and different times after sowing. The isolines were plotted from point-measurements using the R system (R Development Core Team, 2009). There was significant (p < 0.05) difference between the two species and also between the two watering treatments. Since there was no significant difference between the two years data, the average of two years is presented in Figure 2. During the winter months, the soil water content was above the average permanent wilting point (0.22 cm3 cm−3 for the red Kandosol). Towards the end of winter (about 95 days after sowing), the soil water content started to drop below the wilting point. In the irrigated treatment, irrigation was applied at this point in time and, as a result, the soil water content was refilled. The soil water content of the irrigated plots dropped below the permanent wilting point only towards the end of the season. In contrast, the soil water content of the stressed plots continued to steadily decrease, as expected. During the flowering and post flowering periods in spring, the soil was generally drier under mustard than under canola in both treatments, particularly deeper in the soil profile (60 and 90 cm depths) as can be seen in Figures 2 and 3; the difference in volumetric water content being higher in the stressed treatments. Gunasakera et al. (Reference Gunasakera, French, Martin and Siddique2009) also reported similar observation with mustard using 32 mm more water than canola.
Volumetric (cm3 cm−3) soil water content at different depths (cm) and times after sowing for stressed and irrigated canola and mustard as average of two years (2011 and 2012) data.
Change in water content of the soil profile from the start of the season (sowing) to the end of the season (harvest) for stressed and irrigated canola and mustard as average for 2011 and 2012.
Figure 3 shows the soil moisture content at the beginning and end of the two seasons. For both seasons, the average initial soil profile water content is shown. The pattern of water extraction was very similar in different years for both crops. As a result, the average profile is presented in Figure 3. The end-of-season soil profile water content of mustard was only slightly lower than that of canola. The crops in the stressed treatment depleted more soil water than that of irrigated treatment crops. The soil water extraction follows a linear pattern with depth. The soil water content at 120 cm was depleted by only a small amount (0.32 to 0.29 cm3 cm−3) indicating low root activity at this depth. The highest extraction (from 0.30 to 0.17 cm3 cm−3) occurred at 45 cm depth. Soil water content at the start of the 2011 experiment was lower than that of 2012. However, the in-crop water input in 2011 (354 mm) was higher than that of 2012 (290 mm).
Actual crop evapotranspiration
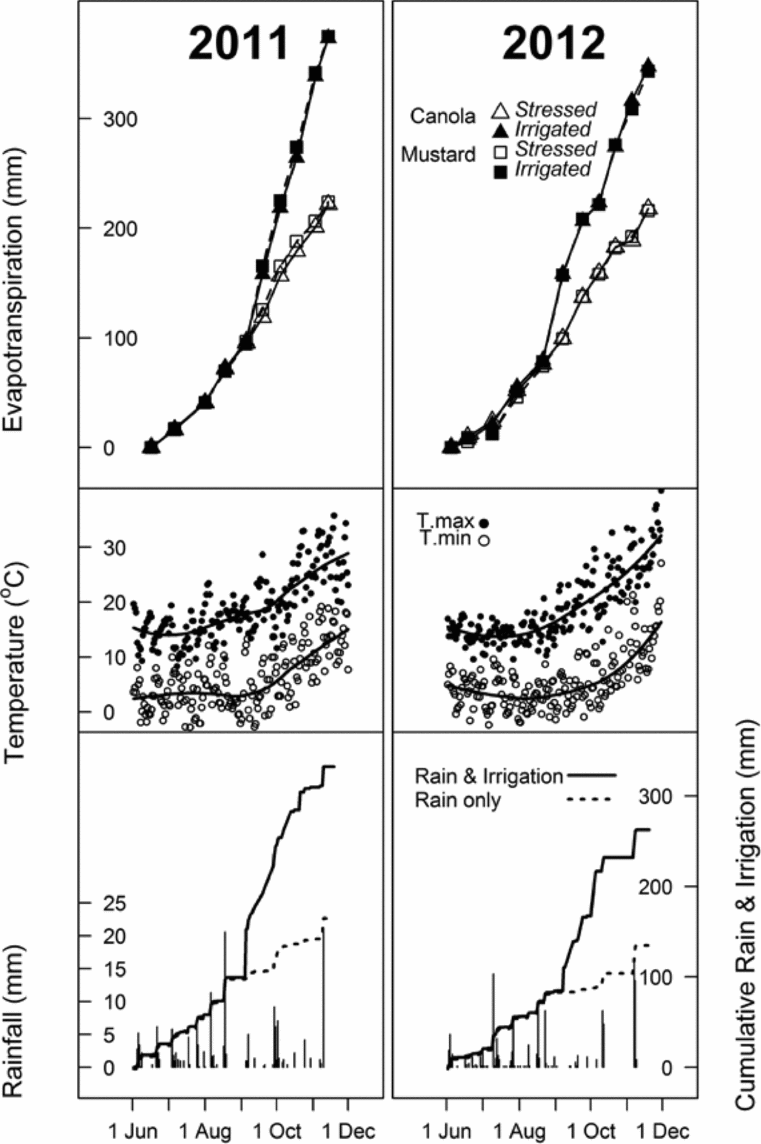
The cumulative change of root zone water balance components for 2011 and 2012 are presented in Figure 4. It can be seen that the amount and the water-use trend of the two crops is very similar. Crop water use sharply increased at the start of spring. That was the time when water input (rain + irrigation) sharply increased in the irrigated treatments due to high initial irrigation at the start of spring. However, water input for the stressed treatments did not show this increase due to relatively low rainfall in both seasons.
Components of soil water balance in irrigated and stressed treatments of canola and mustard during 2011 and 2012 winter crop growing seasons. Minimum and maximum temperature is also shown.
Harvest parameters
Biomass
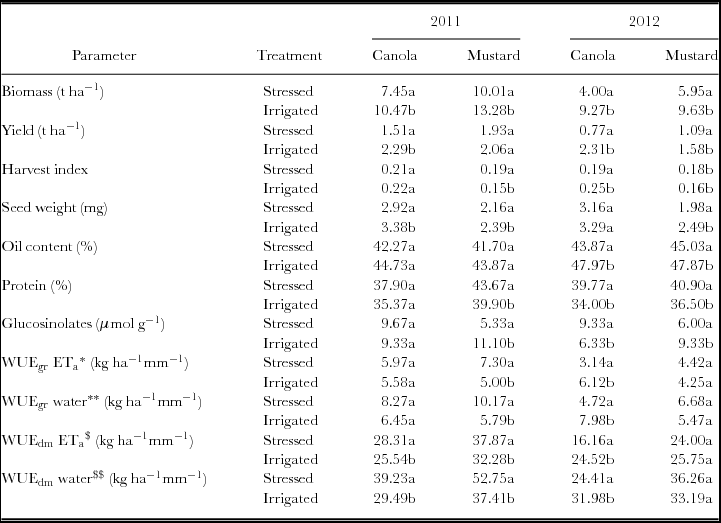
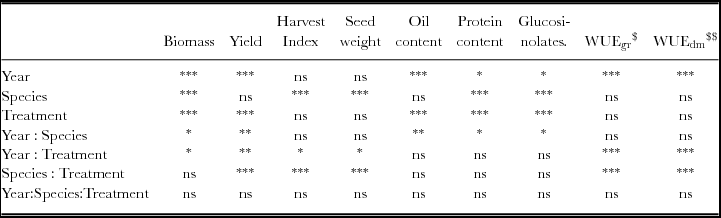
Tables 2 and 3 show the comparison of the effect of water stress and irrigation on the agronomic parameters of the two Brassica species. There was significant (p < 0.05) difference between the above-ground biomass production of the stressed and irrigated treatments and also between the two species. The biomass production of mustard was higher than that of canola in 2011 (34% in stressed and 27% in irrigated treatments). It was also higher by 48% (stressed) and 4% (irrigated) in the second year (2012) of the experiment. There was no significant species × stress interaction for biomass production. However, significant (p < 0.05) year × stress interaction was observed. In both 2011 and 2012, biomass production in the stressed treatment was significantly (p < 0.05) lower than that of the irrigated treatment. The 2012 dry matter production of stressed canola and mustard was 46% and 41% lower than that of the year 2011 due to more favourable rainfall distribution during 2011. From a study which compared canola and mustard performance at multiple sites, Wright et al. (Reference Wright, Morgan, Jessop and Cass1995) found that dry matter production of mustard was higher than that of canola and the difference was highest at sites with the most limited water supply implying that mustard is comparatively well adapted to dry conditions. However, it would appear that the adaptive advantage of mustard to high water deficits is primarily due to greater dry matter production rather than to differences in yield (Wright et al., Reference Wright, Morgan, Jessop and Cass1995).
The effect of irrigation on the performance of canola and mustard (water treatment comparison) grown during the winter crop growing seasons of 2011 and 2012 at Wagga Wagga, NSW (Australia).
In a given column values followed by the same letter are not significantly different at p<0.05
*WUEgr ETa = Water use efficiency of grain yield based on actual evapotranspiration
**WUEgr water = Water use efficiency of grain yield based on in-crop water
$WUEdm ETa = Water use efficiency of dry matter based on actual evapotranspiration
$WUEdm water = Water use efficiency of dry matter based on in-crop water
ANOVA significance table for the effects of crop species, watering treatment, year (season), and their interactions for different agronomic parameters.
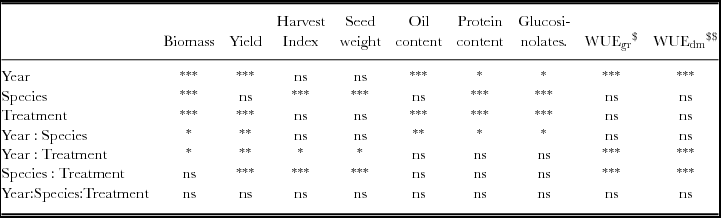
***significant at p<0.001, ** = significant at p<0.01, * = significant at p<0.05, ns = non-significant.
$WUEgr = Water use efficiency based grain yield; $$WUEdm = Water use efficiency based on dry matter.
Grain yield
There was significant (p < 0.05) year × stress and species × stress interaction that determine grain yield, indicating that these two species respond differently to moisture stress. The grain yield of mustard (1.93 t/ha in 2011 and 1.09 t/ha in 2012) was significantly (p < 0.05) higher than that of canola (1.51 t/ha in 2011 and 0.77 t/ha in 2012) under the stressed treatment (Table 2). This indicates that under stressed conditions, mustard yield was 28% higher than that of canola (in the relatively wet year 2011) while in the second year (relatively dry year), it was 42% higher. Grain yield of stressed canola and mustard in 2012 (relatively drought year) was 49% and 43% lower than that of 2011 (the year of relatively better rainfall distribution). This result agrees with studies both in Australia (Angus and van Herwaarden, Reference Angus and van Herwaarden1989; Nikham et al., Reference Niknam, Ma and Turner2003) and India (Kumar et al., Reference Kumar, Singh and Singh1987; Wright et al., Reference Wright, Morgan, Jessop and Cass1995) which reported drought tolerance of mustard. Niknam et al. (Reference Niknam, Ma and Turner2003) reported that the yield of two unirrigated canola cultivars, Hyola 42 and Monty, was reduced by 39 and 24% respectively, while B. juncea cultivars showed only small or no reduction when not irrigated. Yield in both canola and mustard can be related to the amount of dry matter accumulated prior to peak flowering (Wright et al., Reference Wright, Morgan, Jessop and Cass1995). McCaffery et al. (Reference McCaffery, Bambach and Haskins2009) reported that mustard yield can be higher than canola by 30%–50% in Northern NSW (Australia). However, Swedish studies (Ali et al., Reference Ali, Ohlsson and Svensk1988) conducted under relatively non-limiting moisture conditions found no difference between the species. When there is water stress during the flowering period, the seed yield of both Brassica species were markedly reduced (Richards and Thurling, Reference Richards and Thurling1978). However, in general there is a suggestion that high water deficits reduce yield in canola more than in mustard (Wright et al., Reference Wright, Morgan, Jessop and Cass1995) due to drought tolerance characteristics of mustard.
In this study, irrigated canola yield was 11% and 46% higher than that of irrigated mustard in 2011 and 2012, respectively. In 2012, the year with low in-crop rainfall, canola yield was reduced by 66% while mustard decreased only by 31%. In 2011, canola yield reduced by 34% while that of mustard reduced by 6%. Severe stress decreases the duration of reproductive growth (Hall, Reference Hall1992) and stress during the flowering or ripening stages results in large yield losses (Stoker and Carter, Reference Stoker and Carter1984). Gan et al. (Reference Gan, Angadi, Cutforth, Angadi and McDonald2004) found that canola stressed at earlier growth stages exhibited recovery, whereas stress during pod development severely reduced most of the yield components. Masoud Sinaki et al. (Reference Masoud Sinaki, Majidi Heravan, Shirani Rad, Noormohammadi and Zarei2007) found that the highest rapeseed yield reduction was obtained when water stress occurred at flowering, and secondly at the pod development stage.
Harvest index (HI)
There was significant (p < 0.05) species × stress and year x stress interaction. Mustard had significantly (p < 0.05) higher harvest index (HI) in stressed treatment than in irrigated treatment. The HI of mustard was higher (by 27% in 2011 and by 13% in 2012) under stressed treatment than under irrigated treatment. However, for canola the HI in the irrigated treatment was higher (by 5% in 2011 and by 32% in 2012) than that of the stressed treatment. Despite its superior adaptation to post-flowering water stress, mustard had a poorer ability to convert dry matter into seed yield resulting in low HI (Gunasakera et al., Reference Gunasakera, French, Martin and Siddique2009). In the present study during 2011, the HI of canola under stressed and irrigated treatments was almost the same. Gunasakera et al. (Reference Gunasakera, French, Martin and Siddique2009) reported that in stressed treatments, mustard yielded more seed, had a larger harvest index and produced more pods per square meter and seeds per square meter than canola They also found that HI was significantly lower under severe stress compared to mild stress and irrigated treatments.
Seed weight
Significant (p < 0.05) species × stress and year × stress interaction was observed. Mustard seeds (2.2 mg) were significantly smaller (p < 0.05) on average than harvested canola seeds (3.2 mg) under both moisture stress conditions. In contrast, Wright et al. (Reference Wright, Morgan, Jessop and Cass1995) reported that there was no significant difference between the species in seed weight or seeds per pod, although the number of seeds per pod was greater in mustard.
Seeds from irrigated treatments weighed more than that of seeds from stressed treatments. The difference was higher for mustard by 10% and 25% in the 2011 and 2012, respectively. These values were 16% and 4% for canola. In a study which analysed the effect of irrigation on mustard, Sharma and Singh (Reference Sharma and Singh1993) found that seed weight is significantly higher (p < 0.05) in irrigated as compared with the stressed treatments with irrigated mustard seed weight as much as 3.4 times higher than the stressed mustard. McGregor (Reference McGregor1987) found that 1000 seed weight was not strongly influenced by environmental conditions but these may have been assessed in non-limiting moisture conditions. Previously, Krogman and Hobbs (Reference Krogman and Hobbs1975) concluded that 1000 seed weight was increased with irrigation. Grain yield is the product of seed weight and seed number. As the seed weight of canola is higher than that of mustard, when yield was higher in mustard it must be the result of higher seed number.
Dry matter water use efficiency
From Figure 4 it can be seen that, for stressed treatments, crop water use was higher than the total amount of rainfall; indicating the crop was depleting soil water stored during the winter months. If the water input is higher than crop water use (in irrigated treatments), soil water storage can increase to a level higher than at the start of season. However, in this study, in both years and under both crops the soil water content decreased from sowing to harvest indicating soil water depletion. As a result, as indicated in Table 2, water use efficiency was expressed both as a function of crop evapotranspiration and in-crop water supply (rainfall + irrigation). In addition to the in-crop water input (rainfall and irrigation), actual evapotranspiration includes water depleted from the stored soil water at the start of the season. Water use efficiency expressed as a function of in season-water was higher as it excludes the soil profile water storage at the start of the season.
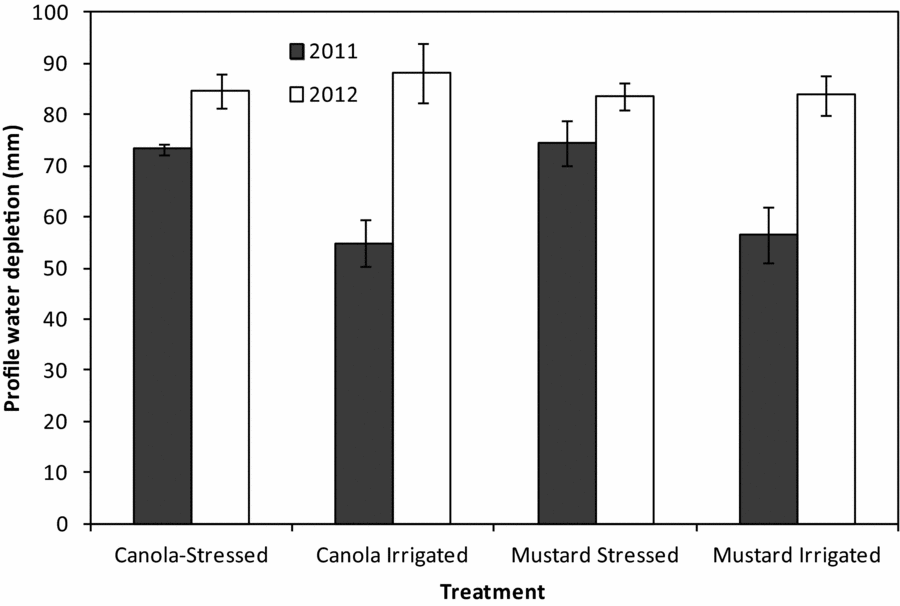
The total amount of in-crop water was 18.1% lower in 2012 for the irrigated treatment, and 13.2% lower for the stressed treatment compared to that of the 2011. However, the corresponding crop water use ETa was only 8.6% (irrigated treatment) and 4.1% (stressed treatment) lower. This is due to the relatively higher start-of-season soil water content in 2012. Figure 5 shows the amount of water depleted from the soil profile during the crops’ growing season. The soil water depletion was higher in 2012 (84 mm in stressed and 86 mm in irrigated treatments) than in 2011 (74 mm in stressed and 56 mm in irrigated treatments).
Soil profile water depletion over the growing season of stressed and irrigated canola in 2011 and 2012. Standard error bars are also shown.
There was significant (p < 0.05) species × stress and year × stress interaction for water use efficiency on a dry matter basis (WUEdm). WUEdm of mustard was significantly higher (p < 0.05) than that of canola, with the difference being higher under stressed treatments. In 2011 (the year of relatively better rainfall condition), WUEdm was higher in stressed treatments than in irrigated treatments. In 2012 (the relatively drought year), WUEdm in irrigated treatments was higher than that of stressed treatments. Gunasakera et al. (Reference Gunasakera, French, Martin and Siddique2009) found that WUEdm did not differ significantly between stress treatments, but was higher in mustard than in canola.
One current hypothesis is that mustard is more drought tolerant than canola because it has greater capacity for osmotic adjustment, enabling it to produce more DM under stressful conditions and potentially partition it more efficiently between seed and vegetative plant parts (Gunasekera et al., Reference Gunasekera, Martin, Siddique and Walton2006a; Lewis and Thurling, Reference Lewis and Thurling1994; Niknam et al., Reference Niknam, Ma and Turner2003). Mustard may employ one or more of a range of traits to increase its drought tolerance: improved root growth and increased soil water extraction, maintenance of stomatal conductance and photosynthesis at low leaf water potential, and/or delayed leaf senescence. The greater WUEdm of mustard measured in this study is consistent with its better maintenance of photosynthesis at low leaf water potential (Gunasakera et al., Reference Gunasakera, French, Martin and Siddique2009).
Grain water use efficiency
Similar to that of the above-ground dry matter, there was significant (p < 0.05) species × stress and year × stress interaction effect for WUEgr expressed in terms of actual evapotranspiration ETa and in-crop water input. WUEgr of canola was higher when irrigated, while that of mustard was higher when stressed. WUEgr of canola was higher than that of mustard in irrigated treatments and it was lower under stressed treatments (p < 0.05). For example, in the first year, WUEgr of mustard under stressed condition was 46% higher than its WUEgr under irrigated condition while for canola this was only 7%. In the second year (higher deficit year) WUEgr of stressed canola was 48% lower than the irrigated one. However, the WUEgr of stressed mustard was 4% higher than that of the irrigated treatment. The literature attributes these differences to variation in how seed yield is achieved in the two species. Niknam et al. (Reference Niknam, Ma and Turner2003) reported that the vigour differences were not carried through to maturity, indicating that under favourable conditions, canola can compensate for slow early growth. The DM production advantage of mustard can also be associated with greater water use. Hocking et al. (Reference Hocking, Kirkegaard, Angus, Gibson and Koetz1997) attributed poorer HI in mustard to greater stem proportion. Seed and dry matter yields of mustard are related to ET of the crop. In a two year study in India, Sharma and Singh (Reference Sharma and Singh1993) found higher WUEgr in one irrigation than in two irrigations mainly because of the difference in seed yield in these two treatments was smaller with a larger difference in ET of the crop.
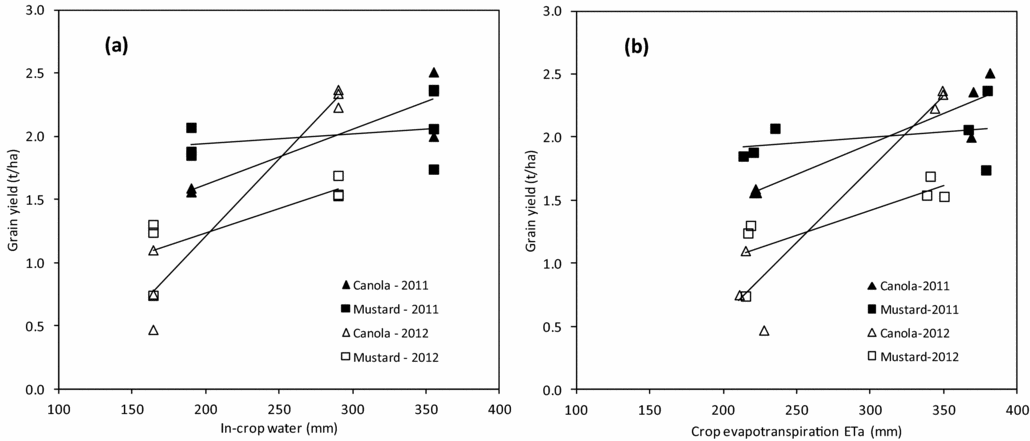
Figure 6 shows the cross-over plot of the relationship between grain yield, in-crop water input (rainfall and irrigation), and crop evapotranspiration. In 2011, the cross-over point is 290 mm of in-crop water and 1.9 t/ha yield. In 2012, these values were 202 mm and 1.2 t/ha. This means when the in-crop soil water drops below these thresholds, mustard yield tends to be higher than that of canola. The implication is that, in this region, when the rainfall amount is less than these thresholds, mustard becomes a favourable crop. Similar trend is observed for yield-evapotranspiration relationship with cross-over values: yield of 2.1 t/ha for evapotranspiration of 315 mm in 2011 and yield of 1.3 t/ha for evapotranspiration of 260 mm in 2012. The difference in in-crop water (88 mm) of 2011 and 2012 was higher than the difference in evapotranspiration (55 mm) indicating that the crop uses more stored water in a relatively dry season (as in 2012). It can be seen also that the slope of the yield-water relation is flatter for mustard showing that the rate of drop of mustard yield is lower than that of canola as water deficit increases.
Crop yield in relation to (a) in-crop water and (b) evapotranspiration for two Brassica species in Southern New South Wales, Australia in 2011 and 2012.
Grain quality parameters
Oil and protein content
There was no significant species × stress interaction for oil content. However, oil content in the irrigated treatments was higher than that of the stressed treatments for both canola and mustard, although the difference was statistically significant (p < 0.05) only in 2012. There was no statistically significant difference between the oil contents of the two crops. Oil content of rain-fed canola and mustard was 7% and 5% lower than the irrigated ones respectively. Positive correlation between post-anthesis water availability and oil content has been reported by several investigations (eg. Henry and McDonald, Reference Henry and McDonald1978; Mailer and Cornish, Reference Mailer and Cornish1987; Niknam et al., Reference Niknam, Ma and Turner2003; Pritchard et al., Reference Pritchard, Eagles, Norton, Salisbury and Nicolas2000; Walton, Reference Walton1999). Mailer and Cornish (Reference Mailer and Cornish1987) found that oil content was 36.9% in well-watered canola plants and 31.4% in stressed plants. Niknam et al. (Reference Niknam, Ma and Turner2003) found that the oil concentration is significantly affected by water treatment than genotype with oil reduction of 6–11% under rainfed condition. Henry and McDonald (Reference Henry and McDonald1978) showed that severe drought decreased oil and increased protein contents of rapeseed. Mendham and Salisbury (Reference Mendham, Salisbury, Kimber and McGregor1995) reported that oil content is the first plant economic yield trait that is reduced when an oil crop is stressed. However, Gunasakera et al. (Reference Gunasakera, French, Martin and Siddique2009) reported that seed oil and protein concentration were not affected by species or moisture level. Mustard has significantly higher protein content compared to canola under both moisture regimes. There was significant year × species interaction for protein content with lower mustard protein content in the relatively dry (second) year.
Glucosinolates
There was significant (p < 0.05) year × species interaction for glucosinolates. Under the stressed treatment, canola had significantly higher glucosinolates than that of mustard. Irrigated mustard had significantly higher glucosinolates than that of irrigated canola. Glucosinolates are goitrogenic compounds; high levels in the seed end up mainly in the meal after oil extraction, where they reduce palatability and cause nutritional problems in non-ruminant animals (Clandinin and Robblie, Reference Clandinin and Robblee1978). The official canola standard is partly based on a low glucosinolate level of < 30 μmol g−1. This standard has been applied not only to Brassica napus but also to B. juncea (Indian Mustard) genotypes bred for canola-quality. Therefore, breeders in both species aim to reduce glucosinolates in new cultivars or maintain the low levels already achieved. Mailer and Cornish (Reference Mailer and Cornish1987) reported that post-flowering water stress increases glucosinolates concentration of B. napus and B. rapa. However, their values (e.g. 21.2 μmol g−1 for post-flowering tressed canola) are much higher than the values obtained in this study.
CONCLUSIONS
Indian mustard (Brassica juncea L.) is reputed to be more drought tolerant than canola and therefore might be better adapted than canola to the Mediterranean-type, short season environments of southern Australia. We have shown that post-flowering water stress reduced biomass production, grain yield, seed weight, and oil content in both canola and mustard. It increased glucosinolates (in canola) and protein content. Water stress increased water use efficiency in mustard while it reduced it in canola. There was no significant difference between the two crops in terms of seed oil concentration. In terms of grain yield and harvest index, canola's response to irrigation is better than that of mustard. If only limited irrigation water is available, it is better to irrigate canola than mustard. Mustard produced greater dry matter than canola under post-flowering water stress condition. This may be a major advantage for the crop when competing with weeds and may also be beneficial if the crop is being grown for forage (cut or grazed). However, as this study is based on only a single genotype of each species, further investigation is required on other genotypes grown under water limited Mediterranean environments.
Acknowledgements
We thank David Roberts, Peter Deane, and Peter Heffernan for technical assistance, and Jamie Ayton of NSW DPI who conducted the seed quality analyses. The lead author was a Research Centre Fellow at the Graham Centre for Agricultural Innovation.