



1 Introduction
In this paper, we report an experimental study to examine the lift generation inside a highly compressible porous layer as a planing surface glides over it.
The fundamental insight of this paper is the outgrowth of the observation and related theoretical studies about the endothelial glycocalyx layer (EGL) that covers the inner surface of our blood vessels. The EGL is a negatively charged, highly porous layer of proteoglycans, plasma proteins and glycosaminoglycans (Henry & Duling Reference Henry and Duling1999; Fu & Tarbell Reference Fu and Tarbell2013). The thickness of EGL, in different observation methods, was found to be of the order of
 $0.1{-}1~\unicode[STIX]{x03BC}\text{m}$
in different types of vessels (Adamson & Clough Reference Adamson and Clough1992; Vink & Duling Reference Vink and Duling1996; Smith et al.
Reference Smith, Long, Daminao and Ley2003; Long et al.
Reference Long, Smith, Pries, Ley and Damiano2004; van den Berg & Vink Reference van den Berg and Vink2006; Gao & Lipowsky Reference Gao and Lipowsky2010; Yen et al.
Reference Yen, Cai, Zeng, Tarbell and Fu2012). While the EGL was first identified fifty years ago by Luft (Reference Luft1966), its ultrastructural and crucial functions were just realized, which includes its important role as a resilient porous hydrodynamic interface for the motion of red and white cells in capillaries (Feng & Weinbaum Reference Feng and Weinbaum2000; Zhao, Chien & Weinbaum Reference Zhao, Chien and Weinbaum2001).
Biologists have wondered why an
 $8~\unicode[STIX]{x03BC}\text{m}$
in diameter red blood cell is able to glide over the EGL and survive 10
 $^{5}$
passages through microcirculation during a typical lifetime of 120 days without being damaged or undergoing hemolysis. Moreover, the red blood cell can travel at velocities that approach 100 times its diameter a second and can also pass, at much lower velocities, through the entrance to a capillary or a highly constricted arteriole of a few
 $\unicode[STIX]{x03BC}\text{m}$
diameters (Secomb, Hsu & Pries Reference Secomb, Hsu and Pries2002). In 2000, Feng & Weinbaum (Reference Feng and Weinbaum2000), hereafter referred to as F&W, attributed this phenomenon to the tremendously enhanced hydrodynamic lifting force as a red blood cell glides over the EGL and rapidly compresses this soft porous layer. A lubrication theory for highly compressible porous media was developed, which shows that: (i) the excess pore pressure generated by a planing surface gliding on the compressible porous media scales as the square of a Brinkman parameter,
 $\unicode[STIX]{x1D6FC}=h_{2}/K_{p}^{0.5}$
, where
 $h_{2}$
is the porous layer thickness at the leading edge and
 $K_{p}$
is the local Darcy permeability; (ii)
 $\unicode[STIX]{x1D6FC}$
is of an order
 $10^{2}$
or larger for red blood cells gliding on the EGL. Thus, the lift forces generated can be four or more orders of magnitude greater than the classical lubrication theory; (iii) even though the mass of a human skiing or snowboarding on fresh snow powder is
 $10^{15}$
times larger than that of a red blood cell gliding over the compressed EGL, they have an unexpected, remarkable hydrodynamic similarity,
 $\unicode[STIX]{x1D6FC}$
is of the same order for both cases; (iv) the physics behind the lift generation phenomena is that, as the soft porous layer is under compression, there is a dramatic increase in hydraulic resistance that the transiently trapped fluid encounters as it escape from the confined boundaries. Weinbaum et al. (Reference Weinbaum, Zhang, Han, Vink and Cowin2003) also predicted that the elastic restoring force of the core proteins of the EGL is at most five per cent of the pore pressure when the red cell is moving at velocities of even a few
 $\unicode[STIX]{x03BC}\text{m}~\text{s}^{-1}$
. Thus, the friction drag from the solid phase will be dramatically reduced.
Following the pioneering work of F&W, significant efforts have been made to understand the lift generation inside a highly compressible porous media (Skotheim & Mahadevan Reference Skotheim and Mahadevan2004; Wu, Andreopoulos & Weinbaum Reference Wu, Andreopoulos and Weinbaum2004a ,Reference Wu, Andreopoulos and Weinbaum b , Reference Wu, Andreopoulos and Weinbaum2006b ; Skotheim & Mahadevan Reference Skotheim and Mahadevan2005; Wu, Weinbaum & Andreopoulos Reference Wu, Weinbaum and Andreopoulos2005a ; Wu et al. Reference Wu, Andreopoulos, Xanthos and Weinbaum2005b , Reference Wu, Igci, Andreopoulos and Weinbaum2006a ; Wu & Ganguly Reference Wu and Ganguly2007; Wu & Sun Reference Wu and Sun2008, Reference Wu and Sun2009, Reference Wu and Sun2011; Barabadi et al. Reference Barabadi, Nathan, Jen and Wu2009; Mirbod, Andreopoulos & Weinbaum Reference Mirbod, Andreopoulos and Weinbaum2009a ,Reference Mirbod, Andreopoulos and Weinbaum b ; Akaydin et al. Reference Akaydin, Pierides, Weinbaum and Andreopoulos2011; Crawford et al. Reference Crawford, Jones, You and Wu2011a ,Reference Crawford, Nathan, Jen, Wang and Wu b , Reference Crawford, Nathan, Wang and Wu2012), from both theoretical and experimental perspectives.
Theoretically, Mirbod et al. (Reference Mirbod, Andreopoulos and Weinbaum2009b ) extended F&W theory by investigating the generation of lifting forces in a random soft porous layer that is confined between two planar surfaces, a horizontal lower boundary and an inclined upper boundary. Lift generation was predicted for the case when the inclined upper boundary slides freely on top of a stationary fibre layer that is attached to the lower boundary. However, no lift is generated when the lower boundary slides freely in its own plane beneath a porous layer that is attached to the inclined upper boundary. Meanwhile, Wu and colleagues (Wu et al. Reference Wu, Igci, Andreopoulos and Weinbaum2006a ,Reference Wu, Andreopoulos and Weinbaum b ; Wu & Ganguly Reference Wu and Ganguly2007; Wu & Sun Reference Wu and Sun2008, Reference Wu and Sun2009, Reference Wu and Sun2011) extended the theoretical approach of F&W to a realistic model for the lift mechanics of downhill skiing and snowboarding. The model incorporates lift contributions from both the transiently trapped air and the compressed solid phase (ice crystals) and predicted multiple equilibrium positions for a snowboarder gliding over a soft snow layer. The contribution of the pore air pressure to the total lift spans a wide range from 30 % to 70 %, corresponding to the different equilibrium positions predicted by this theory. Related to the lift generation inside a soft porous media is the soft porous lubrication studies performed by Skotheim & Mahadevan (Reference Skotheim and Mahadevan2004, Reference Skotheim and Mahadevan2005), where the fluid-induced lubrication at soft interfaces were examined. A narrow fluid gap separates the two sliding surfaces, with a soft porous layer coating one or both surfaces. The fluid pressure generated in the gap between two sliding surfaces deforms the soft porous layer and causes pore pressure generation. Although the elasto-hydrodynamics theory by Skotheim & Mahadevan (Reference Skotheim and Mahadevan2004, Reference Skotheim and Mahadevan2005) differs from the scenario discussed in F&W where the deformation of the porous layer is caused by the planing surface that glides over it, they share the same physics of lift generation in a deforming porous media.
Experimentally, Wu et al. (Reference Wu, Andreopoulos, Xanthos and Weinbaum2005b
) developed a new experimental and theoretical approach to qualitatively verify the feasibility of the lift generation concept. A porous-walled cylinder-piston apparatus was applied in the dynamic vertical compression experiments of snow. A loaded piston was dropped from rest, creating a sudden impact on the soft snow underneath. It showed that for wind-packed snow layer, pore pressure generation occurred in a period of 0.1 s and relaxed in 0.7 s. If one assumes the snowboard is 1.5 m long and the gliding speed is
 $10~\text{m}~\text{s}^{-1}$
, then the approximate time that the snowboard remains in contact with snow layer is 0.15 s. This implies that sufficient time is available to adequately support the weight of the snowboarder by the generated pore air pressure. The basic physics underlying the lift generation in soft porous media proposed by F&W (Reference Feng and Weinbaum2000) was thus verified experimentally. Al-Chidiac et al. (Reference Al-Chidiac, Mirbod, Andreopoulos and Weinbaum2009) modified the experimental set-up in Wu et al. (Reference Wu, Andreopoulos, Xanthos and Weinbaum2005b
) and examined the lifting force from the solid phase of a porous media during the rapid compression process. Load cells were added between two adjacent pressure transducers on the piston of the porous-walled cylinder-piston apparatus. The difference in the readings of the load cell and the average value of the pressure obtained from the two adjacent pressure transducers were employed to indicate the solid phase lifting force. Recently, Wu and colleagues performed a series of studies for the lift generation in a highly compressible porous media during a rapid compression process (Barabadi et al.
Reference Barabadi, Nathan, Jen and Wu2009; Crawford et al.
Reference Crawford, Jones, You and Wu2011a
,Reference Crawford, Nathan, Jen, Wang and Wu
b
, Reference Crawford, Nathan, Wang and Wu2012; Wu et al.
Reference Wu, Santhanam, Nathan and Wang2017a
,Reference Wu, Wang, Zhu and Nathan
b
). These studies provided a thorough and systematic overview of an experimental approach related to the dynamic compression of soft porous media (Barabadi et al.
Reference Barabadi, Nathan, Jen and Wu2009; Crawford et al.
Reference Crawford, Jones, You and Wu2011a
,Reference Crawford, Nathan, Jen, Wang and Wu
b
, Reference Crawford, Nathan, Wang and Wu2012), the characterization of different forces that contribute to the lift generation (Barabadi et al.
Reference Barabadi, Nathan, Jen and Wu2009; Wu et al.
Reference Wu, Santhanam, Nathan and Wang2017a
,Reference Wu, Wang, Zhu and Nathan
b
) as well as the role of the un-deformed surrounding porous media in the total lift (Crawford et al.
Reference Crawford, Nathan, Jen, Wang and Wu2011b
; Wu et al.
Reference Wu, Wang, Zhu and Nathan2017b
). One obtains important insights from the above mentioned studies such that it is feasible to support a very heavy planing surface with very soft porous materials, provided the lateral leakage is eliminated and the time of the passage of the planing surface is small compared to the time that it would take the trapped fluid to drain from the confined porous media beneath it.
Review of the literature indicates that, despite significant progress having been made to understand the lift generation inside a soft porous media, many of the experimental studies on this topic have mainly focused on the rapid compaction of soft porous media in the vertical direction (Wu et al. Reference Wu, Andreopoulos, Xanthos and Weinbaum2005b ; Al-Chidiac et al. Reference Al-Chidiac, Mirbod, Andreopoulos and Weinbaum2009; Barabadi et al. Reference Barabadi, Nathan, Jen and Wu2009; Crawford et al. Reference Crawford, Jones, You and Wu2011a ,Reference Crawford, Nathan, Jen, Wang and Wu b , Reference Crawford, Nathan, Wang and Wu2012; Wu et al. Reference Wu, Santhanam, Nathan and Wang2017a ,Reference Wu, Wang, Zhu and Nathan b ), which is more relevant to the application of soft porous media for squeeze damping. The scenario originally examined by F&W for a planing surface gliding over a soft porous layer, which is more related to the soft porous lubrication, remains purely theoretical (Feng & Weinbaum Reference Feng and Weinbaum2000; Wu et al. Reference Wu, Andreopoulos and Weinbaum2004a ,Reference Wu, Andreopoulos and Weinbaum b , Reference Wu, Andreopoulos and Weinbaum2006b , Reference Wu, Weinbaum and Andreopoulos2005a , Reference Wu, Igci, Andreopoulos and Weinbaum2006a ; Wu & Ganguly Reference Wu and Ganguly2007; Wu & Sun Reference Wu and Sun2008, Reference Wu and Sun2009, Reference Wu and Sun2011; Mirbod et al. Reference Mirbod, Andreopoulos and Weinbaum2009a ,Reference Mirbod, Andreopoulos and Weinbaum b ). In the current paper, we report the first experimental study to examine the latter case. For a planing surface gliding over a soft porous layer, we intend to answer the following questions. (i) What is the general behaviour of the pore pressure distribution? (ii) What are the major parameters that affect the lift generation? (iii) What is the actual percentage of the total lift contributed by pore pressure?
We shall first introduce the design of a fully instrumented soft bearing-sliding surface test bed, which is followed by material characterization of soft porous sheet to be examined using this set-up. The material characterization includes microstructure examination using a scanning electron microscope; permeability examination using a newly developed permeameter (Crawford et al. Reference Crawford, Nathan, Jen, Wang and Wu2011b ) and fibrous stiffness examination using the porous-walled cylinder-piston apparatus (Barabadi et al. Reference Barabadi, Nathan, Jen and Wu2009; Crawford et al. Reference Crawford, Jones, You and Wu2011a ,Reference Crawford, Nathan, Jen, Wang and Wu b , Reference Crawford, Nathan, Wang and Wu2012; Wu et al. Reference Wu, Santhanam, Nathan and Wang2017a ,Reference Wu, Wang, Zhu and Nathan b ). We shall perform an extensive experimental study using the novel soft porous lubrication set-up and provide both representative results and parametric studies. The representative results show the general behaviour of the pore pressure generation as a planing surface glides over a particular porous layer, while the parametric study examines the dependence of the lift generation on the relative velocity between the planing surface and the running belt, the material properties (e.g. porosity, permeability and stiffness) as well as the compression ratios at the leading and trailing edges.
2 Experimental set-up and methods
Figure 1 shows a schematic of the problem to be investigated, where
 $U$
is the velocity of the moving planing surface over a stationary porous layer,
 $h_{0}$
is the thickness of the un-deformed porous layer,
 $h_{1}$
and
 $h_{2}$
are the porous layer thickness below the trailing and leading edges of the planing surface, respectively. The tilt angle of the planing surface, or equivalently the compression ratio of the porous layer from the leading to the trailing edge, is denoted by
 $k=h_{2}/h_{1}$
. The pre-compression ratio of the porous layer underneath the leading edge of the planing surface is given by
 $\unicode[STIX]{x1D706}=h_{2}/h_{0}$
. If the local permeability of the porous layer,
 $K_{p}(x)$
, is determined, where
 $x$
is the distance away from the trailing edge, as shown in figure 1, the expression,
 $\unicode[STIX]{x1D6FC}=h_{2}/(K_{p}(L))^{1/2}$
, indicates the Brinkman parameter. Here
 $K_{p}(L)$
is the Darcy permeability of the porous layer underneath the leading edge of the planing surface.
Problem schematic for a planing surface gliding over a soft porous layer.

The set-up in figure 1 imposes a difficulty in instrumentation on the upper planing surface due to its moving nature. Thus, we choose an identical scenario where the porous layer is moved at velocity
 $U$
in the opposite direction while the planing surface is held fixed. The stationary planing surface allows for easier instrumentation of the sensors. Figure 2(a) shows the schematic of the experimental design. An image of the actual experimental set-up is shown in figure 2(b). As shown in these figures, a fibrous porous layer is attached to a urethane tabletop conveyer belt (Whipple Enterprises urethane U1 style conveyor belt). The conveyer belt measures 73 mm wide by 1.814 m long, and rotates on two rollers, with a diameter of 7.62 cm, at linear velocity
 $U$
. The rollers are driven by a DC electric motor (Inertial Motors Corp. Model D30L) via a pulley and connecting belt. The gearing system produced a
 $1:1$
angular velocity ratio from the motor to the rollers. A tachometer reading was taken from the motor to measure the angular velocity of the motor shaft, which was then used to evaluate the linear tangential velocity,
 $U$
, of the conveyor belt based on the diameter of the rollers. A feedback loop was constructed to keep the velocity of the belt constant during the experiment.
(a) Experimental set-up for a planing surface gliding over a soft porous layer; (b) image of the experimental set-up; (c) the arrangement of the pressure sensors and the load cell on the planing plate.

Porous material, fibrous quilt batting, was manufactured in sheet form and was cut to the same width as the conveyor belt. The length of the porous sheet was cut slightly larger than the overall length of the conveyor belt. The bottom of the porous sheet was then attached to the conveyor belt with adhesive. Two ends of the porous sheet were joined with 3M spray-on adhesive at the interface, with one end overlapping the other. This ensured that the entire conveyor belt was covered by the porous sheet, and that the belt does not separate during the trials. The seam at the interface between the two ends created changes in the structure and thickness of the porous sheet, and its impact on the experimental results will be discussed in detail in later sections. Three different fibrous porous materials, namely materials F, P and W were tested, with an un-deformed thickness of 19 mm.
The upper planing surface is fixed. It was constructed from 0.953 cm thick 6061 aluminium plate, sanded and polished to a mirror finish on the bottom surface to minimize friction. It measured 38.1 cm long and 6.985 cm wide. The tilt angle of the planing surface is precisely adjusted by varying
 $h_{1}$
and
 $h_{2}$
, as shown in figure 1. These heights were individually controlled by a central threaded rod attached at each end of the planing surface. The threaded rod was held fixed by a supporting frame as shown in figure 2(b). The supporting frame was constructed out of aluminium alloy 6061. The threaded rods were constructed out of a steel alloy to prevent galling of the threads on the aluminium frame. The measurements of
 $h_{1}$
and
 $h_{2}$
were taken using a Vernier dial calliper, and measured from the bottom edge of the planing surface to the top of the conveyor belt surface, which is the porous layer thickness. Two nylon side walls were mounted to the frame to allow a surface to seal along the edge of the planing surface, as shown in figure 2(b). This arrangement allows for the elimination of any pressure leakage in the lateral direction, forming a one-dimensional pressure distribution, as described in F&W for the motion of red blood cells in a tightly fitting capillary. A foam sealing between the side walls and the planing surface is also applied to eliminate the pressure leakage though the gap.
Ten pressure transducers (SI Micro, model SM5652-015-G-3-L) were mounted to the planing surface to capture the pore pressure generation as the planing surface glides over the soft porous sheet. Figure 2(c) shows the relative position of the pressures sensors. The pressure transducers,
 $P_{1}$
,
 $P_{2}$
,
 $P_{3}$
,
 $P_{8}$
,
 $P_{9}$
and
 $P_{10}$
, were placed along the centreline of the planing surface with fractional distances 0.033, 0.167, 0.3, 0.63, 0.8 and 0.967 of the total length from the trailing edge. These pressure sensors were used to capture the pressure distribution along the centreline of the planing surface. Four pressure transducers,
 $P_{4}$
,
 $P_{5}$
,
 $P_{6}$
and
 $P_{7}$
, were placed in line with a load cell (Honeywell model MBL) that was mounted along the centreline with a fractional distance of 0.328 away from the trailing edge. These pressure sensors were used to measure the lateral pressure distribution. The largest inner diameter of the pressure transducers is 0.203 cm. This size was used to obtain an adequate spatial resolution in local pressure measurements. All the pressure signals were measured relative to the ambient atmospheric pressure. The configuration of the load cell is designed to measure both the solid phase lifting force from the compression of the porous material, as well as the lifting force from the pore pressure. The ratio between the readings from the pressure transducer to that from the load cell at the same location indicates the percentage of the contribution of the pore pressure to the total lifting force, providing direct verification of the lift generation concept in a soft porous media.
A National Instruments data acquisition system (NI 9205) was used in the experiment. Two Tektronix CPX250 power supplies supplied all the power to the sensors. The 7.5 k samples were read at a rate of 15 kHz for each of the inputs to the data acquisition. LabView was used to collect and process all signals. A low pass 20 Hz threshold, third-order Butterworth filter was applied to the input signals to eliminate random electrical noise, typically found at 60 Hz. A tachometer was used to measure the linear speed of the belt. This tachometer was driven by the encoder on the motor, and converted to a linear speed by
 $U=\unicode[STIX]{x1D714}r$
, where
 $r$
is the radius of the roller, 3.81 cm, and
 $\unicode[STIX]{x1D714}$
is the angular velocity of the roller.
Scanning electron microscope (SEM) images of (a) material F at
 $200\times$
, (b) material P at
 $500\times$
, (c) material W at
 $400\times$
.

3 Material characterization
The series of studies by Wu et al. (Reference Wu, Andreopoulos, Xanthos and Weinbaum2005b ), Barabadi et al. (Reference Barabadi, Nathan, Jen and Wu2009), Crawford et al. (Reference Crawford, Jones, You and Wu2011a ,Reference Crawford, Nathan, Jen, Wang and Wu b , Reference Crawford, Nathan, Wang and Wu2012), have shown that the lift generation in a soft porous media strongly depends on the fibre dimensions of the porous media, the porosity/permeability, the stiffness of the solid phase as well as the porous layer thickness. In the current study, two 100 % polyester, cushion filling porous sheets, namely material F and material P, and a 100 % wool fibrous sheet noted as material W were used. These materials were selected because they are in the form of a porous sheet and can be easily attached to the running belt of the porous bearing test bed.
3.1 Microstructure characterization
The microstructures of the polyester and wool fibrous materials were examined using a Hitachi s-4800 high resolution scanning electron microscope (SEM). Because of the materials fibre elasticity and curved nature, conductive carbon double stick tape was used to securely attach the fibre sample, 20 mm in diameter and 5 mm high, to the SEM specimen holder. Silver paint was then used to ensure adherence of the fibres to the tape, as well as to provide better electrical conductivity and reduce charging effects. The fibre diameters and surface features of the material are shown in figure 3. The fibres are smooth with relatively constant diameter, with material F and material W having approximately similar diameters of
 $30~\unicode[STIX]{x03BC}\text{m}$
, while material P has a smaller diameter of 19 m. The extrusion process for these fibres provided good reproducibility. Because it is difficult to identify the beginning and end of fibres, the actual length of the fibres cannot be determined. There are large gaps between fibres ranging from 0.01 mm to as large as 1 mm.
3.2 Porosity and permeability
The porosity of the material was quantified using
 $$\begin{eqnarray}\unicode[STIX]{x1D719}=\frac{V_{pore}}{V_{total}}=1-\frac{\unicode[STIX]{x1D70C}}{\unicode[STIX]{x1D70C}_{solid}},\end{eqnarray}$$
where
 $\unicode[STIX]{x1D70C}$
and
 $\unicode[STIX]{x1D70C}_{solid}$
are the densities of a porous material and its solid phase, respectively. The solid phase density was determined by the water volume displacement method introduced by Crawford et al. (Reference Crawford, Jones, You and Wu2011a
,Reference Crawford, Nathan, Jen, Wang and Wu
b
, Reference Crawford, Nathan, Wang and Wu2012). A given volume of water was first added to a graduated cylinder. A sample of fibrous material was weighed out to 0.0001 g accuracy and saturated in the water. The samples were then centrifuged (Fisher Scientific accuSpin, Model 400 Benchtop Centrifuge) to eliminate air bubbles. The volume of the materials solid phase was indicated by the change in volume of the water in the graduated cylinder and used to calculate
 $\unicode[STIX]{x1D70C}_{solid}$
. For materials F, P and W,
 $\unicode[STIX]{x1D70C}_{solid}$
were measured to be
 $1.266~\text{g}~\text{cc}^{-1}$
,
 $1.165~\text{g}~\text{cc}^{-1}$
and
 $1.101~\text{g}~\text{cc}^{-1}$
, respectively, consistent with the values reported in Lynch (Reference Lynch1974). With the solid phase density,
 $\unicode[STIX]{x1D70C}_{solid}$
, determined, the porosity of the porous layer can be calculated if its density,
 $\unicode[STIX]{x1D70C}$
, is known.
 $\unicode[STIX]{x1D70C}$
can easily be obtained by measuring the mass and the volume of the porous layer. The un-deformed porosities of materials F, P and W are 0.993, 0.995 and 0.994 respectively. Table 1 summarizes the material type, fibre diameter, solid phase density and porosity of these three materials.
Material properties for materials P, W and F.

The basic physics behind the phenomenon of lift generation in a soft porous media lies in the fact that the compression of the porous media leads to a sharp decrease in its Darcy permeability, and thus a significant increase in the resistance that the fluid encounters as it flows through. Therefore, it is essential to understand how the Darcy permeability changes as a function of compression. A special permeability measuring apparatus developed by Crawford et al. (Reference Crawford, Nathan, Jen, Wang and Wu2011b
), was applied in the current study to measure the change of the Darcy permeability of the three materials as a function of its compression or equivalently, the variation of its porosity,
 $\unicode[STIX]{x1D719}$
. The results are shown in figure 4. It is evident from this figure that, material P has the lowest overall permeability, due to its smaller fibre diameter compared to materials F and W. Also, materials F and W show very similar trends, with the values of permeability overlapping each other. In general, in the higher porosity regions (
 $\unicode[STIX]{x1D719}=0.97-0.99$
) smaller changes in porosity lead to a sharper change in the permeability. While in the lower porosity regions (
 $\unicode[STIX]{x1D719}<0.93$
), small changes in permeability are observed with large changes in porosity. To best describe this nonlinear behaviour, we curve fitted the data with the Nogai relationship (Nogai & Ihara Reference Nogai and Ihara1978),
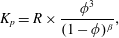 $$\begin{eqnarray}K_{p}=R\times \frac{\unicode[STIX]{x1D719}^{3}}{(1-\unicode[STIX]{x1D719})^{\unicode[STIX]{x1D6FD}}},\end{eqnarray}$$
where
 $R$
and
 $\unicode[STIX]{x1D6FD}$
were solved for using a least squares optimization of the experimental data. For material W,
 $R=2.11\times 10^{-11}$
m
 $^{2}$
,
 $\unicode[STIX]{x1D6FD}=1.593$
; for material P,
 $R=1.32\times 10^{-11}$
m
 $^{2}$
,
 $\unicode[STIX]{x1D6FD}=1.545$
; for material F,
 $R=5.23\times 10^{-11}$
m
 $^{2}$
,
 $\unicode[STIX]{x1D6FD}=1.356$
.
The Darcy permeability as a function of porosity for materials F, P and W. The experimental data are fitted with the Nogai relationship, equation (3.2), where for material W,
 $R=2.11\times 10^{-11}~\text{m}^{2}$
,
 $\unicode[STIX]{x1D6FD}=1.593$
; for material P,
 $R=1.32\times 10^{-11}~\text{m}^{2}$
,
 $\unicode[STIX]{x1D6FD}=1.545$
; for material F,
 $R=5.23\times 10^{-11}~\text{m}^{2}$
,
 $\unicode[STIX]{x1D6FD}=1.356$
.

3.3 Mechanical properties
The lift generation inside a deformable porous media strongly depends on the compliance of the solid phase (Barabadi et al.
Reference Barabadi, Nathan, Jen and Wu2009; Crawford et al.
Reference Crawford, Jones, You and Wu2011a
,Reference Crawford, Nathan, Jen, Wang and Wu
b
, Reference Crawford, Nathan, Wang and Wu2012). In the current study, a static compression experiment was performed to determine the mechanical properties of the fibrous materials using a porous-walled cylinder-piston apparatus from Crawford et al. (Reference Crawford, Jones, You and Wu2011a
). The porous-walled design of the apparatus allows for a drained compression experiment with soft porous media. The cylinder was first filled with the porous material at a particular porosity. Weights were slowly and incrementally placed on the piston until maximum compression was reached. Subsequently, the piston was unloaded in a similar manner. For each step of loading, the experiment was not continued until the piston reached equilibrium. Since the loads were added gradually to the piston, the air in the pores of the porous media had sufficient time to escape without elevating pore pressure, ensuring that the static loads were completely supported by the solid phase of the porous media. The applied load and the resulting compression of the porous material were recorded and are plotted in figure 5. It shows that permanent deformation occurred when the mass was unloaded. This is due to the inelastic nature of the material and the friction of the porous side walls resisting the fibres return to the original height. The stiffness of the material is defined as the applied load divided by the compression of the porous material. It is clearly shown in figure 5 that material F was the stiffest material, deforming the least at the maximum load (7.4 cm at 18.4 kg). Materials P and W demonstrated similar behaviour with material P showing slightly larger deformation at maximum load (8.3 cm at 18.4 kg compared to 8.2 cm at 18.4 kg). Material W showed the largest hysteresis, only regaining 0.4 cm when returned to the lowest load, compared to approximately 0.7 cm for both materials P and F. Since materials P and F are both polyester fibrous materials extruded at the same temperature, the fibre diameter plays the major role in determining the stiffness of the solid phase of the fibrous material. The fibre diameter of material F
 $(30~\unicode[STIX]{x03BC}\text{m})$
is larger than that of material P
 $(19~\unicode[STIX]{x03BC}\text{m})$
, making it stiffer than material P.
Characterization of the fibre stiffness via a quasi-static compression experiment with materials F, P and W at initial porosity of 0.98.

4 Results and discussion
The experimental set-up shown in figure 2 was employed to examine the lift generation inside a soft porous layer as a planing surface glides over it with a tilt angle. Both representative results showing the general behaviour of the pore pressure distribution and comprehensive parametric study are presented.
4.1 Representative results
The microstructure study revealed that material P has the smallest fibre diameter among the three materials studied, figure 3 and table 1. This smaller fibre diameter leads to a lower permeability as shown in figure 4. Since the inverse of the permeability indicates the resistance that the fluid encounters as it passes through a porous media, a porous material with a lower permeability is capable of trapping more fluid inside. Additionally, material P is a softer material as indicated by figure 5. Because the idea of soft lubrication is to trap as much fluid as possible inside the porous media, increasing the lift contribution of the pore fluid pressure and thus reducing the frictional force, the best candidate for this type of application is a material with lower permeability and lower solid phase stiffness. Clearly, material P is the best candidate in our study. Representative results will be focused on this material.
The velocity of the running belt is chosen to be
 $3.88~\text{m}~\text{s}^{-1}$
. The undeformed porous layer thickness,
 $h_{0}$
, is 19 mm, and the thickness of the porous layer at the leading and trailing edge are
 $h_{2}=19~\text{mm}$
and
 $h_{1}=3.8~\text{mm}$
respectively, making
 $\unicode[STIX]{x1D706}=h_{2}/h_{0}=1$
and
 $k=h_{2}/h_{1}=5$
, figure 1. Using the permeability data obtained from figure 4, one finds that the Brinkman parameter,
 $\unicode[STIX]{x1D6FC}=h_{2}/(K_{p}(L))^{1/2}=98$
. Significantly this value of
 $\unicode[STIX]{x1D6FC}$
is exactly the same as that observed in the EGL (F&W), therefore hydrodynamic similarity is expected between the motion of the red cell in the EGL, and the experimental study presented herein.
Representative time-dependent pressure data taken from the pressure sensors along the centreline of the planing surface are shown in figure 6. Pressure was immediately generated as the belt begins to move because the porous layer was continuously compressed by the upper planing surface. The data are noticeably cyclical, and not particularly smooth. This is due to (i) slight non-uniformity of the porous sheet, (ii) the seam connecting the two ends of the porous sheet. As the two ends were glued together as one attached the porous sheet to the conveyer belt, the microstructure of the material was changed and the local permeability was decreased. The largest peaks in the data (
 $t=0.4$
, 1, 1.5 s) were found to be a result of the seam, as it passed underneath the planing surface cyclically. Therefore, the data taken between the peaks are of most interest. From figure 6, it is evident that over 600 Pa of pore air gauge pressure was generated underneath the planing surface at the location near its trailing edge where pressure sensors 2 and 3 were located. The pressure relaxed toward the leading edge (
 $P_{8}$
,
 $P_{9}$
and
 $P_{10}$
) and the trailing edge (
 $P_{1}$
).
Representative data obtained from the pressure sensors mounted along the axial direction of the planing surface,
 $P_{1}$
,
 $P_{2}$
,
 $P_{3}$
,
 $P_{8}$
,
 $P_{9}$
and
 $P_{10}$
. The experiment was run with material P at
 $\unicode[STIX]{x1D6FC}=98$
,
 $k=5.0$
,
 $\unicode[STIX]{x1D706}=1$
and
 $U=3.88~\text{m}~\text{s}^{-1}$
.

A better demonstration of this axial distribution is shown in figure 7. The data points were generated by time averaging between two pressure peaks in figure 6, and then curve fitted with a sixth-order polynomial for display purposes. Since both the leading edge,
 $x/L=1$
, and the trailing edge
 $x/L=0$
(figure 1), were exposed to the atmosphere, the pressure values at these two positions were set to zero gauge pressure. The highest pressure is registered at
 $x/L=0.2$
, between pressure sensors 2 and 3. It relaxed gradually towards the leading edge and sharply decreased toward the trailing edge, where zero gauge pressure was achieved. Because the largest compression of the material occurs near the trailing edge, the local Darcy permeability decreased significantly and the fluid encounters more resistance as it escapes from the porous media. Thus higher pressure is generated towards to the trailing edge. This behaviour is consistent with theoretical predictions by F&W, Wu et al. (Reference Wu, Igci, Andreopoulos and Weinbaum2006a
,Reference Wu, Andreopoulos and Weinbaum
b
) and Wu & Sun (Reference Wu and Sun2011). Significantly, it is the first experimental demonstration of the pressure distribution inside a soft porous media as a planing surface glides over it.
The curve fitted pore pressure distribution along the axial direction of the planing surface for material P. The experiment was run with
 $\unicode[STIX]{x1D6FC}=98$
,
 $k=5.0$
,
 $\unicode[STIX]{x1D706}=1$
and
 $U=3.88~\text{m}~\text{s}^{-1}$
.

The time-dependent lateral pressure distribution is shown in figure 8, obtained from the readings of pressure sensors
 $P_{4}$
,
 $P_{5}$
,
 $P_{6}$
and
 $P_{7}$
. These four sensors are situated at the same distance from the trailing edge but at different lateral positions, figure 2(c). It is clearly shown in figure 8 that the pressure readings from these four sensors are nearly identical, confirming there is no lateral pressure relaxation due to the existence of side walls that eliminate air leakage. Therefore, the pressure distribution underneath the planing surface is one-dimensional. This situation is similar to the one observed in the motion of red blood cell in a tightly fitting capillary, where lateral pressure relaxation is limited. This condition is not present in the case of a human skiing or snowboarding, where lateral pressure relaxation is a dominant factor.
Representative data obtained from the readings of pressure sensors
 $P_{4}$
,
 $P_{5}$
,
 $P_{6}$
and
 $P_{7}$
, which are situated at the same distance from the trailing edge but at different lateral positions. The experiment was run with material P at
 $\unicode[STIX]{x1D6FC}=98$
,
 $k=5.0$
,
 $\unicode[STIX]{x1D706}=1$
and
 $U=3.88~\text{m}~\text{s}^{-1}$
.

The pressure reading from pressure sensor
 $P_{3}$
, along with the local total pressure reading from the load cell. The experiment was run with material P at
 $\unicode[STIX]{x1D6FC}=98$
,
 $k=5.0$
,
 $\unicode[STIX]{x1D706}=1$
and
 $U=3.88~\text{m}~\text{s}^{-1}$
.

In figure 9, the pressure reading from pressure sensor 3, along with the local total pressure reading from the load cell, is presented. Similar to the data presented in figure 6, the spikes in the total pressure data are due to the existence of the seam connecting the two ends of the porous sheet as one attached it to the conveyer belt. Thus we focus our analysis on the signals between these spikes. As previously discussed, the percentage of lift generation contributed by the pore air pressure is of particular interest. If we define
 $f_{air}=P_{air}/P_{total}$
, where
 $P_{air}$
is the local air pressure and
 $P_{total}$
is the local measurement of the total lifting pressure obtained by dividing the load cell reading by its sensing area. It is clearly shown that at
 $x/L=0.3$
, where pressure sensor
 $P_{3}$
and the load cell are located, approximately 68 % of the total lifting force comes from the pore pressure. This finding is extremely important for the application using highly compressible porous media for soft lubrication. Since the sliding frictional force is proportional to the solid phase lifting force, reduction in the solid phase lifting force leads to the reduction in the friction.
Parametric study in non-dimensional format for the lift generation inside a soft porous layer as a planing surface glides over it: (a) for various porous layer compression ratios,
 $k=3.0$
,
 $4.0$
,
 $5.0$
, while keeping the rest of the parameters constant (
 $\unicode[STIX]{x1D706}=1$
,
 $u^{\prime }=1$
and material P (
 $\text{stiff}=0.88$
)); (b) for various pre-compression ratios at the leading edge,
 $\unicode[STIX]{x1D706}=0.84$
(
 $\unicode[STIX]{x1D6FC}(h_{2})=94$
) and
 $\unicode[STIX]{x1D706}=1$
(
 $\unicode[STIX]{x1D6FC}(h_{2})=98$
), while keeping the rest of the parameters constant (
 $k=4$
,
 $u^{\prime }=1$
and material P (
 $\text{stiff}=0.88$
)); (c) for various speeds,
 $u^{\prime }=1$
,
 $0.675$
and
 $0.528$
, while keeping the rest of the parameters constant (
 $k=5$
,
 $\unicode[STIX]{x1D706}=1$
and material P (
 $\text{stiff}=0.88$
)); (d) for different materials, materials P (
 $\text{stiff}=0.88$
), F (
 $\text{stiff}=1$
) and W (
 $\text{stiff}=0.85$
), while keeping the compression ratio constant (
 $k=5$
,
 $\unicode[STIX]{x1D706}=1$
,
 $u^{\prime }=1$
).

4.2 Parametric study
A parametric study was performed to examine different aspects that affect lift generation underneath the planing surface. These parameters include the compression ratio from the leading to trailing edge,
 $k$
, the relative velocity between the planing surface and the porous layer,
 $U$
, the pre-compression at the leading edge,
 $\unicode[STIX]{x1D706}$
, and material properties e.g. stiffness and permeability. The parametric study was performed by varying one parameter, while keeping all others constant. The results of the parametric study are presented and analysed in dimensionless format in figure 10, where the dimensionless pressure,
 $h_{2}^{2}P/(\unicode[STIX]{x1D707}U_{c}L)$
, where
 $\unicode[STIX]{x1D707}$
is the dynamic viscosity of the fluid, as a function of dimensionless axial location,
 $x/L$
, is presented for different values of dimensionless parameters,
 $k=h_{2}/h_{1}$
(figure 10
a),
 $\unicode[STIX]{x1D706}=h_{2}/h_{0}$
or equivalently
 $\unicode[STIX]{x1D6FC}=h_{2}/K_{p}^{0.5}$
(figure 10
b),
 $u^{\prime }=U/U_{c}$
where the characteristic velocity is chosen to be the highest velocity of the conveyer belt,
 $3.88~\text{m}~\text{s}^{-1}$
(figure 10
c), and relative material stiffness (figure 10
d). Three different materials, P, W and F, were tested in the current study. From figure 5, one notices that at a certain load, material F has the least deformation, meaning it is the least compliant. If one defines the relative stiffness, stiff, to be the ratio of the material deformation at 10 kg of loading to that of material F at the same load in figure 5, then
 $\text{stiff}=1$
, 0.85 and 0.88 for materials F, W and P, respectively.
 $k$
dependence: figure 10(a) shows the axial pressure distribution for three different compression ratios (
 $k=3,4,5$
) for material P (
 $\text{stiff}=0.88$
), at
 $u^{\prime }=1$
and
 $\unicode[STIX]{x1D706}=1$
(
 $\unicode[STIX]{x1D6FC}=98$
). It is clearly seen that the larger compression ratios generate larger pore air pressures, with approximately twice as much pressure generated at
 $k=5$
compared to
 $k=3$
. This increase in pressure generation for the larger compression ratios is a result of the dramatic decrease in porosity at the trailing edge, which decreases the permeability tremendously and increases the resistance of the fluid as it escapes the porous layer. The centre of pressure moves toward the trailing edge as the compression ratio is increased. This is because higher pressure is generated at the trailing edge for the higher compression ratios,
 $k$
. The results are consistent with theoretical predictions by F&W (Wu & Sun Reference Wu and Sun2011). Interestingly, the value of
 $f_{air}$
remains fairly constant between the three trials, only deviating a total of 6 %. This is because as
 $k$
increases, both the pore air pressure and solid phase lifting force increases, and their relative contribution to the total lift remains the same.
 $\unicode[STIX]{x1D706}$
(
 $\unicode[STIX]{x1D6FC}$
) dependence: figure 10(b) shows the axial pore pressure distribution for two different values of pre-compression at the leading edge
 $\unicode[STIX]{x1D706}=1$
and 0.84, for material P (
 $\text{stiff}=0.88$
), with compression ratio
 $k=4$
and
 $u^{\prime }=1$
. With more pre-compression at the leading edge, the permeability of the porous layer decreases. On the other hand, the thickness of the porous layer at the leading edge,
 $h_{2}$
also decreases. The overall result is that, when
 $\unicode[STIX]{x1D706}$
changes from 1 to 0.84, the Brinkman parameter
 $\unicode[STIX]{x1D6FC}$
decreases from 98 to 94. Lower Brinkman parameter leads to lower dimensionless pore pressure generation, consistent with the theoretical prediction by F&W. However, the dimensional pore pressure, not shown in the figure, is higher for
 $\unicode[STIX]{x1D706}=0.84$
than
 $\unicode[STIX]{x1D706}=1$
. This is because with the same value of
 $k$
, the porosity is decreased for
 $\unicode[STIX]{x1D706}=0.84$
as compared to
 $\unicode[STIX]{x1D706}=1$
, at all
 $x/L$
positions along the planing surface. The reduction in porosity results in a lower permeability and more pore pressure generation. Surprisingly, one notices that, although higher pressure is generated with lower pre-compression ratio,
 $f_{air}$
actually decreases from 68 % for
 $\unicode[STIX]{x1D706}=1$
to 61 % for
 $\unicode[STIX]{x1D706}=0.84$
. This is because the increase in the solid phase lifting force is more than the increase in pore pressure. The
 $x$
location of the maximum pressure does not change between the trials.
 $U$
dependence: the axial pore pressure distributions for three different velocities
 $u^{\prime }=1.000$
, 0.675 and 0.528, for material P (
 $\text{stiff}=0.88$
), with
 $k=5$
and
 $\unicode[STIX]{x1D706}=1$
(
 $\unicode[STIX]{x1D6FC}=98$
) are shown in figure 10(c). As
 $u^{\prime }$
increases, the fluid that is transiently trapped inside the pores has less time to escape, and thus more pore pressure is generated. Figure 10(c) shows a strong dependence of
 $f_{air}$
on velocity. The faster speeds produce larger pore pressure, but do not produce a significantly larger solid phase lifting force, thus
 $f_{air}$
increases as
 $u^{\prime }$
increases. This implies that the solid phase lifting force is largely dependent on its elastic component which purely depends on the static compression, rather than its viscous components which depends on the compression rate. The location of the maximum pressure is not affected by the velocity.
Material dependence: the axial pore pressure distribution for three different materials F (
 $\text{stiff}=1$
), P (
 $\text{stiff}=0.88$
) and W (
 $\text{stiff}=0.85$
), with
 $k=5$
,
 $u^{\prime }=1$
and
 $\unicode[STIX]{x1D706}=1$
are shown in figure 10(d). In the same experimental settings, different materials having different permeability make the Brinkman parameter (
 $\unicode[STIX]{x1D6FC}$
) at the leading edge (
 $h_{2}$
) different, which is
 $\unicode[STIX]{x1D6FC}(h_{2})=98$
for material P;
 $\unicode[STIX]{x1D6FC}(h_{2})=89$
for material F;
 $\unicode[STIX]{x1D6FC}(h_{2})=71$
for material W.
Recalling the observations from the material characterizations, table 1, material F and material P are both comprised of polyester fibres but have significantly different fibre diameters,
 $d$
:
 $d=19~\unicode[STIX]{x03BC}\text{m}$
for material P, while
 $d=32~\unicode[STIX]{x03BC}\text{m}$
for material F. Material W is made from wool fibres, having approximately the same fibre diameter,
 $d=30~\unicode[STIX]{x03BC}\text{m}$
, as material F, table 1 and figure 3. Materials F and W demonstrated very similar permeability due to the similar fibre dimensions, while material P had a significantly lower permeability, figure 4. Material F was the stiffest among the three materials, while materials P and W showed very similar behaviour in the static compression experiment, figure 5.
In figure 10(d), comparisons are first made between material P and material W, which have very similar solid phase elastic behaviour, figure 5, with material P being less permeable, figure 4. Material P generates much higher pore pressures due to its lower permeability. The contribution of the pore pressure to the total lift,
 $f_{air}$
, for material P is also higher than that of material W. This is because their solid phase lifting forces are expected to be quite close to each other, due to the similarities in the static experiment, figure 5.
Next, comparisons are made between materials F and W, which have similar permeability behaviour, figure 4, but vastly different solid phase stiffness, figure 5, with material F being stiffer. Because the initial permeability is lower for material F,
 $\unicode[STIX]{x1D6FC}(h_{2})$
at the leading edge is higher for material F than material W. As one expected, higher
 $\unicode[STIX]{x1D6FC}(h_{2})$
leads to higher dimensionless pore pressure generation. On the other hand, material W is the softest among the three materials,
 $\text{stiff}=0.85$
. Figure 10(d) shows that, although material W generated less pressure,
 $f_{air}$
is higher for this material due to its much softer solid phase.
Finally, comparisons are made between the two polyester fibrous materials, P and F, with material P being much softer,
 $\text{stiff}=0.88$
, and less permeable. Much higher pressure is generated with material P due to its lower permeability.
 $f_{air}$
is also higher for this material, because of the higher pore pressure generation and lower solid phase lifting force.
These comparisons demonstrate that a material with low permeability and soft solid phase performs the best as a soft porous bearing. These results are also identical with the theoretical predictions in F&W, which discussed that the higher
 $\unicode[STIX]{x1D6FC}(h_{2})$
at the leading edge would cause higher pore pressure generation. The success in implementing the soft lubrication concept will strongly rely on the ability to select appropriate materials.
4.3 Repeatability study
For the same running conditions, each experiment was repeated 3 times. To demonstrate the repeatability of the experimental results, the axial pressure distribution for the three trials are plotted and compared with each other. Representative results for material P are shown in figure 11, where the running parameters are chosen as
 $k=5$
,
 $\unicode[STIX]{x1D6FC}=98$
,
 $U=3.88~\text{m}~\text{s}^{-1}$
and
 $\unicode[STIX]{x1D706}=1$
. High repeatability is observed. As shown in figure 11(a), the three trials overlap with each other, making it difficult to distinguish between then. Figure 11(b) shows a blow-up the local region near
 $x/L=0.25$
, which include the actual data obtained at
 $x/L=0.17$
and 0.3, respectively, and the section of the fitted curves through all the data points from the leading to trailing edge. The variation in the data points is only 5 Pa, which is close to the experimental error of the pressure sensors due to their calibration.
Repeatability study showing the axial pore pressure distribution in three different runs: (a) the overall axial pressure distribution from the leading to the trailing edge; (b) the enlarged view near
 $x/L=0.25$
, which includes the data obtained at
 $x/L=0.17$
and 0.3, respectively. The experiment was run with material P at
 $\unicode[STIX]{x1D6FC}=98$
,
 $k=5.0$
,
 $\unicode[STIX]{x1D706}=1$
and
 $U=3.88~\text{m}~\text{s}^{-1}$
.

4.4 Comparison between experimental results and theoretical predictions
For a planing surface gliding over a soft porous media, F&W have theoretically predicted the pore pressure distribution based on a generalized Reynolds equation, which, in the large
 $\unicode[STIX]{x1D6FC}$
limit and without lateral pressure leakage, reduces to
 $$\begin{eqnarray}\frac{\text{d}}{\text{d}x}\left(-\frac{1}{\unicode[STIX]{x1D6FC}^{2}}\frac{\text{d}p}{\text{d}x}h\right)=\frac{\text{d}h}{\text{d}x},\end{eqnarray}$$
where
 $p=P/(\unicode[STIX]{x1D707}LU/h_{2}^{2})$
(Feng & Weinbaum Reference Feng and Weinbaum2000; Wu et al.
Reference Wu, Andreopoulos and Weinbaum2004a
). For the representative running conditions as shown in figure 6 where
 $U=3.88~\text{m}~\text{s}^{-1}$
;
 $h_{0}=19~\text{mm}$
;
 $h_{2}=19~\text{mm}$
;
 $h_{1}=3.8~\text{mm}$
(
 $\unicode[STIX]{x1D706}=h_{2}/h_{0}=1;k=h_{2}/h_{1}=5$
);
 $\unicode[STIX]{x1D6FC}=h_{2}/(K_{p}(L))^{0.5}=98$
, the solution of equation (4.1) is compared to the experimental data, as shown in figure 12. Excellent agreement is observed between the experimental result and the theoretical prediction. It conclusively demonstrates the validity of the F&W theory for the pore pressure distribution underneath a planing surface as it glides over a soft porous media. Comparisons were made for other running conditions, all giving consistent results.
The comparison between the theoretical result and experimental result. The initial conditions for the experiment and theoretical model are
 $\unicode[STIX]{x1D6FC}(h_{2})=98$
,
 $k=5.0$
,
 $\unicode[STIX]{x1D706}=1$
and
 $U=3.88~\text{m}~\text{s}^{-1}$
.

The pore pressure generation without a porous material under the same running conditions with representative results (
 $k=5.0$
,
 $h_{2}=19.05~\text{mm}$
and
 $U=3.88~\text{m}~\text{s}^{-1}$
): (a) the measured raw data of pressure generation in gliding motion of planing plate over a bare belt; (b) the theoretical pressure distribution along the axial direction of the planing plate in gliding motion over a non-porous belt.

4.5 No porous layer attached to the conveyer belt
Before covering the conveyer belt with a soft porous layer, we always ran the test with the bare belt. The pressure readings were very low. For example, for the same running condition as figure 6 where
 $k=5.0$
,
 $h_{2}=19$
mm and
 $U=3.88~\text{m}~\text{s}^{-1}$
, figure 13(a) shows the pressure reading from the ten pressure transducers mounted on the planing surface. Even for the maximum pressure,
 $P_{2}$
, it ranges between 5 Pa and 20 Pa, and the time-averaged pressure is approximately 12 Pa which is significantly lower as compared to the case when the belt is covered with soft porous layer where the
 $P_{2}$
is approximately 630 Pa.
For the same running conditions, if we use classical lubrication theory, the general behaviour is described in figure 13(b). The maximum pressure is 0.4 Pa, although the trend for the pressure distribution agrees well with the experimental data, the theoretically predicted pressure value is much lower as compared to the experimental measurement. This is because the running conditions were not under the lubrication limit for the pure air gap. To satisfy the lubrication approximation limit for a pure fluid, one needs
 $L_{y}/L_{x}\ll 1$
as well as
 $(L_{y}/L_{x})\mathit{Re}_{L_{y}}\ll 1$
(Deen Reference Deen1998), where
 $L_{y}$
,
 $L_{x}$
are the characteristic length scale in the gap height direction and the dominant fluid flow direction, respectively, and
 $\mathit{Re}_{L_{y}}$
is the Reynolds number based on
 $L_{y}$
. In the current application where
 $L_{y}=h_{2}=19~\text{mm}$
,
 $L_{x}=L=381~\text{mm}$
,
 $U=3.88~\text{m}~\text{s}^{-1}$
,
 $\unicode[STIX]{x1D70C}_{a}=1.293~\text{kg}~\text{m}^{-3}$
and
 $\unicode[STIX]{x1D707}=1.82\times 10^{-5}~\text{Pa}~\text{s}$
,
 $L_{y}/L_{x}=1/20=0.05$
,
 $\mathit{Re}_{L_{y}}L_{y}/L_{x}=262.56\gg 1$
. Thus, the experiment is not under the classical lubrication limit. In order to satisfy the pure fluid lubrication limit, for the same
 $U$
and
 $L_{x}$
, it is required that
 $L_{y}<\sqrt{\unicode[STIX]{x1D707}L_{x}/\unicode[STIX]{x1D70C}U}<1.17~\text{mm}$
.
 $L_{y}$
is too small for the current experimental design to achieve.
On the other hand, the requirement for the porous lubrication was given by Feng & Weinbaum (Reference Feng and Weinbaum2000),
 $L_{y}/L_{x}<1$
as well as
 $U<\unicode[STIX]{x1D707}\unicode[STIX]{x1D6FC}^{2}L_{x}/(\unicode[STIX]{x1D70C}L_{y}^{2})$
. In the current application,
 $\unicode[STIX]{x1D6FC}=100$
,
 $\unicode[STIX]{x1D707}\unicode[STIX]{x1D6FC}^{2}L_{x}/(\unicode[STIX]{x1D70C}L_{y}^{2})=147.8~\text{m}~\text{s}^{-1}$
,
 $U=3.88~\text{m}~\text{s}^{-1}$
, thus
 $U/(\unicode[STIX]{x1D707}\unicode[STIX]{x1D6FC}^{2}L_{x}/(\unicode[STIX]{x1D70C}L_{y}^{2}))=0.026\ll 1$
, and the porous lubrication limit is achieved.
5 Conclusion
In this paper, we developed a novel experimental approach to examine the lift generation inside a highly compressible porous media when a planing surface glides over it. It is the first investigation of its type, providing a conclusive experimental verification of the lift generation concept proposed by the series of studies of F&W, (Wu et al. Reference Wu, Igci, Andreopoulos and Weinbaum2006a ,Reference Wu, Andreopoulos and Weinbaum b ; Wu & Sun Reference Wu and Sun2011). Several important observations were made, including the following.
(1) For a planing surface gliding over a soft porous structure at a reasonable velocity, significant pore pressure can be generated, contributing up to a majority of the total lifting force.
(2) The lift generation is a function of the relative velocity between the planing surface and porous layers, the compression ratio of the porous layer from the leading to trailing edge, the pre-compression at the leading edge and the material properties. (i) Higher relative velocity leads to higher pore pressure generation and larger
 $f_{air}$
. (ii) With higher compression ratios, more pore pressure is generated, however
 $f_{air}$
does not change significantly. The location of the maximum pressure is mainly determined by the angle of attack, or equivalently, the value of
 $k$
. (iii) Higher pre-compression at the leading edge leads to the increase in both pore pressure generation and solid phase lifting force. (iv) A material with lower permeability and softer solid phase will lead to higher pore pressure generation, and larger
 $f_{air}$
, both beneficial for the application of a soft porous bearing.
(3) The pore pressure generation predicted by the lubrication theory for a highly compressible porous media developed by F&W was conclusively verified.
There were several limitations in the study. First, because the porous material had to be attached to the moving conveyer, only those that were thermally bonded and in sheet format could be considered, which limited the selection of materials. Secondly, the design of the experimental set-up provided fixed compression ratios at the leading and trailing edge, with varying loads acting on the planing surface for a given running condition. However in the real bearing applications, the applied load remains constant, while the compressions of the porous layer vary dynamically. A further modification of the experimental set-up that allows for a fixed loading condition could be an additional improvement. For this case, the analysis of the stability and control of the planing surface would be very interesting. Thirdly, in the current experimental set-up, the total lifting force was only measured at one axial location. The distribution of the total lifting force along the entire planing surface remains unknown. This piece of information is especially important to evaluate the overall pore pressure contribution to the total lift. Finally, this paper only focused on the local lift generation, while for the application of highly compressible porous media for soft lubrication, the frictional force needs to be characterized. The third and last limitation mentioned above have been successfully treated in a later study of our group.
Despite these limitations, this paper provided the very first experimental study of lift generation inside a highly compressible porous layer when a planing surface glides over it. It provides critical insight into the biophysics study of the EGL and other soft porous structures that are found in biological systems, e.g. cartilage and eyelids (McCutchen Reference McCutchen1959, Reference McCutchen1962; Mow, Holmes & Lai Reference Mow, Holmes and Lai1984; Ateshian & Wang Reference Ateshian and Wang1995; Ateshian, Wang & Lai Reference Ateshian, Wang and Lai1998; Soltz & Ateshian Reference Soltz and Ateshian1998; Bujurke & Kudenatti Reference Bujurke and Kudenatti2006; Caligaris & Ateshian Reference Caligaris and Ateshian2008; Jones et al. Reference Jones, Fulford, Please, McElwain and Collins2008; Greene et al. Reference Greene, Olszewska, Osterberg, Zhu and Horn2014). The study lays the foundation for employing highly compressible porous media for lubrication with significantly higher pressure and longer life, which has broad impact on energy conservation and the reduction of greenhouse gas emissions.
Acknowledgements
This research was supported by the National Science Foundation under Award no. 1511096. The testing materials were obtained from QUILTERS DREAM®. The authors would like to acknowledge Dr K.-P. Jen for providing important help in SEM analysis of the testing materials. The technical supports from Mr C. Townend, Mr Z. Nowasad and Mr R. Maddalo are greatly appreciated.



