Introduction
The family Paramphistomidae Fischoeder, 1901, is composed of over 70 species in 19 genera (Jones, Reference Jones, Jones, Bray and Gibson2005). The members of this family are commonly called amphistomes, and mainly parasitize the rumen and reticulum in ruminants. However, the amphistomes of the genus Explanatum inhabit the bile ducts and intrahepatic ductules, inducing granulomatous infection with fibrosis and thickening of bile ducts (Kulasiri & Seneviratne, Reference Kulasiri and Seneviratne1956; Mazahery et al., Reference Mazahery, Razmyar and Hoghooghi–Rad1994; Haque et al., Reference Haque, Mohan and Ahmad2011). Economic losses caused by the Explanatum infection are manifested through reduced growth rate, decreased milk and meat production, and increased mortality of the affected animals. Explanatum explanatum is distributed in Africa, Asia and the Caribbean, and is a very common parasite of water buffaloes in India (18% (Haque et al., Reference Haque, Mohan and Ahmad2011)) and Bangladesh (51.89% (Alim et al., Reference Alim, Islam and Mondal2005), 31.25% (Ahmedullah et al., Reference Ahmedullah, Akbor, Haider, Hossain, Khan, Hossain and Shanta2007)) of South Asia. Precise identification of E. explanatum requires tedious histological studies, which entail specialized knowledge and techniques (Sey, Reference Sey1991). Unfortunately, most of the previous reports have not included precise identification of E. explanatum. Therefore, unveiling the molecular characters of the flukes by a suitable molecular marker may ensure the precise species identification. The second internal transcribed spacer (ITS2) of ribosomal DNA has proved to be a useful genetic marker for the identification of amphistomes, including E. explanatum (Itagaki et al., Reference Itagaki, Tsumagari, Tsutsumi and Chinone2003; Rinaldi et al., Reference Rinaldi, Perugini, Capuano, Fenizia, Musella, Veneziano and Cringoli2005; Lotfy et al., Reference Lotfy, Brant, Ashmawy, Devkota, Mkoji and Loker2010; Ichikawa et al., Reference Ichikawa, Kondoh, Bawn, Maw, Htun, Thein, Gyi, Sunn, Katakura and Itagaki2013). On the other hand, mitochondrial DNA has been the most popular marker in phylogenetic analysis of parasitic platyhelminths (Bowles et al., Reference Bowles, Hope, Tiu, Liu and McManus1993, Reference Bowles, Blair and McManus1995; Le et al., Reference Le, Blair and McManus2000) for its maternal mode of inheritance and high mutation rates. However, there has been no report on the phylogenetic analysis of E. explanatum from South Asia. More specifically, the mitochondrial NADH dehydrogenase subunit 1 gene (nad1) has been found to be a useful marker for inferring intraspecific variations, biogeography and identification of digenean trematodes (Morgan & Blair, Reference Morgan and Blair1998; Sorensen et al., Reference Sorensen, Drew, Brindley, Bogh, Gasser, Qian, Chiping and McManus1998; Park et al., Reference Park, Im and Yong2003; Lee & Huh, Reference Lee and Huh2004; Semyenova et al., Reference Semyenova, Morozova, Chrisanfova, Gorokhov, Arkhipov, Moskvin, Movsessyan and Ryskov2006). For these reasons, the nad1 gene was used in this study to track the origin and dispersal route of E. explanatum in South Asia. This is the first report on the molecular characterization of E. explanatum flukes from Bangladesh and Nepal, representative of the Asian population, and also the first ever attempt to elucidate the origin and biogeographic distribution of the Asian E. explanatum.
Materials and methods
Specimens
Adult E. explanatum flukes were isolated directly from the bile ducts of 26 buffaloes and 7 cattle in the slaughterhouses of four different agro-ecological areas of Bangladesh (Bogra, Khulna, Rajshahi and Mymensingh) from April to September 2012 (see supplementary table S1). The flukes from Nepal were collected from the bile ducts of 10 buffaloes in the slaughterhouses of Chitwan district, Narayani zone, from December 2011 to February 2012 (see supplementary table S2). The flukes were washed in physiological saline solution and preserved in 70% ethanol for further molecular studies. A total of 86 flukes (2 flukes per host) were used for molecular characterization, both by ITS2 and nad1.
Molecular analyses
Total DNA was extracted from the right side of the acetabulum of each fluke (86 flukes) to avoid the uteri, aiming to exclude the genetic material from other flukes, using the High Pure PCR template preparation kit (Roche, Mannheim, Germany), and stored at –20°C for future use. DNA fragments of ITS2 and the nad1 gene were amplified by polymerase chain reaction (PCR) in a total volume of 25 μl, containing 1.25 U GoTaq polymerase (Promega, Madison, USA), 2 μl template DNA, 0.2 μm each deoxynucleoside triphosphate (dNTP), 0.1 μm of each primer (50 pmol/μl reaction mixture) and the reaction buffer supplied by the manufacturer. For amplification of the ITS2 region (442 bp), including partial 5.8S and 28S ribosomal RNA genes, the forward primer ITS2–F and reverse primer ITS2–R (Itagaki & Tsutsumi, Reference Itagaki and Tsutsumi1998) were used. The thermal reaction cycle consisted of an initial denaturation at 94°C for 5 min; followed by 40 cycles at 94°C for 30 s, 65°C for 30 s and 72°C for 1 min; with a final extension at 72°C for 10 min. PCR amplification of the nad1 gene used the same quantity and mixture compositions as used for ITS2. The forward primer Pc–nad1–F1 (5′–CAGATTCGGAAGGGGCCTAA–3′), and the reverse primer Pc–nad1–R1 (5′–ACGTAGCACGAGCCCAAATA–3′), to amplify the nad1 gene (657 bp) were designed from the complete mitochondrial genome sequence deposited in GenBank (accession no. KT19981). For amplification of the nad1 gene, the thermocycler was programmed with an initial denaturation at 94°C for 5 min; followed by 40 cycles at 94°C for 30 s, 52°C for 30 s and 72°C for 1 min; with a final extension at 72°C for 10 min. The PCR reactions were performed by using the GenAmp PCR system 2700 (Applied Biosystems, Tokyo, Japan). PCR products were loaded on 1.2% agarose gel for electrophoresis, stained with ethidium bromide and subsequently visualized by an ultraviolet trans-illuminator to check the quality of amplified products. PCR products were purified by using the High Pure PCR Clean up Micro Kit (Roche) before sequencing.
The amplicons for both ITS2 and nad1 were sequenced directly from both directions using Bigdye Terminator v3.1 Cycle Sequencing Kit (Applied Biosystems, Foster City, California, USA). The thermal program was 25 cycles at 96°C for 10 s, 65°C for 5 s and 60°C for 4 min for ITS2. In the case of nad1, the cycle conditions were same as those for ITS2 except for the annealing temperature, which was set at 52°C. The resultant amplicons of both ITS2 and nad1 were then precipitated with ethylenediaminetetraacetic acid (EDTA)/ethanol for final purification prior to sequencing. Sequence reactions were run on a 3500 Genetic Analyzer (Applied Biosystems). Each sequence was initially assembled on ATGC ver. 6.0.3 (Genetyx Co., Tokyo, Japan) and was analysed using GENETYX version 10.0.2 (Fluxus Technology Ltd., Suffolk, England).
Phylogeny
The sequences of both ITS2, including partial 5.8S and 28S rRNA (442 bp), and nad1 (657 bp) were aligned by GENETYX version 10.0.2 and haplotypes were distinguished. The phylogenetic analyses for the sequences of ITS2 and nad1 were conducted by maximum likelihood (ML) using MEGA6 (Tamura et al., Reference Tamura, Stecher, Peterson, Filipski and Kumar2013). The ML method was used to determine the best nucleotide substitution model based on Bayesian information criterion for ML analyses. The Kimura 2 parameter model, with non-uniformity of evolutionary rates among sites and by assuming that a certain fraction of sites are evolutionarily invariable (K2 + G + I), was selected for constructing the ML tree from ITS2 sequences, whereas the Hasegawa–Kishino–Yano model, with non-uniformity of evolutionary rates among sites (HKY + G), was selected for nad1 sequences. All positions containing gaps and missing data were eliminated. ITS2 sequences of different amphistomes deposited in GenBank were used as references for constructing the phylogram inferred from ITS2 sequences, whereas the nad1 sequence of Paramphistomum cervi (accession no. KT19981) was used as an outgroup for constructing the phylogram inferred from the nad1 gene. In both the trees, bootstrap analyses were conducted using 1000 replicates. To better understand the divergence of nad1, with an aim to track the origin and distribution of the fluke, a reduced median (RM) network was also illustrated by Network 4.5.1.6 software (Bandelt et al., Reference Bandelt, Forster and Rohl1999), and the image enhancement was conducted using Microsoft Office PowerPoint 2007. A median vector, hypothesized haplotype, was required to connect the existing haplotypes in the network.
Population genetics analyses
Population diversity indices (number of variable sites, S; number of haplotypes, h; haplotype diversity, Hd; nucleotide diversity, π) were calculated for each group of E. explanatum populations from Bangladesh and Nepal using DnaSP 5.1 (Librado & Rozas, Reference Librado and Rozas2009). To estimate the degree of flow between the populations corresponding to the groups, the pairwise fixation index (Fst) was calculated by using Arlequin 3.5.1.2 (Excoffier & Lischer, Reference Excoffier and Lischer2010).
Results
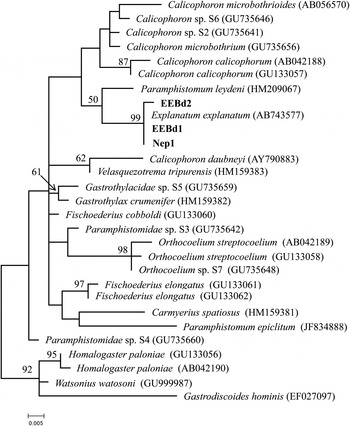
Two ITS2 sequences were obtained from 66 flukes from Bangladesh, designated as EEBd1 (LC101682) for 64 flukes and EEBd2 for 2 flukes (LC101683), which differed from EEBd1 in only one nucleotide. ITS2 sequences of 20 flukes from Nepal were identical to EEBd1 and designated as Nep1 (LC101684). EEBd1 and Nep1 had an identical sequence to that of E. explanatum (AB743577) deposited in GenBank. In the ML phylogram inferred from the ITS2 sequences (442 bp), EEBd1, EEBd2 and Nep1 were included in the same cluster along with the reference sequence (AB743577) of E. explanatum where species identification was based on morphology as well as ITS2 sequences (fig. 1). From these findings, the liver amphistomes from Bangladesh and Nepal were identified as E. explanatum.
Maximum likelihood tree inferred from ITS2 (442 bp) sequences of E. explanatum from Bangladesh and Nepal (highlighted with bold face), and those from other members of amphistomes deposited in GenBank. Bootstrap values higher than 50% are shown on the tree node.

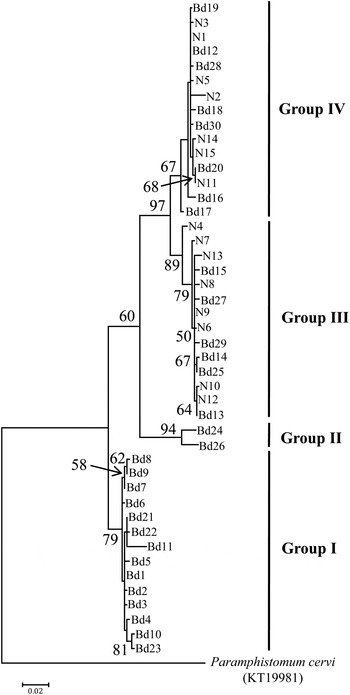
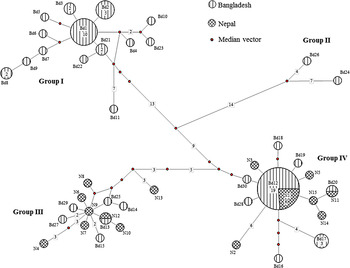
The nad1 sequences (657 bp) of E. explanatum from Bangladesh displayed a total of 83 nucleotide substitutions with an intraspecific variation of 1–6%, yielding 30 haplotypes represented by Bd1–Bd30 (LC101685– LC101714) (see supplementary table S1). The 20 flukes from Nepal had 35 nucleotide substitutions with 1–3% intraspecific variation in nad1 sequence, yielding 15 haplotypes designated as N1–N15 (LC101715–LC101729) (see supplementary table S2). In the ML phylogram inferred from nad1, the flukes from Bangladesh were clustered in four distinct groups, group I to group IV, while the flukes from Nepal were included in groups III and IV (fig. 2) along with the flukes from Bangladesh. We also constructed neighbour-joining phylograms (not shown) for both ITS2 and nad1 sequences but the topology was similar to those of ML trees. To understand the hypervariability of the nad1 gene more clearly, we also constructed a reduced median network, where the flukes from Bangladesh and Nepal were grouped in the same pattern as in the ML phylogram. The nucleotide substitutions among the groups ranged from 13 to 36, while the substitution range within the groups was 1–9, 4–7, 1–6 and 1–6 for groups I, II, III and IV, respectively (fig. 3).
Maximum likelihood tree inferred from the mitochondrial nad1 gene (657 bp) sequences of E. explanatum from Bangladesh and Nepal. The sequence of nad1 from Paramphistomum cervi was used as an outgroup. Bootstrap values higher than 50% are shown on the tree node.

A reduced median network for mitochondrial nad1 haplotypes of E. explanatum from Bangladesh and Nepal. Numbers on the nodes indicate the number of nucleotide substitutions, whereas the unlabelled nodes indicate that the number of nucleotide substitutions is only one. Small, red circles on the nodes represent median vectors. The haplotype codes are labelled adjacent to the circles. Frequencies greater than one are cited in the circles.

The number of variable sites (S), haplotype diversity (Hd) and nucleotide diversity (π) were calculated by population genetics analyses for each population of Bangladesh and Nepal. In Bangladeshi populations both Hd (1.000 ± 0.500) and π (0.01826) were the highest in group II. The lowest values for both the indices were observed in the Bangladeshi population in group IV (table 1). The pairwise fixation indices (Fst) were statistically significant (0.82640–0.92982; P < 0.05) between each pair of populations, signifying the maintenance of a relatively low level of gene flow between the populations. In contrast, the Fst value between the populations of Bangladesh and Nepal within group III (0.00049), and that within group IV (0.03537) were not significant (table 2).
Population genetics analyses for the nad1 gene of the E. explanatum populations from Bangladesh and Nepal. N, number of sequences; S, number of variable sites; h, number of haplotypes; Hd, haplotype diversity; SD, standard deviation; π, nucleotide diversity (see supplementary tables S1 and S2 for haplotypes in haplogroups I−IV).

Pairwise fixation index (Fst value) between populations of E. explanatum from Bangladesh and Nepal, based on the nucleotide datasets of the mitochondrial nad1 gene (see supplementary tables S1 and S2 for haplotypes in haplogroups I−IV).

* Significant P value (P < 0.05).
Discussion
Characterization of amphistomes so far is mainly based on morphology and morphometry, which are greatly variable depending on the age of the fluke, fixation protocol and selection of angles during preparation of sagittal sections (Näsmark, Reference Näsmark1937; Eduardo, Reference Eduardo1982). Therefore, in this study, we did not direct emphasis on morphological characterization of the flukes; rather, we used molecular markers for characterization. The ITS2 sequence identity (99.8–100%) of E. explanatum populations in Bangladesh, Nepal and Myanmar (Ichikawa et al., Reference Ichikawa, Kondoh, Bawn, Maw, Htun, Thein, Gyi, Sunn, Katakura and Itagaki2013) suggests that ITS2 is much conserved within this species from these three geographic areas. This conservative property in ITS2 of E. explanatum means that it is an effective marker for species identification.
In contrast to the conserved ITS2 sequences, nad1 sequences among E. explanatum isolates were remarkably divergent, with four distinct haplogroups, I–IV, differing at 13 (2%) to 36 (5.5%) nucleotides regardless of their geographical sources. Within the groups III and IV, the values for both Hd and π were similar between the populations from Bangladesh and Nepal. This result indicates that the populations from Bangladesh and Nepal within the groups III and IV might have originated at almost the same period of time, and/or might have been transferred into the countries through anthropogenic movement of domestic ruminants. The significant Fst values between the groups of Bangladeshi and Nepalese populations suggest that the populations originated independently in South Asia. On the other hand, the Fst values between populations of Bangladesh and Nepal within the groups III and IV were insignificant, pointing to the fact that, within these groups, closely related populations of E. explanatum are distributed in Bangladesh and Nepal.
Parasites are strongly associated with their host through co-evolutionary processes, and the geographical distribution of parasites is often linked with the distribution of their hosts. Although ecological factors play a role in the biogeography of parasites, the association between parasites and their hosts is almost always a strong bond (Poulin & Mouillot, Reference Poulin and Mouillot2003). According to Sey (Reference Sey1991), E. explanatum flukes were recovered from a variety of wild animals, including the ancestors of present-day domestic water buffaloes (Bubalus arnee f. bubalis) and cattle (Bos primigenius). Therefore, the origin of these divergent populations of E. explanatum in endemic areas of South Asia might be associated with the complex domestication events of water buffaloes (Bubalus bubalis) and zebu cattle (Bos indicus) over time. Domestic water buffaloes are the outcome of complex domestication progression at around 6300 years before present (bp). Based on analyses of the mitochondrial D-loop region and archaeological data, it is envisaged that domestic water buffaloes have more than one maternal lineage with a significant gene flow from the wild populations (Kumar et al., Reference Kumar, Nagarajan, Sandhu, Kumar and Behl2007). This might be due to the multiple domestication events of water buffaloes in the western region of the Indian subcontinent, or through the continuous addition of a large number of wild females with divergent mitochondrial genes to the previously domesticated stock (Kumar et al., Reference Kumar, Nagarajan, Sandhu, Kumar and Behl2007). Likewise, Chen et al. (Reference Chen, Lin, Baig, Mitra, Lopes, Santos, Magee, Azevedo, Tarroso, Sasazaki, Ostrowski, Mahgoub, Chaudhuri, Zhang, Costa, Royo, Goyache, Luikart, Boivin, Fuller, Mannen, Bradley and Beja–Pereira2010) demonstrated that two mitochondrial lineages, l1 and l2, of zebu cattle are distributed in Asia, where l1 was found to be domesticated in the Indus valley region more than 9000 years bp, while l2 was thought to be domesticated either in northern areas (Ganges, middle Ganges or in Nepal/ Bhutan) of the Indian subcontinent or in South India. As E. explanatum was primarily the parasite of wild animals, including the ancestors of present-day domestic animals, it might be introduced into the domestic stock with divergent lineages from different geographical locations along with the multiple domestication events of domestic animals. Therefore, this study revealed that there are at least four independent populations of E. explanatum. Among many ecological factors, the intermediate host Gyraulus convexiusculus (Singh, Reference Singh1958), a freshwater snail, plays an important role in maintaining the life cycle of the fluke. Gyraulus convexiusculus, whose original range of distribution has been in South Asia, is very common and widely distributed globally, and is assessed not to be under threat of extinction (least concern) (Van Damme, Reference Van Damme2014). Therefore, it can be speculated that the distribution of the snail intermediate host has no relation to the diverse nad1 sequences of E. explanatum.
This study, for the first time, provides molecular characterization of E. explanatum in Bangladesh and Nepal, and may provide useful information for elucidating its origin (and dispersal route) in Asia. The RM network analysis of the nad1 gene indicates that the possibility exists for the presence of a more divergent group of populations in Asian countries. Therefore incorporation of more samples from wider geographic areas in Asia may give a more precise picture of the phylogeographic distribution of E. explanatum.
Supplementary material
To view supplementary material for this article, please visit http://dx.doi.org/10.1017/S0022149X16000420
Financial support
This study was supported in part by a Grant–in–Aid for Science Research (B) (no. 23405044) from the Ministry of Education, Culture, Sports, Science and Technology of Japan.
Conflict of interest
None.