INTRODUCTION
The agricultural land classification (ALC) system used in England and Wales was first defined in 1966 (MAFF 1966). The purpose of the classification was primarily for land use planning in order to steer urban development away from those areas of land that had the greatest agricultural potential. The limiting physical factors were originally identified as: climate (rainfall, transpiration, temperature and exposure); relief (particularly slope) and soil (wetness, depth, texture, structure, stoniness and available water capacity). These factors are used to classify the land into five grades, with Grade 1 being excellent quality and Grade 5 being of very poor quality.
In 1988, the improvement in both the availability of detailed soil maps from the Soil Survey of England and Wales and climate data from the Meteorological Office, led to the publication of a revised ALC (MAFF 1988). In order to provide an objective assessment of the overall climate limitations, a grid point dataset with a 5 km resolution was produced. The revised classification mainly changed the criteria for assessing the climatic limitations and those involving a climate–soil interaction, namely soil wetness class (Hodgson Reference Hodgson1976) and droughtiness (Thomasson Reference Thomasson, Jarvis and Mackney1979). Further factors were also included in the assessment such as toxicity, flood risk and erosion risk. In addition to the new criteria, Grade 3 land was subdivided into two classes, 3a and 3b. The new rasterized climatic data were developed collaboratively by the Meteorological Office and the Soil Survey and Land Research Centre, Silsoe (formerly the Soil Survey of England and Wales based at the Rothamsted Experimental Station in Harpenden). The creation of these new datasets and interpolation procedures are described in Jones & Thomasson (Reference Jones and Thomasson1985), Ragg et al. (Reference Ragg, Jones and Proctor1988) and the Meteorological Office (1989).
Climatic limitations have a major, and in places overriding, influence on land quality. Temperature and rainfall fundamentally affect plant growth, determining the energy available for photosynthesis and the water supply available to the roots. In climatic terms, the poorest land for crop production is found in the wettest and coldest areas. Climate parameters within the ALC system thus include rainfall and temperature, as well as other indicators of droughtiness and wetness such as the duration of field capacity (FCD) and climatic soil moisture deficits (MDs).
The ALC grade is also influenced by the soil texture, structure, depth, stoniness and chemical fertility. Soil factors are assessed alone and sometimes in conjunction with other factors such as FC days to provide an indication of soil wetness.
The aim of the present study was to create a complete and consistent set of historic agroclimatic parameters from data recently provided by the Meteorological Office; these data comprise a 5 × 5 km grid dataset of primary climate parameters for every month from 1914 to 2006. Using this information, a set of 30-year average data was created for the main ALC climate parameters for the periods: 1921–50, 1931–60, 1941–70, 1951–80, 1961–90 and 1971–2000. These data were then used to assess the implications of any historic changes in these parameters on the ALC. For each of the 30-year periods an assessment of the ALC grade was carried out, using soil and site parameters from the National Soil Inventory (NSI). Based on a systematic grid across England and Wales, spaced at 5 km intervals, the NSI data was originally sampled in around 1980 by the Soil Survey of England and Wales, as it was then called, and it includes information on erosion, landuse and lithological information as well as a very detailed soil description including stone abundance, root descriptions and soil horizon boundary information (McGrath & Loveland Reference McGrath and Loveland1992). For the purpose of the present study, it is assumed that the soil parameters are static, and the paper addresses how changes in the average climate parameters affected the ALC grading throughout this time.
MATERIALS AND METHODS
In 2005, the Meteorological Office created monthly long-term climate averages on a grid for the 30-year period 1961–90 (Perry & Hollis Reference Perry and Hollis2005a). The averages were computed for 13 different climate variables (including the minimum, maximum and mean temperature, precipitation and sunshine duration). Weather station data were interpolated by multiple linear regressions of the station data to define relationships between the key climatic values and the easting, northing, altitude, terrain shape, and the proportion of sea and urban area within a 5 km radius. The residual differences between station data and the value by regression were interpolated onto a 1 km grid using an inverse distance weighting (IDW). At each point on the 1 km grid the climate parameters were calculated using the regression algorithm adjusted by the interpolated residual difference at that location. This method is easy to implement and generate maps that reflect general UK climate patterns accurately. Further monthly grid datasets were created for the period 1914–2004 for a range of climatic variables (Perry & Hollis Reference Perry and Hollis2005b). The maps were created using the same techniques as the 1961–90 datasets, thus allowing direct comparison of changes in space and time. The long-term datasets are fundamental to assessing the effect of historical climate change on ALC classification and should provide a rational method for determining an appropriate baseline for assessing the changes in the predicted future climate scenarios also provided by UKCP09 (Meteorological Office 2006).
The Meteorological Office has provided a series of monthly summary weather data on a 5 × 5 km grid generated for every month between 1914 and 2006 (Perry & Hollis Reference Perry and Hollis2005b). The data provided were:
• From 1914 to 2000 average monthly rainfall (mm) [rain].
• From 1914 to 2000 average daily min, max and mean temperature (°C) [temp: Tmin, Tmax, Tmean].
• From 1929 to 60 sunshine – total monthly hours (hours) [sun].
• From 1961 to 2000 sunshine – average hours per day (hours) [sun].
• From 1961 to 2000 average daily vapour pressure (hPa) [VP].
• From 1969 to 2000 average wind speed at a height of 10 m (Knots) [wind].
This dataset is referred to as the ‘UKCP09’ data. For comparison, the dataset used in the original ALC classification is referred to as the ‘Original’ data (Meteorological Office 1989).
Calculating average annual rainfall (AAR) and accumulated temperature
Two parameters were chosen for the primary assessment of climatic limitations: (1) AAR, as a measure of wetness and (2) accumulated temperature above 0 °C (AT0), as a measure of overall warmth. Accumulated temperature is measured above the selected threshold (0 °C) and over a specified period, such as the growing season (for AT0) or summer period (for accumulated temperature in summer (ATS)). Work on grass and cereals has shown that leaf extension can occur down to temperatures as low as 0 °C and this was therefore chosen as the threshold, while the period from January to June was determined to be the critical period for most crops in the UK. A single grade is given for the overall climate limitation, which combines the AAR and the AT0.
Annual summaries for rainfall and accumulated temperature above 0, 5·6 and 10 °C were calculated for each year in the period. The annual rainfall for each year was the sum of the monthly totals. The accumulated temperature function calculated how much of the minimum, maximum and mean temperatures, for each day, were above the given threshold and whether the record was between the specified dates using the method produced by the Meteorological Office (1969) and subsequently modified by Hallett & Jones (Reference Hallett and Jones1993). The function returned the daily effective temperature (measured as day-degrees above the threshold), which was then multiplied by the number of days in the month and accumulated over the required period. For AT0 and ATS, the threshold was set to 0 °C and the period was defined as January–June for AT0 and April–September for ATS.
The average (mean) annual rainfall and the median accumulated temperature (AT0) and median ATS was calculated for each of the 30-year periods, 1921–50, 1931–60, 1941–70, 1951–80, 1961–90 and 1971–2000. Monthly average rainfall (January–December) was also calculated to show seasonal changes.
Calculating evapotranspiration
The climate data provided by UKCP09 included all the variables required to make a reasonable approximation of evapotranspiration using the Penman–Monteith equation (Allen et al. Reference Allen, Periera, Raes and Smith1998). The methodology used to calculate the evapotranspiration from the available climate variables is described in detail in Hess (Reference Hess2000):
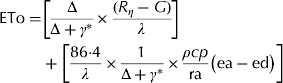 $$\eqalign{{\rm ETo} = & \left[ {\displaystyle{{\rm \Delta} \over {{\rm \Delta} + \gamma ^ *}} \times \displaystyle{{(R_\eta - G)} \over \lambda}} \right] \cr & + \left[ {\displaystyle{{86{\cdot}4} \over \lambda} \times \displaystyle{1 \over {{\rm \Delta} + \gamma ^ *}} \times \displaystyle{{\rho cp} \over {{\rm ra}}}\left( {{\rm ea} - {\rm ed}} \right)} \right]} $$
where ETo is the reference crop evapotranspiration (mm/d), Δ is the slope of vapour pressure curve (MJ/kg) – ƒ(temp, VP), γ* is the modified psychrometric constant (kPa/°C) – ƒ(temp, wind, altitude), Rn is the net solar radiation (MJ/m2/d) – ƒ(temp, VP, sun), G is the soil heat flux (MJ/m2/d) – set to 0 for monthly data, λ is the latent heat of vaporization – ƒ(temp), ρ is the atmospheric density (kg/m3) – ƒ(temp, altitude), cp is the specific heat of moist air (1·013 kJ/kg/°C), ra is the aerodynamic resistance (s/m) – ƒ(wind), ea is the mean saturation vapour pressure (kPa) – ƒ(temp) and ed is the actual vapour pressure (kPa) – ƒ(VP).
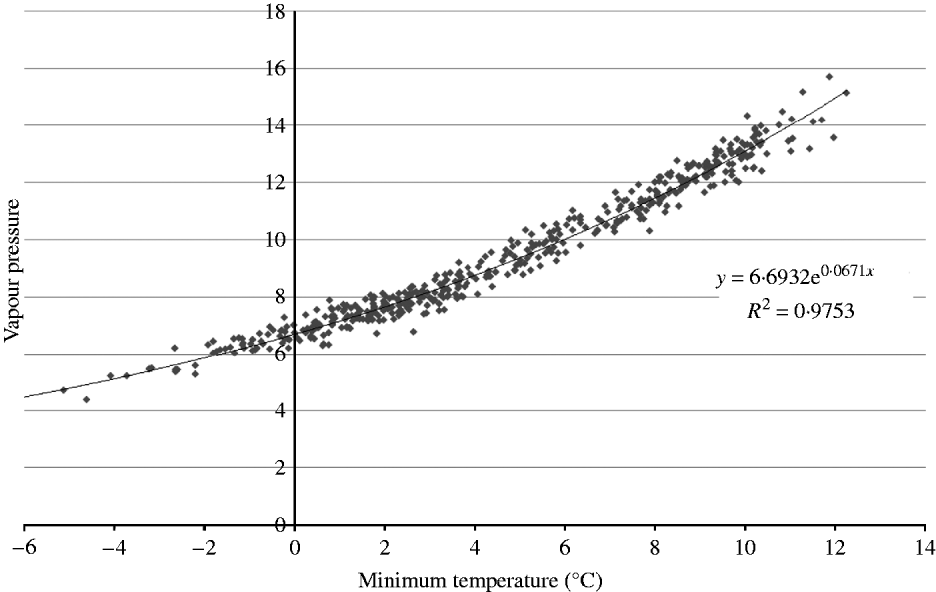
It was necessary to estimate the missing values for vapour pressure (1914–60), windspeed (1914–68) and sunshine hours (1914–28) to produce a contiguous dataset. Analysis of the vapour pressure records from 1961 to 2000 showed a strong relationship between VP and T min (Fig. 1).
 $$VP = 6{\cdot}6932 \ {\rm e}^{0.0671 \ {T_{\min}}} $$
This formula was used to populate the missing VP records from 1914 to 1960.
Vapour pressure related to minimum temperature from UKCP09 monthly data from 1961 to 2000.

The wind speed was measured at a height of 10 m above ground and thus for the purpose of the Penman–Monteith method it was adjusted down to the reference height of 2 m. Wind speed was variable and there was no strong relationship with any of the other variables. In order to distinguish the exposed areas of Britain, such as the hills and coasts, from the less windy regions, the average windspeed was calculated for each individual grid point from the 1969–2000 records and this value was then used to populate the records before this date. The missing sunshine records from 1914 to 1928 were estimated by calculating the average sunshine by month using regression to determine a polynomial equation.
Calculating potential soil moisture deficit (PSMD)
The degree of drought in a soil is influenced by three factors: rainfall amount, evapotranspiration and the store of water available in the soil. The ALC method to assess droughtiness is based on the concept of PSMD, which describes the balance of rainfall and potential evapotranspiration from a green crop that completely covers the ground during the growth cycle (Thomasson Reference Thomasson, Jarvis and Mackney1979). MD in the soil builds up over the summer months in most of lowland Britain, the potential evapotranspiration increasing progressively from spring onwards and peaking in July or August, resulting in a maximum recorded soil MD.
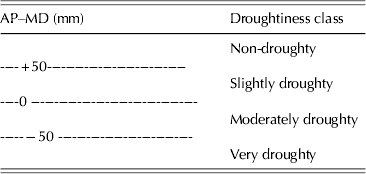
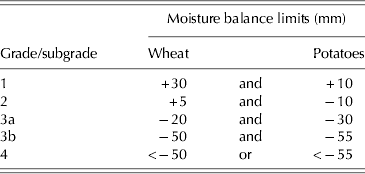
For calculating ALC grade, the PSMD is adjusted for two reference crops, winter wheat and main crop potatoes, representative of a broad range of crops in terms of their susceptibility to drought (MAFF 1988). In 1983, the crop adjusted soil MDs was calculated for 94 stations in the ‘Complete’ Agromet Data set (Field Reference Field1983) from 1961 to 1980 and subsequently extended to include a further 25 sites in Scotland and 2 sites in Northern Ireland (Harvey Reference Harvey1983). From these records, regression equations allowed MD for wheat and potatoes to be calculated from the ATS and the average summer rainfall (ASR). The ATS value was derived from a regression equation based on the AT0. To calculate the droughtiness of the soil, the crop-specific MD (mm) is subtracted from the water available to that crop in the soil (AP). Four classes of drought are defined (Table 1).
Classes of soil droughtiness
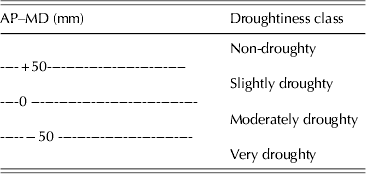
AP, available water in the soil profile; MD, moisture deficit.
PSMD was calculated for each month in each year throughout the period. The monthly MD equals the MD for the previous month plus the amount that potential evapotranspiration exceeds rainfall. When the balance rises above 0 (i.e. there is a moisture surplus) it is reset to 0. This calculation represents a potential climatic deficit but the actual deficit is modified by the amount of water available in the soil. For example, following a dry autumn some areas in eastern England may still experience potential deficit in January and February of the following year but to carry this deficit into the next spring period would distort the calculations in the following year. Therefore the PSMD is reset to 0 at the end of February each year. Over the 87-year period the annual maximum PSMD showed a skewed distribution with very high values in a few years. To compensate for these extreme years, the median PSMD value was used to describe the PSMD for each 30-year period.
The crop-adjusted MD under wheat and potatoes can be calculated by two methods. The first method calculates PSMD from the relationships with specific monthly PSMD values – see Eqns (3) and (4) below (Jones & Thomasson Reference Jones and Thomasson1985). For winter wheat, it is assumed that the crop requires only one-third of the MD until full ground cover is achieved, normally at the end of April, and the crop does not require water from the soil once it has reached the ripening stage of its growth, usually around mid-July:
 $$\eqalign{{\rm MDWHT =\ } & {\rm mid {\hbox{-}} July} \ {\rm PSMD} \cr & -{\rm 1}/{\rm 3} \ {\rm April} \ {\rm PSMD}} $$
Main crop potatoes can be considered to be under bare-ground conditions until mid-May, with full crop cover achieved around the end of June and growth continuing in August through the period of maximum deficit:
 $$\eqalign{{\rm MDPOT} = \ & {\rm August} \ {\rm PSMD} - {\rm 1}/{\rm 3} \ {\rm June} \ {\rm PSMD} \cr & - \ {\rm 1}/{\rm 3} \ {\rm mid {\hbox{-}} May} \ {\rm PSMD}} $$
The second method calculates potential moisture deficit under wheat (MDMWHT) and potatoes (MDMPOT) (Meteorological Office 1989) from relationships with ASR (April–September) and ATS from station data between 1960 and 1980 as follows:
 $$\eqalign{{\rm MDMWHT} = \ & {\rm 325} {\cdot} {\rm 4}-{\rm 162} {\cdot} {\rm 3 \log10}{\rm ASR} \cr & + 0 {\cdot} 0{\rm 8}0{\rm 22ATS}} $$
 $$\eqalign{{\rm MDMPOT} = \ & {\rm 326} {\cdot} {\rm 4} - {\rm 196} {\cdot} {\rm 5 \log10}{\rm ASR} \cr & + 0 {\cdot} {\rm 1127ATS}} $$
The PSMD values computed using the first method are much more extreme than using the second method and are likely to be the result of differences in the calculation of ETo. The original ETo data were calculated using a pre-Penman–Monteith method, which produced smaller MD values than the Penman–Monteith equation adopted for The Met Office Rainfall and Evaporation Calculation System (MORECS) (Thompson et al. Reference Thompson, Barrie and Ayles1981). However, deficiencies in the original documentation make it difficult to duplicate the original methods. The ranges of values go beyond the original data used to formulate the regression equations, so it could be argued that it may be inappropriate to adopt the regression methods. However, the methods that use the ETo derived using Penman–Monteith in the PSMD calculations result in a larger number of sites being limited by droughtiness than is appropriate for the UK. Thus, droughtiness calculated using the second method was selected over the first method as it was a better fit to the known pattern of drought in the UK.
Calculating FC days
The wetness component of the climatic regime is determined from the FCD. The start and end dates of FC are probably the most difficult of all the agroclimatic parameters to predict. A soil is said to be at FC when it holds the maximum amount of water against the force of gravity (Veihmeyer & Hendrickson Reference Veihmeyer and Hendrickson1931), which in a meteorological sense is when the soil is at zero MD. Soil MDs were originally determined by Smith (Reference Smith1967) from the ‘actual’ MD over the year calculated from the balance of bi-weekly rainfall and monthly potential transpiration. Smith used a simple water abstraction model to limit transpiration from the soil to take into account the fact that water is retained at stronger and stronger suctions in most soil material as it dries out. The start of the FC period was determined from the date at which the soil water was no longer in deficit, i.e. there was a water surplus in the soil. This state is often achieved in the autumn on agricultural land, but in drier areas of south-east England, for example, it can be as late as the end of November in a normal year. In the wettest areas at higher elevation, the soil can remain at FC throughout the year, e.g. >500 m asl in northern Wales and north-west England. Once the soil reaches FC it can fluctuate in and out for a few days or weeks, depending on the weather, but eventually settles down through the winter until the temperatures begin to increase in the spring; the soil once again begins to dry out and a soil MD develops.
In 1971, the start and end dates of FC were calculated for 97 sample stations across the country (Smith Reference Smith1971). From these analyses, estimates of the start and end dates of FC were developed from algorithms based on actual soil MD at the end of specific months and the annual average rainfall classified into four zones. The country was divided into 70 areas of similar climate and a full range of agroclimatic parameters were determined for each of these zones using meteorological station data from 1941 to 1970 (Smith Reference Smith1976). For ALC purposes, regression algorithms were developed from these data to calculate the start and end dates of FC from the AAR and altitude (Jones & Thomasson Reference Jones and Thomasson1985). Spatial coverage on a 10 km, and subsequently 5 km, grid was developed and the start and end dates adjusted by the residual difference between the equation and the measured value at the nearest climate station (Ragg et al. Reference Ragg, Jones and Proctor1988).
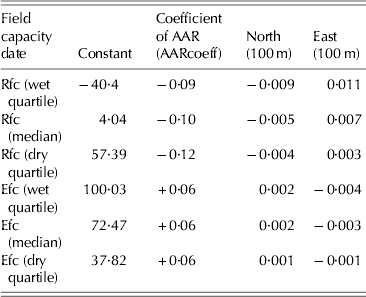
Calculating the start and end dates of FC from the raw monthly water balance data was contemplated, but it was decided that this was too crude as daily data are really needed to give a better estimate; thus regression functions (Table 2) were developed that related the FC data to the easting, northing and AAR (Jones & Thomasson Reference Jones and Thomasson1985). In the original ALC exercise in 1989, the regression value at each 5 km point was adjusted for the residual difference derived from measured values at the nearest weather station. To maintain continuity with the original methods, the FC dates, obtained by regression, were adjusted by the difference between the AAR of the original data (1941–70) and the AAR of the UKCP09 data multiplied by the coefficient for AAR from the original regression equation:
 $$\eqalign{{\rm xFC}_{({\rm ukcp}0{\rm 9})} = \ & {\rm xFC}_{({\rm original})} \times {\rm AARcoeff} \cr & \hskip -3.5pt\times {\rm} ({\rm AAR}_{({\rm ukcp}0{\rm 9})} -{\rm AAR}_{{\rm (original)}} {\rm )}} $$
Field capacity parameters for original 5 km dataset (Dr Robert Jones, personal communication)
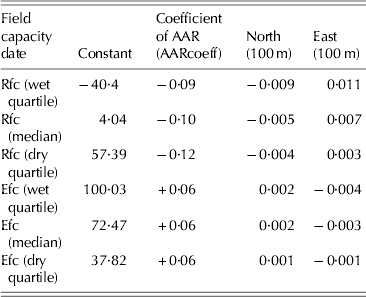
Rfc, return to field capacity; Efc, end of field capacity.
Calculating wetness class
Soil wetness adversely affects seed germination and survival, and restricts the development of a good root system. It reduces the temperature of the soil and causes anaerobic conditions. The wetness of the soil also affects the sensitivity of the soil to structural damage influencing the number of days when the site is accessible to farm machinery or livestock grazing. Soil wetness is assessed by a combination of the climatic regime, the soil water regime and the texture of the top 250 mm of the soil.
The soil–water regime was determined using soil wetness classes (I–VI) (Hodgson Reference Hodgson1976) based on the depth and duration of water-logging measured by field-based monitoring of dipwell levels (Robson & Thomasson Reference Robson and Thomasson1977; Jones Reference Jones1985). The scale ranges from class I, where the soil is not wet within 0·70 m for more than 30 days in a year (and is usually recognized by the lack of any mottling due to reducing conditions), to class VI, where the soil is wet within the top 0·40 m for more than 335 days in most years. For ALC purposes, wetness class of a soil is assessed by a decision-tree approach based on the climate region (FC day zone), the presence or absence of a slowly permeable layer or gleying within specified depths, whether the site is disturbed, and whether the soil is peaty, an organo-mineral or a red soil (MAFF 1988).
The wetness class at each of the NSI locations was calculated using the relevant duration of FC, the texture and the depth of the profile to a gleyed or an impermeable horizon (if it is within 1·50 m), following the method for calculating wetness class provided by MAFF (1988).
Calculating the ALC classification
Once a complete set of agroclimatic data had been created for each of the six 30-year periods, the ALC classification could be applied and the differences resulting from changes in the climate assessed. For this exercise, the climate data for the NSI point (McGrath & Loveland Reference McGrath and Loveland1992) were taken from the data of the 5 km cell in which it resides rather than interpolating the data from the four surrounding sites and adjusting for the altitude difference at the NSI point as described in the original ALC methodology (Meteorological Office 1989).
Functions were derived to calculate each of the 10 ALC criteria being assessed in this exercise.
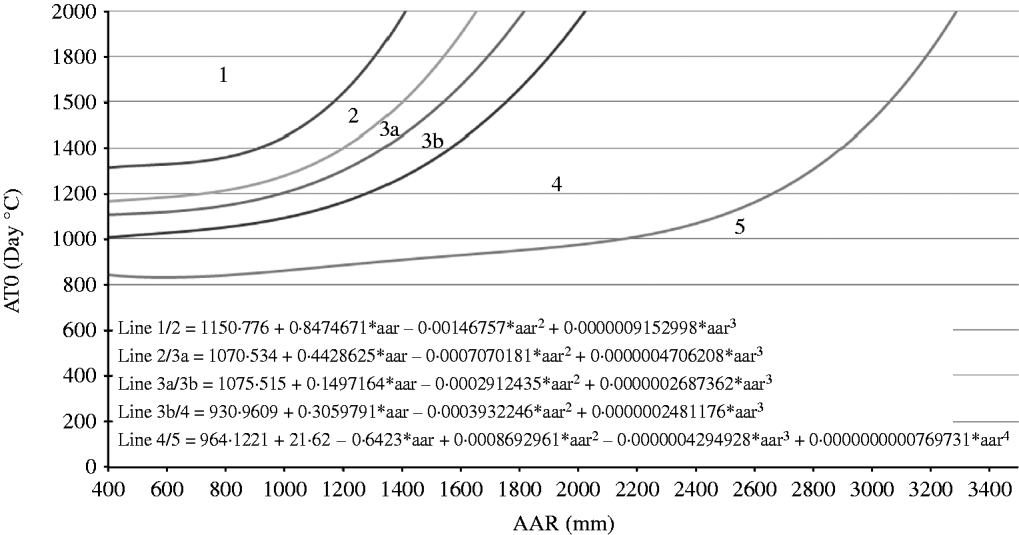
Climate was calculated from AAR and AT0 using an equation describing each of the five curves which separate the six classes (Fig. 2).
ALC grade according to climate.
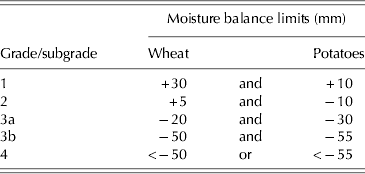
Drought was assessed by taking the available water of the soil profile identified at the NSI site and subtracting the MD at the location for wheat and potatoes and selecting the grade using the defined limits (Table 3).
Grade according to droughtiness
Wetness was assessed from the FCD, topsoil texture and wetness class of the soil, where wetness class was calculated using the FCD and soil properties from the NSI profile data.
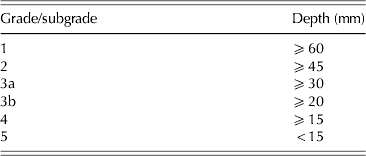
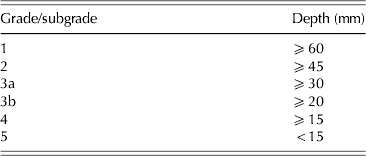
The gradient of the site affects the ability of machinery to operate safely and efficiently and steeper slopes are also at increased risk of soil erosion. When assessing local sites it is also relevant to consider aspects of micro relief, such as rock outcrops or an intensely undulating landscape, which would reduce its manageability. The risk of flooding is assessed on the history of floods, and their duration and frequency at the site. This information is not available for the NSI sites, but, where a site is identified as being on an alluvial soil type this is taken as evidence that the land has been prone to flooding in the past and the ALC classification is therefore limited to ALC Grade 2 at best. Soil texture affects workability and the water available to plants and is therefore used to determine the soil droughtiness and wetness. In addition to these criteria, soils with sandy topsoils are restricted to Grade 3b or below and loamy sands are limited to Grade 2 due to rapid drying effects. The soil depth influences the available water capacity of the soil, crop growth and cultivation (Table 4).
Grade according to soil depth
The stoniness of the topsoil affects the mechanical cultivation and harvesting possibilities at a site as well as reducing the available water in a soil. Therefore the abundance and size of stones in the top 250 mm is used to grade the site. The effect of soil toxicity is also considered, and for the NSI sites the levels of five key elements have been measured: lead, cadmium, zinc, copper and nickel; on sites where these elements exceed a given threshold (Table 5) then the site is automatically limited to Grade 3b (CEC 1986). The last criterion considered by the ALC classification is the presence of soil erosion at the site. This was assessed by the surveyors at the NSI site and documented, if the wind or water erosion was considered significant. If evidence of erosion was recorded, a site was limited to Grade 2.

After all 10 criteria were assessed the most limiting criteria was selected as the overall ALC grade for each site. The most limiting factor(s) which resulted in the overall ALC grade was also recorded.
RESULTS
Changes in agroclimatic parameters
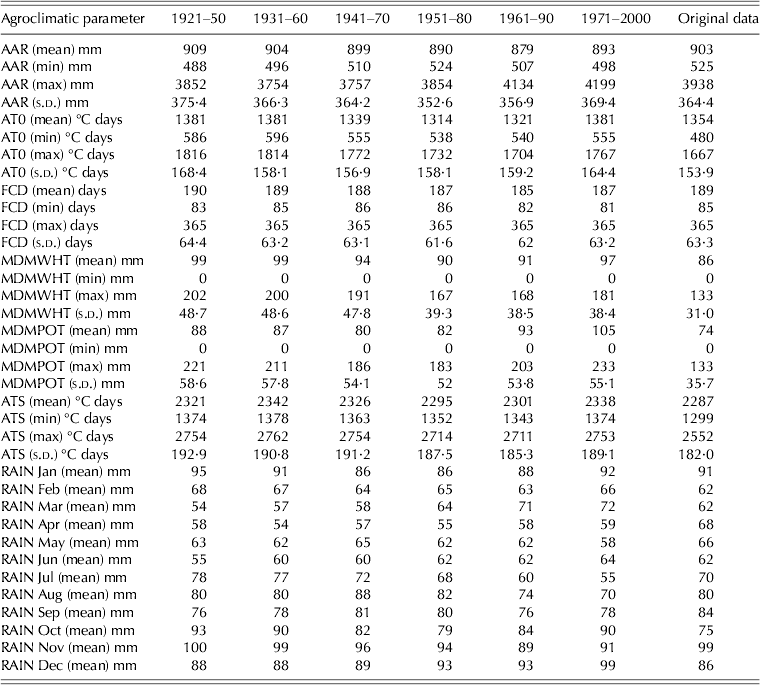
Table 6 shows a summary of the agroclimatic variables calculated for each of the six periods compared with the values from the original agroclimatic data (Meteorological Office 1989). The 30-year AAR reached its lowest point in the period 1961–90 (879 mm), but increased to 893 mm in 1971–2000 (Table 6). There is variation of only 30 mm in AAR over the six periods.
Summary statistics of agroclimatic parameters for whole of England and Wales (6055 sites)
Accumulated temperature above 0 °C (January–June) dropped by 66 °C days reaching its lowest point in 1951–80 (1314 °C days) but then climbed again, reaching its highest point in 1971–2000 (1381 °C days).
The FCD decreased slightly from 1914 to 2000, in line with the changes in AAR. The mean MDs for wheat, calculated using method 2, was lowest (89 mm) in 1941–70 and 1951–80 and highest (96 mm) in 1971–2000 and for potatoes it was lowest (77 mm) in 1951–80 and highest (86 mm) in 1971–2000.
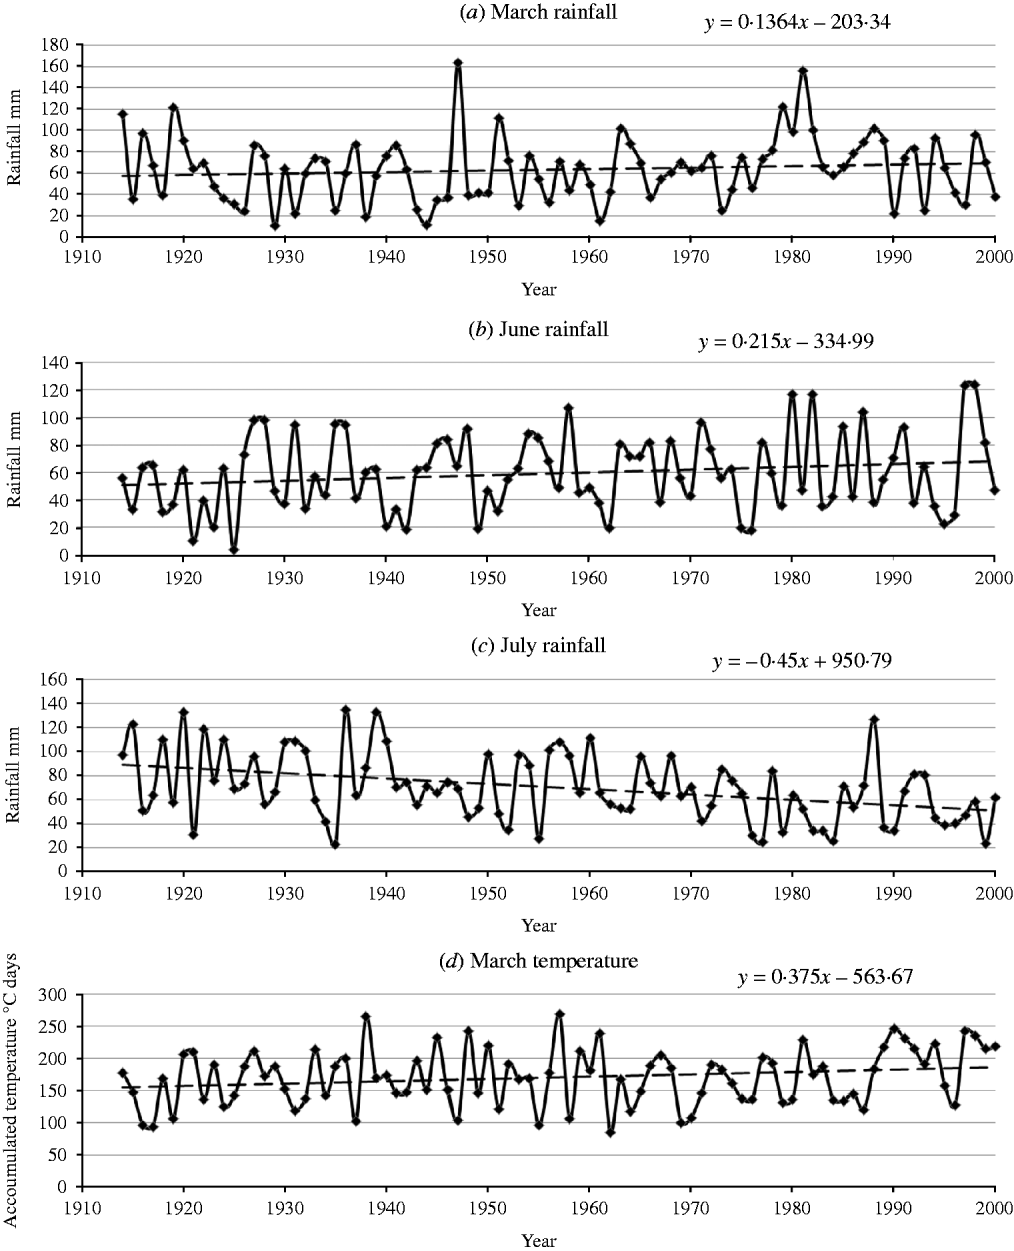
Although AAR remained reasonably stable over the six periods, the seasonal pattern of rainfall over the 1914–2000 period shows noticeable trends. Rainfall increased in March and June (0·14 and 0·2 mm/year respectively) (Figs. 3a and b) and deceased in July (0·45 mm/year) (Fig. 3c). By comparison the monthly temperatures all tended to increase over the 87 years. The increase in AT0 in March was high (0·38 °C days/year) (Fig. 3d) while it was very slight in May and June.
Average monthly rainfall and ATO for England and Wales from 1914 to 2000.
This seasonal change in rainfall pattern was not taken into account in the method used in the present paper to calculate the FCD for the different climate periods as they were adjusted only by the AAR, which has not changed significantly over this time. However, looking at the general trends in seasonal rainfall and temperature, two conclusions can be drawn. Firstly, the increased rainfall in March and June could lead to a later date for the end of FC, which would have a significant effect on the workability of the land in that crucial spring window. Secondly, in the autumn the rainfall pattern has not changed significantly in October–December, but there is a considerable rise in accumulated temperature over this time. This will delay the onset of FC until later in the year. Although the overall FCD might not change much it will start later (in autumn) and end later (in spring), meaning that cropping patterns may benefit from a trend that will favour autumn-sown crops.
Changes in ALC grading
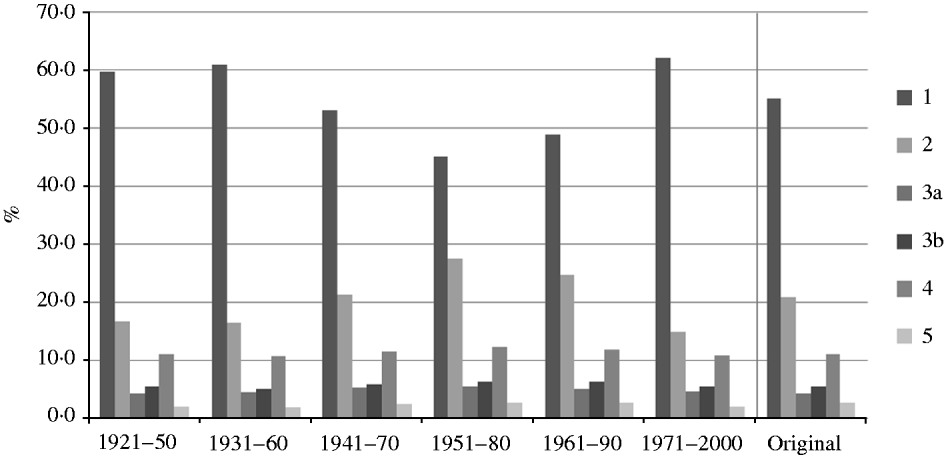
A full set of maps was drawn for each of the 10 ALC criteria, with the three factors influenced by climate (climate, drought and wetness) repeated for each of the six 30-year periods. Figure 4 shows the breakdown of ALC grades based on the climate criteria only, it shows that c. 15% of the Grade 1 land in 1930–60 had reduced to Grade 2 by its lowest point in 1951–80 and since then it has switched back to Grade 1. This variation has been driven by the decrease and subsequent increase in the accumulated temperature values.
ALC grade by climate.
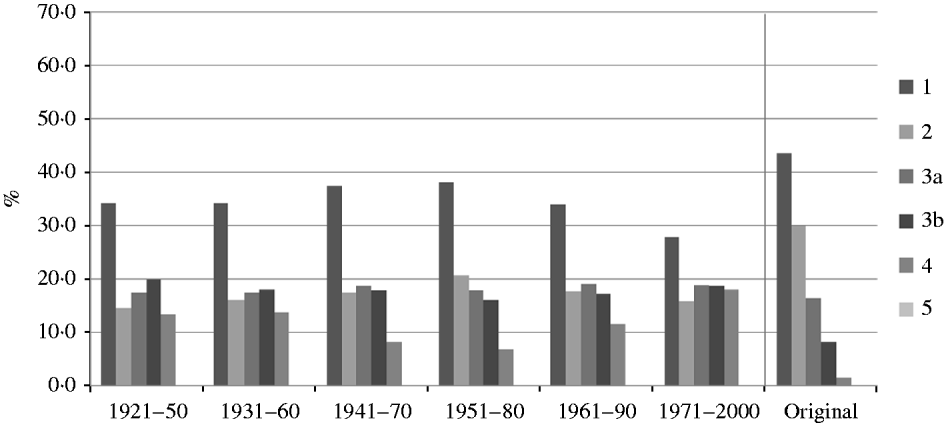
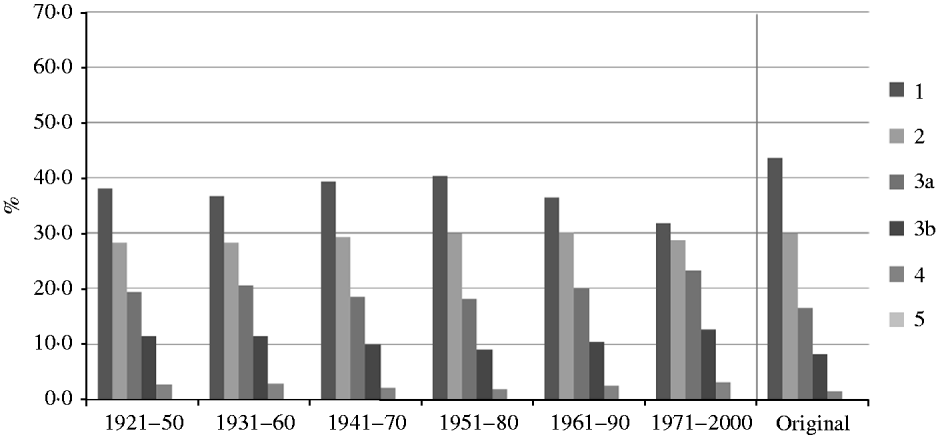
Figures 5 and 6 show the variation in ALC grade by droughtiness following the two methods for calculating MD. In contrast to the climate classification, the area classified as droughty decreased as the temperature cooled and evapotranspiration reduced but increased in the warmer 1971–2000 period.
ALC grade by droughtiness (method 1).
ALC grade by droughtiness (method 2).
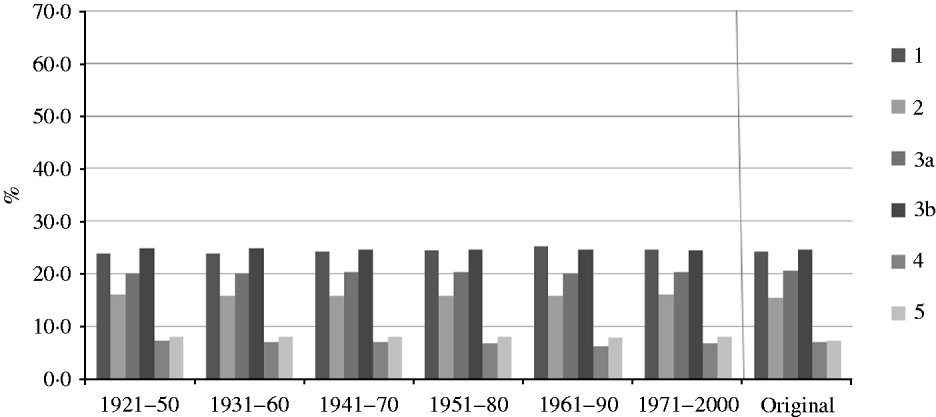
The small change in FCD over the 87-year period results in minimal change in the wetness class of the soils at each NSI site because wetness class is largely based on soil properties that have not been perturbed during the present study. The ALC classification for wetness class is hardly affected by the changing climate (Fig. 7) as it is related to AAR, which has not changed significantly.
ALC grade by wetness.
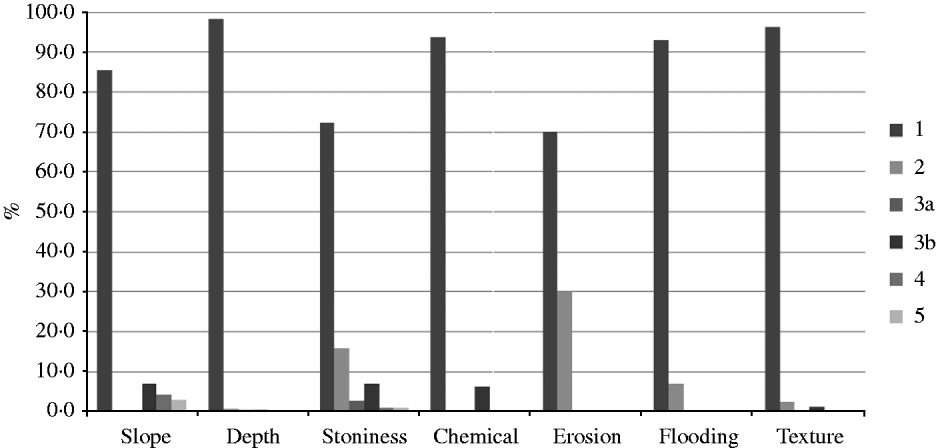
The remaining seven criteria, which are not affected by climate, were assessed and the distribution of sites within each of the ALC grades is shown in Fig. 8.
ALC grade by the remaining seven factors.
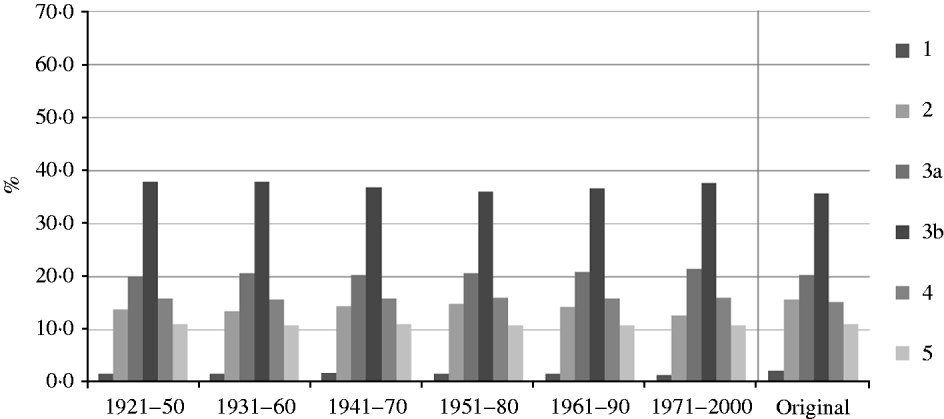
Once each NSI site was assessed individually for the 10 criteria, the lowest ALC grade in terms of quality was selected as the overall ALC grade for that site. Figure 9 shows the proportions of each grade in each 30-year period. The first thing to note is just how few sites were classified as Grade 1 once all the criteria had been applied: one factor or another usually succeeded in lowering the grade.
ALC grade based on ten factors.
Wetness limits more sites than any other factor, with over one-third of sites in England and Wales having this as one of the most limiting factors. This is followed by droughtiness, which affects around one-quarter of the sites. The maps in Figs. 10 and 11 show the distribution of the overall ALC grade when methods 1 and 2, respectively, are used to calculate the MD. The most noticeable difference is the amount of Grade 4 land in 1971–2000 when method 1 is used, with most of East Anglia being classified as Grade 4 on droughtiness. As discussed previously, method 1 generates more extreme values of ETo than the original calculations.
ALC grade complete (MD calculated from moisture balance).
ALC grade (MD calculated using regression from ASR and ATS).
Changes in best and most versatile (BMV) land
Paragraph 28 of the PPS7 (ODPM 2004) defines the BMV agricultural land in England and Wales as land in Grades 1, 2 and 3a and instructs that when determining planning applications, this land should be protected and preference given to poorer quality land (Grades 3b, 4 and 5). Although climate criteria are the most sensitive components of ALC, the changes in the climate over the period have been shown to have the greatest effect on the area classified as either Grade 1 or 2. Thus, the effect on the BMV pool is small, especially as the areas graded as 3a that change to Grade 3b lie mostly on the margins of the uplands, where many sites are already downgraded on slope and/or soil wetness. However, the reduction in the number of droughty soils in eastern England due to the cooler climate in 1951–80 resulted in an increase in the amount of land classified as BMV so that the period 1951–80 had a larger proportion of good quality land than any other period (Table 7).
Number of sites classified as BMV

CONCLUSION
During the creation of the original climatological data for ALC (MAFF 1988) each agroclimatic parameter was summarized for different numbers of stations over different periods and the parameters were then individually interpolated onto a 5 km grid. The new historic 5 km grid data from the Meteorological Office has made it possible to create the required agroclimatic parameters from any time period, which means it is possible to compare changes over time.
The weather in the UK is very variable from year to year and therefore 30-year averages are needed to characterize the principal agroclimatic parameters and allow an assessment of suitability for particular crops and other land uses. A 30-year period is considered sufficiently long enough to accommodate most variation in regional climates. Over the 87-year period analysed, the climate in England and Wales has shown small changes overall, but larger changes in the regional and seasonal values.
When the mean annual AT0 for England and Wales was analysed for 1914–90, the trend was a decrease of 18 °C days. The warmest 4 years for AT0 occurred in the last decade (1991–2000) and all except two of the 10 years recorded above average AT0. This resulted in the overall trend from 1914 to 2000 being an increase of 61 °C days. Summarizing the climate for the 20 years (1981–2000) gives a mean AAR of 913 mm (up 20 mm from 1971 to 2000) and a mean AT0 of 1438 °C days (up 57 °C days) which shows that the next 30-year period (1981–2010) is well on its way to being the warmest and wettest in the record.
The calculation of MD using the Penman–Monteith equation to calculate evapotranspiration produces more extreme values than those calculated for the ‘Original’ data. This results in a large area of land being downgraded by droughtiness. The threshold criteria for the classification of droughtiness would need to be adjusted to provide a more realistic assessment of the drought class that better fits the known pattern of drought in England and Wales.
The ALC grade according to wetness class has so far proved to be hardly affected by the change in climate. This is because the wetness class is driven by the unchanging properties of soil and the FCD, which is proportional to AAR; the predicted seasonal changes in rainfall may have a greater affect on the return and end dates of FC than its duration. Additional work is required to further investigate the effect of a changing climate on FC of soils and the subsequent effect on the wetness class of the soil.
The 30-year period 1961–90 has been designated as the international standard reference period for climate averages by the World Meteorological Organization. This period was one of the coldest in the 87-year span. As an output of this project, a consistent set of agroclimatic properties for the 1961–90 baseline has been created which will be used to assess the effect of future climate change on ALC.
The historic changes in climate over the last 80 years reported in the present paper will be followed up by investigating the effects of predicted future climate change using the UKCP09 future climate scenarios.
The authors wish to thank the following: Claire Hill and David Devaney of Defra whose original query initiated this project; the Meteorological Office for making the UKCP09 datasets available; David Askew and Julie Holloway of Natural England for providing the original documentation and scripts from the ADAS second revision; Dr Tim Hess of the Cranfield Water Science Institute, for advising on the calculation of evapotranspiration and soil MDs; and Sara Larman, Dr Timothy Farewell and Dr Stephen Hallett of Cranfield University for helpful discussions throughout.