1 Introduction
Dusty plasmas can be found in a wide range of both natural and technical environments. These dusty or complex plasmas form an environment that exhibits unique features by possessing, besides electrons and ions, another charged species: microscopic dust particles. With charges, masses and charge-to-mass ratios that differ by orders of magnitude from common plasma species, the charged dust introduces entirely new behaviours, which can be observed on a macroscopic scale. In nature, dusty plasmas govern the formation of planets in protoplanetary discs (Testi et al.
Reference Testi, Birnstiel, Ricci, Andrews, Blum, Carpenter, Dominik, Isella, Natta, Williams and Beuther2014), the dynamics of ring systems (Matthews & Hyde Reference Matthews and Hyde2003) and the interactions of interplanetary plasma with the dusty surfaces of planetary bodies without an atmosphere (Criswell Reference Criswell1972; Wang, Hornyi & Robertson Reference Wang, Hornyi and Robertson2009). In engineering and technology, dusty plasmas can be found as an unwanted by-product e.g. in semiconductor manufacturing and fusion devices (Winter Reference Winter1998). This has triggered interest in researching the dynamics of dust in plasmas, to understand how the dust behaves and how it can be controlled. Besides this technical aspect, dusty plasmas also provide an excellent sandbox for fundamental research. The high charge-to-mass ratio makes it easy to generate strongly coupled dusty plasmas and dust crystals (Melzer, Homann & Piel Reference Melzer, Homann and Piel1996; Quinn et al.
Reference Quinn, Cui, Goree, Pieper, Thomas and Morfill1996; Lee, Chen & Rosenstein Reference Lee, Chen and Rosenstein1997) that can be studied using macroscopic means, while analogies to microscopic systems can be drawn to improve understanding. Also, the dust may be used to modify plasma properties like electric conductivity (Zhukhovitskii et al.
Reference Zhukhovitskii, Petrov, Hyde, Herdrich, Laufer, Dropmann and Matthews2015) or transmittance of microwaves (Gillman & Amatucci Reference Gillman and Amatucci2014). Understanding the behaviour of dust in a plasma opens the door for using the dust as a diagnostic tool to measure the properties of the plasma. Various experiments use either dust equilibrium positions or dynamic motion in both controlled and uncontrolled fashions. Static dust particles generally allow more accurate measurement, while moving dust particles have the advantage for probing larger areas. Dust particles accelerated by instabilities in a dust cloud in microgravity have been used to probe the void within the cloud (Kretschmer et al.
Reference Kretschmer, Khrapak, Zhdanov, Thomas, Morfill, Fortov, Lipaev, Molotkov, Ivanov and Turin2005) while other experiments use laser manipulation (Wolter et al.
Reference Wolter, Melzer, Arp, Klindworth and Piel2007) or a dust accelerator (Buttenschn, Himpel & Melzer Reference Buttenschn, Himpel and Melzer2011) to actively introduce dust particles into the void for diagnostic purposes. Hartmann et al. (Reference Hartmann, Kovcs, Reyes, Matthews and Hyde2014) mapped the horizontal force fields within a plasma by moving the dust particles in the radial direction by rotating the lower electrode and thus controlling the radial centrifugal force. In another example, magnetic field plasma interactions have been studied using dust particles as probes (Dropmann et al.
Reference Dropmann, Laufer, Herdrich, Matthews and Hyde2015) by introducing free-falling particles without active control into a plasma. The resulting data have allowed analogies to spectroscopic measurements of ionized argon interacting with a magnetic probe (Knapp et al.
Reference Knapp, Haag, Ono, Fertig, Herdrich and Auweter-Kurtz2009; Wernitz et al.
Reference Wernitz, Knapp, Eichhorn, Fulge, Herdrich, Lohle, F., Auweter-Kurtz and Roser2011; Dropmann et al.
Reference Dropmann, Knapp, Eichhorn, Lohle, Laufer, Herdrich, Matthews, Hyde, Fasoulas and Roser2016). Further, the rotation of dust structures in a homogeneous magnetic field has been studied (Konopka et al.
Reference Konopka, Samsonov, Ivlev, Goree, Steinberg and Morfill2000; Cheung, Samarian & James Reference Cheung, Samarian and James2003; Carstensen et al.
Reference Carstensen, Greiner, Hou, Maurer and Piel2009), attributing the driving force to
 $E\times B$
induced ion drag or the respective ion–neutral gas interaction.
The method described in this paper uses free-falling dust particles and allows three-dimensional mapping of forces acting on the particles without the need for a stereoscopic set-up or active particle manipulation, making it a simple tool to analyse dust–plasma interactions in various experimental set-ups. First, the physical phenomena underlying the dust dynamics will be described, after which a description of the experimental set-up and required diagnostics and software will be given. Representative examples will be provided for probing the plasma sheath in a GEC reference cell for a simple quasi-one-dimensional sheath, magnetically perturbed plasma sheaths, and the confining electric fields within a glass box in a plasma.
2 Summary of diagnostic method
2.1 Physical basis for the measurements
Particle tracking velocimetry (PTV) is used to investigate the interactions of monodisperse dust particles with a plasma. This method can be used to determine the total force acting on the dust particles as a function of the particle position. One-, two- and three-dimensional vector fields for the acting forces can thus be determined. The total force measured, however, can be attributed to multiple origins and as such interpretation of the results currently depends on simplifying assumptions that are only valid under specific plasma conditions. Contributing forces include the electrostatic force, gravity, neutral drag force, ion drag force, thermophoretic force and Lorentz force. As the dust particles charge negatively in the plasma due to electron collection, electric fields in the plasma sheath close to surfaces lead to a strong force acting on the dust particles. The neutral drag force is caused by the interaction of the dust particles moving relative to the neutral gas background, which can be either at rest or moving. In the free molecular regime this force can be described by the Epstein drag coefficient (Epstein Reference Epstein1924). The ion drag force is caused by the interaction between ions and the dust. In contrast to the neutral gas, the ion density in the described experiments is rather low with a degree of ionization of only
 $10^{-6}$
. The ions, however, can be accelerated to very high velocities by electrostatic fields, which can lead to a significant force. Additionally, Coulomb scattering can contribute to the ion drag force (Khrapak et al.
Reference Khrapak, Ivlev, Morfill and Thomas2002). Temperature gradients in the plasma are responsible for the thermophoretic force, caused by the difference in momentum transferred from the hot and cold gas on opposing sides of the particle. In experiments with strong magnetic fields, charged moving particles may be subjected to the Lorentz force. A summary of these forces acting on particles in a dusty plasma may be found in Fortov et al. (Reference Fortov, Khrapak, Khrapak, Molotkov and Petrov2004).
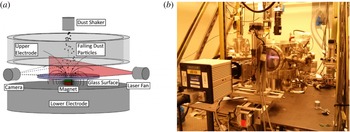
Schematic of the experimental set-up (a). The magnet and glass plate shown are part of an experiment described later. Photograph of the GEC reference cell (b).

2.2 Hardware requirements
To date the method has been used in a modified GEC radiofrequency (RF) reference cell, a standardized capacitively driven RF plasma generator. The plasma is produced in a quiescent argon gas between two electrodes. The lower electrode is powered at 13.56 MHz and disc-shaped with a diameter of 100 mm. The upper electrode is grounded and ring shaped, also having an outer diameter of 100 mm, with an inter-electrode spacing of 19 mm. The ring-shaped upper electrode allows optical access and particle insertion from the top. A vertically fanned laser is used for illumination of the dust, while a high-speed camera oriented perpendicular to the laser records the dust particle trajectories. Different experimental set-ups can be placed on the lower electrode to study various environments. A schematic and photograph of the experiment are given in figure 1. Characterization of the GEC reference cell has been done by Creel (Reference Creel2010). The ions are at room temperature while the electrons have energies of the order of 5–10 eV at a plasma density of the order of
 $10^{15}~\text{m}^{-3}$
. The lower electrode is floating at a voltage of multiple tens of volts negative. As different experiments are conducted with different plasma conditions, these parameters may vary significantly with the experiment. The dust particles used are 8.89 and
 $11.9~{\rm\mu}\text{m}$
diameter melamine formaldehyde (MF) particles and 17.23 and
 $21.83~{\rm\mu}\text{m}$
diameter acrylic glass (PMMA) particles. These particle materials are stable for the duration of a particle drop, which is of the order of 1 s. For appropriate choice of particle size the following considerations must be taken into account: small particles cannot overcome the potential barrier of a plasma sheath at low free-falling velocities (
 ${<}0.5~\text{m}~\text{s}^{-1}$
in the discussed experiments), due to their high charge-to-mass ratio. As such, they are not well suited to mapping the forces close to surfaces. Larger particles, on the other hand, experience less acceleration in the force field, which makes them unsuited to measuring small forces. Consequently a compromise has to be found to measure the largest accelerations possible while still reaching the surfaces of the experimental set-up.
3 Description of the method
3.1 Experiment procedure
Using the described set-up, the high-speed camera is used to record the trajectories of falling dust particles illuminated by the laser fan with a frame rate between 1000 and 2000 f.p.s. Typically recordings of multiple particle drops (5–10 drops with each containing up to hundreds of visible particles) are conducted in order to ensure the recorded trajectories cover the complete field of view, allowing the generation of a complete data map. In case plasma conditions allow stable particle levitation, the levitating particles are removed in between drops by shutting down the plasma to avoid particle interactions during the next drop. The data are described in a Cartesian coordinate system with horizontal coordinates
 $x$
and
 $y$
and vertical coordinate
 $z$
. The origin of the system is either located at the centre of the surface of the lower electrode, or in the case with magnets, at the centre of the surface of the glass plate covering the magnets. To obtain a three-dimensional dataset, trajectories in both the
 $x$
–
 $z$
and
 $y$
–
 $z$
planes have to be recorded at multiple laser plane positions in both
 $x$
and
 $y$
directions. Data are first collected in the
 $x$
–
 $z$
plane using multiple laser positions in the
 $y$
-direction. This process is then repeated after rotating the experimental set-up (or camera-laser set-up) by 90 degrees, allowing the laser to span the
 $y$
–
 $z$
plane and moving the laser along the
 $x$
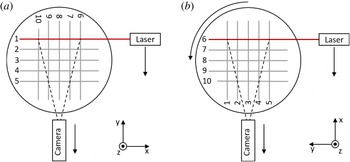
direction in between particle drops. In this manner, all laser fan positions span a grid above the experimental set-up as illustrated in figure 2.
Illustration of 3D measurement principle. A schematic top view of the experimental set-up is shown. First measurements of accelerations in the
 $x$
–
 $z$
-plane are obtained with the laser (and camera) moving along the
 $y$
-axis between measurements. Then the experimental set-up is rotated by
 $90^{\circ }$
around the
 $z$
-axis and respective measurements in the
 $y$
–
 $z$
plane are conducted with the laser being moved along the
 $x$
-axis. Note that the camera should be moved with the laser to ensure that both focus and spatial resolution stay the same.

3.2 Particle tracking
After preprocessing the data in ImageJ, a MATLAB™ algorithm is used to detect the particles which are then connected to their trajectories using the Hungarian algorithm (Kuhn Reference Kuhn1955). Based on these initial calibration measurements the data are then transferred into a standardized coordinate system providing particle positions at respective times in real physical units.
3.3 Determination of velocities and accelerations
Before determining velocities and accelerations, each trajectory is checked for faulty data points by looking for discontinuities in the second derivative of the particle position. These can be caused, for example, by noise falsely identified as a particle or faulty trajectory linking of different particles in successive frames. After identifying any faulty data points, the remaining data are used to calculate the velocities and accelerations at the respective positions. To eliminate the influence of noise, only trajectory segments of minimum length of
 $n$
frames (typically
 $n=5-20$
) are chosen. A polynomial of third order is then fit to the segment’s particle position as a function of the time.
 $$\begin{eqnarray}\boldsymbol{x}(t)=\boldsymbol{c}_{0}+\boldsymbol{c}_{1}t+\boldsymbol{c}_{2}t^{2}+\boldsymbol{c}_{3}t^{3}.\end{eqnarray}$$
In the above
 $\boldsymbol{x}$
is the position,
 $t$
the time and
 $\boldsymbol{c}_{0}$
to
 $\boldsymbol{c}_{3}$
are fitting parameters. Consequently we receive for the velocity and acceleration:
 $$\begin{eqnarray}\displaystyle & \displaystyle \boldsymbol{v}(t)=\boldsymbol{c}_{1}+2\boldsymbol{c}_{2}t+3\boldsymbol{c}_{3}t^{2} & \displaystyle\end{eqnarray}$$
 $$\begin{eqnarray}\displaystyle & \displaystyle \boldsymbol{a}(t)=2\boldsymbol{c}_{2}+6\boldsymbol{c}_{3}t & \displaystyle\end{eqnarray}$$
 $\boldsymbol{v}$
and acceleration
 $\boldsymbol{a}$
. Although the local acceleration at a given point is constant, the particle experiences a time-dependent acceleration as it is moving through different parts of the plasma sheath. These functions are evaluated at the centre of the trajectory segment and the respective values for position, velocity and acceleration are added to the database. In the case that a trajectory segment is longer than
 $n$
frames, this procedure is conducted for all sub-segments of
 $n$
frame length.
3.4 Subtraction of known accelerations
For easier analysis of the data, known accelerations can be subtracted from the data. In this case these include the gravitational acceleration and the neutral drag acceleration as described by Epstein (Reference Epstein1924). While the gravitational acceleration is constant and equals
 $9.81~\text{m}~\text{s}^{-2}$
, the neutral drag acceleration is proportional to the magnitude of the velocity and the Epstein drag coefficient and opposes the particle motion. Both gravity and Epstein drag, assuming resting neutral gas background, have been subtracted from all presented data.
3.5 Generation of acceleration vector fields
The dataset obtained as described contains the combined particle positions, velocities and accelerations from all particle drops of the respective experiment. This information, which contains particle accelerations at quasi-random positions in space, is used to generate vector fields of the accelerations/forces in a structured grid. While the particle position is known in all three dimensions, the velocity and acceleration are only known in the direction defined by the laser plane. However, by taking data from two perpendicular directions, complete three-dimensional vector fields of particle accelerations can be generated. In order to generate the respective vector field, the observed area is segmented into a grid. At each grid point, the average acceleration of all data points within a distance
 $R$
is taken to determine the respective acceleration at this point.
 $R$
must be chosen to be large enough to ensure multiple data points are within this distance. However,
 $R$
also determines the size of the smallest features which will be visible in the acceleration map. As such, it should be chosen to be as small as possible within this constraint. In the examples discussed below,
 $R$
is typically chosen to be 1 mm. To avoid the influence of particle interactions, data points are ignored when the distance
 $D$
to the next particle in the same particle drop and frame is less than 2 mm. As such, interaction forces are more than one order of magnitude smaller than gravity and thus smaller than the resolution of the presented acceleration maps assuming conservatively Coulomb interaction and a particle charge of
 $10^{5}$
elementary charges.
4 Discussion of parameter range
In the experiments presented below, the neutral gas pressure is on the order of 5–10 Pa, while the ion density is of the order of
 $10^{15}~\text{m}^{-3}$
corresponding to a degree of ionization of
 $10^{-6}$
. The heavy particle temperature is approximately room temperature, while the electron temperature is of the order of 5–10 eV. The natural bias of the lower electrode is of the order of several tens of volts negative. Under similar conditions the discussed particle sizes of a few
 ${\rm\mu}\text{m}$
to tens of
 ${\rm\mu}\text{m}$
and materials including MF and PMMA are suitable. It is important to note, though, that the technique has the potential for application across a much wider parameter range. Plasma environments which produce larger forces will require larger dust particles to keep particle accelerations at a moderate level. Higher plasma densities and temperatures will also lead to faster particle degradation, which might require a different choice of particle composition. Other materials available for monodisperse particles include, for example, polystyrene and silica.
5 Examples of measurements
Here multiple examples are presented where the discussed technique has been used in a GEC reference cell. These include a typical plasma sheath above the electrically floating lower electrode, the confinement forces in a glass box of 25.4 mm diameter, a single dipole magnet with both vertical and horizontal dipole axis covered by a glass plate and two set-ups with multiple dipole magnets that mimic the magnetic fields at lunar swirls. The plasma parameters and particles used for each experiment are given in table 1.
Plasma parameters for the presented experiments.

5.1 Plasma sheath
Experiments have been conducted to analyse the plasma sheath above a flat electrode using four different particle sizes: 8.89 and
 $11.9~{\rm\mu}\text{m}$
MF, and 17.23 and
 $21.83~{\rm\mu}\text{m}$
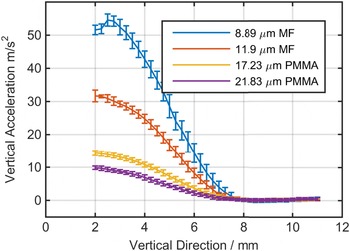
PMMA particles to investigate how the vertical acceleration scales with particle size. In this case the assumption was made that only vertical forces are present that do not change in the horizontal direction, and thus the horizontal direction is not accounted for in the analysis. This simplifies the problem to that of a one-dimensional sheath. The sheath profiles obtained (figure 3) show an exponential increase of the vertical acceleration close to the sheath edge (at 8 mm) as expected due to Debye shielding of the electrode bias. Closer to the surface the steepness of the slope decreases. This effect may be caused by a lower particle charge due to lower electron density as the plasma potential becomes more negative when nearing the negatively biased electrode. Even though different particle sizes experience very different accelerations the data confirm that the sheath edge position is independent of the particle size used.
Acceleration profiles of different particle sizes in the plasma sheath.

5.2 Glass box
Glass boxes have been used in various experiments to create and confine micro-particle structures with extended vertical dimension in a plasma. Many different scenarios of boxes have been investigated. The simplest case is a glass box located on the lower electrode. Other cases with boxes standing on short legs and with conducting indium tin oxide (ITO) coating have also been used. Here the simplest case of a glass box with open top and bottom and dimensions
 $25.4\times 25.4\times 25.4~\text{mm}$
(
 $L\times W\times H$
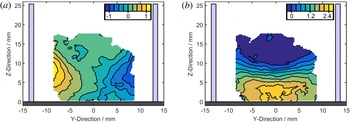
) is used. Figure 4 shows the horizontal and vertical forces acting on dust particles confined within the box. In the horizontal direction, a confining force can be observed that varies in strength with height above the lower electrode. The non-conductive surface of the glass box allows a strong variation in the surface potential over the glass walls and the variation of electron and ion density with height above the lower electrode leads to a variation in the Debye shielding that defines the profile of the resulting electric fields. For this, the vertical electric fields in the centre of the box resemble those of an undisturbed one-dimensional sheath. Towards the sides the sheath expands, probably due to lower electron densities close to the negatively charged glass wall.
Horizontal (a) and vertical (b) accelerations of dust particles confined by a glass box of 25.4 mm width and height. The dark grey area represents the lower electrode, while the light blue areas represent the glass box. Warm colours correspond to right/upward accelerations and cold colours to left/downward accelerations. Accelerations are in units of g.

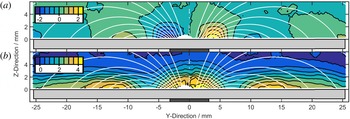
Horizontal (a) and vertical (b) accelerations of the dust particles for a vertically oriented magnet (Dropmann et al. Reference Dropmann, Laufer, Herdrich, Matthews and Hyde2015). White lines represent the magnetic field lines. Warm colours correspond to right/upward accelerations and cold colours to left/downward accelerations. Accelerations are in units of g.

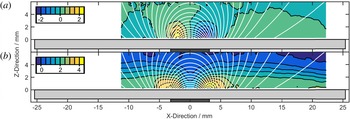
Horizontal (a) and vertical (b) accelerations for the case of a horizontally oriented magnet in the plane spanned by the vertical direction and the magnet’s dipole axis. White lines represent the magnetic field lines. Warm colours correspond to right/upward accelerations and cold colours to left/downward accelerations. Accelerations are in units of g.

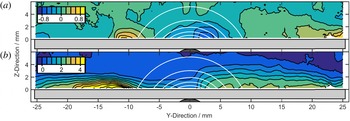
Horizontal (a) and vertical (b) accelerations for the case of a horizontally oriented magnet in the plane perpendicular to the dipole axis. White lines represent lines of constant magnetic flux density. Warm colours correspond to right/upward accelerations and cold colours to left/downward accelerations. Accelerations are in units of g.

5.3 Magnetic dipole
The method has also been used to investigate the interaction of the plasma with a dipole magnet located under a non-conductive surface (Dropmann et al.
Reference Dropmann, Laufer, Herdrich, Matthews and Hyde2015). Here a cylindrical NdFeB magnet of grade 40SH with a diameter and length of 6.35 mm has been used, covered by a glass plate of 1.5 mm thickness. Both horizontal and vertical dipole orientations have been investigated. For the vertical magnet the maximum field strength at the surface is 300 mT, while it is 150 mT for the horizontal magnet. Figure 5 shows the vertical and horizontal accelerations acting on the dust particles. The magnetically perturbed plasma sheath is seen to be thicker and stronger in the cusp region of the magnet. Surrounding this region a weakened (thinner) sheath can be found, where the magnetic field lines are parallel to the surface. This depression in the sheath is bordered by horizontal confining forces, which can lead to stable dust levitation in this region. While the ions remain largely unaffected by the magnetic fields with large gyration radii of more than 5 mm and mean free paths of only 0.5 mm, the electrons have gyration radii of the order of only a few tens of micrometres while the mean free path is of the order of 7 mm. Consequently the electrons are bound by the field lines leading to a modified charge distribution in the plasma volume and a respective non-uniform charging of the non-conductive surface. As a consequence ambipolar electric fields form. These interact directly by an electrostatic force with the dust particles. Additionally an ion flow is induced that can trigger a respective neutral gas motion opposing the electrostatic force indirectly by ion and neutral drag (Puttscher & Melzer Reference Puttscher and Melzer2014). These ambipolar electric fields, as a consequence of magnetic electron redistribution, thus lead to a repulsion of the dust from the central cusp region and a ring-shaped region of 12 mm radius. The resulting two concentric regions lead to a particle confinement region in between. At larger radii the magnetic field is not strong enough anymore to lead to any significant influence. While the case with a vertical magnet (figure 5) is a rotationally symmetric problem, the case with a horizontal magnet shows different behaviours in the
 $x$
and
 $y$
directions. As such, the problem must be viewed from two perspectives: in the plane spanned by the vertical direction and the dipole axis (
 $x$
-axis) (figure 6), and the plane perpendicular to the dipole axis (
 $y$
-axis) (figure 7). Figure 6 shows a behaviour that is comparable to that previously observed with a vertical magnet. The sheath is stronger in regions where the magnetic field lines are perpendicular to the surface, while becoming significantly thinner where the field lines are parallel to the surface. This is explained by electrons following the magnetic field lines which consequently leads to a stronger negative surface potential where the magnetic field lines intersect the surface. When looking at the problem from a perspective rotated by
 $90^{\circ }$
around the vertical axis, an interesting effect is visible. Even though the magnetic field is symmetric, the sheath shows asymmetric behaviour and weakens from directly above the magnet to approximately 10 mm to the left. Left of this region, the sheath shows significantly enhanced upward acceleration, while remaining unaffected on the right. This may be attributed to the
 $E\times B$
drift that moves the electrons perpendicular to the vertical electric sheath field and the magnetic field to the left. Further, this leads to a shift of the stable particle levitation region in the
 $E\times B$
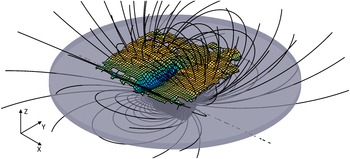
direction similar to observations by Puttscher & Melzer (Reference Puttscher and Melzer2014) who have accounted the shift to a balance of ambipolar electric field and drag forces. Figures 6 and 7 only represent two-dimensional samples of the complete data set. Figure 8 shows a three-dimensional representation of the height where the vertical sheath field acceleration equals gravity, demonstrating the capability of the method to create good visualization of complex dust–plasma interactions in a plasma sheath.
Visualization of the height at which the vertical sheath fields compensate gravity above a magnet with horizontal dipole axis. The black lines represent the magnetic field lines.

5.4 Lunar swirls
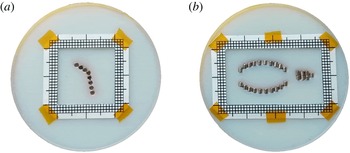
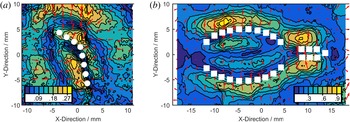
Lunar swirls are patterns of high albedo on the lunar surface that are found in the vicinity of strong magnetic anomalies. The formation process is not completely understood yet, however multiple theories suggest that the interactions of the lunar plasma environment with the local magnetic fields create these patterns either by shielding the surface from the solar wind or by transportation of fine dust. The experimental conditions discussed above involve magnetized electrons and unmagnetized ions similar to the lunar environment. As such the GEC reference cell has been used as a test bed to investigate analogue plasma magnetic field interactions. Based on Hemingway & Garrick-Bethell (Reference Hemingway and Garrick-Bethell2012), small scale models of the magnetic fields found at the Reiner Gamma formation and Airy formation have been built using multiple dipole magnets. Cylindrical NdFeB magnets of diameter and length 1.59 mm and grade N40 have been used, covered by a glass plate of 1.5 mm thickness. The resulting field strength at the surface is in both cases of the order of 50 mT. In case of Airy the dipole axis is almost perpendicular to the surface, while it is horizontal for Reiner Gamma (Hemingway & Garrick-Bethell Reference Hemingway and Garrick-Bethell2012). The scaled models, with each 50 mm in diameter, are shown in figure 9. Due to their complex shape, these models represent a perfect opportunity to test the method’s capability of generating three-dimensional vector fields of the particle accelerations. Figure 10 shows a representative example of the horizontal accelerations of the negatively charged dust particles for both Airy and Reiner Gamma formations. Qualitatively, the results show trends similar to those seen in results from a single dipole magnet. The dust is repelled from regions where the magnetic field has a relatively strong vertical component, while the dust is attracted to those regions with strong horizontal fields. In the case of the Reiner Gamma formation, where the dipole axis is almost parallel to the surface, no clear influence of the
 $E\times B$
drift can be observed, in contrast to the example in figure 7. This, however, might be explained by the comparatively weak magnetic field strength compared to the larger single dipole magnet.
Small scale models of the magnetic fields at Airy formation (a) and Reiner Gamma formation (b). Note that the dipole axis of each individual magnet is roughly along the vertical direction for the Airy formation, while the dipole axis of each magnet is roughly horizontal for the Reiner Gamma formation.

Horizontal accelerations of particles 0.5 mm above the surface for the model of Airy formation (a) and the model of Reiner Gamma formation (b). The colour shading represents the magnitude of the acceleration in units of g, while the arrows indicate the direction.

6 Conclusions
A method has been introduced that allows measurement of the accelerations of monodisperse dust particles in a plasma environment. It can produce three-dimensional vector-fields of the accelerations, allowing conclusions to be drawn about the processes taking place within the plasma. The method also provides an easy technique for determining the quantifiable forces acting on the dust particles and an easy-to-read map of these forces in one-, two- and three-dimensional space. Examples illustrating the advantages of the method have been given across several areas of interest using data collected in an experimental GEC reference cell. These examples include examination of the plasma sheath above a negatively biased electrode, the confinement forces within a glass box, multiple scenarios examining magnetic field plasma interactions with a single dipole magnet in vertical and horizontal orientation and a magnetic field configuration mimicking the environment found at lunar swirls. Although applicability has only been shown across a relatively small plasma regime, it has been pointed out that by appropriate choice of other particle materials and sizes, the technique described can easily be applied in a much wider range of plasma conditions.
Acknowledgement
This work was supported by the National Science Foundation under grant nos 1262031 and 1414523.